EUR/USD Current price: 1.3314
View Live Chart for the EUR/USD
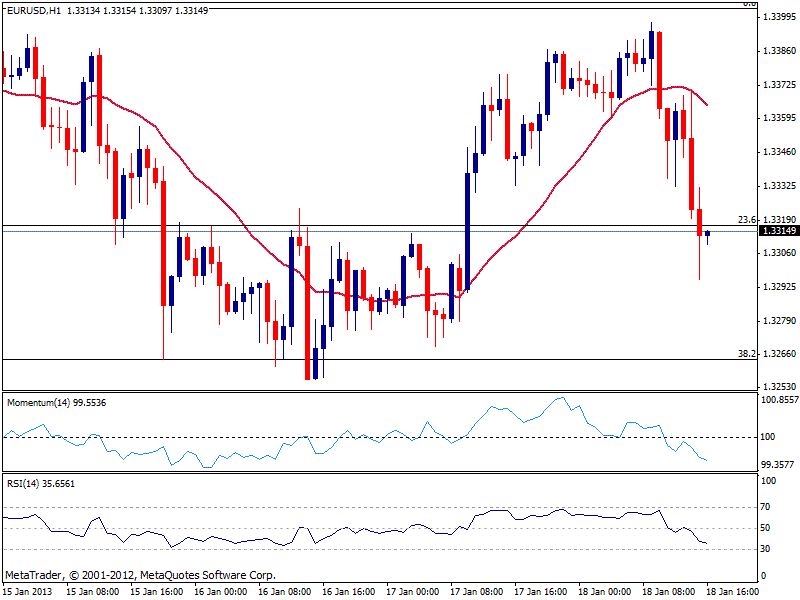
With US stocks set to open near a multi-year high and gold firming near $ 1700/oz, one should had expected EUR/USD to breach 1.3400. However, the pair trades heavily, having suffered a knee jerk down to 1.3295 on market rumors involving LTRO. Nothing was official or confirmed. On contrary, the EU authorities are full of positive news: Spain has met conditions to receive aid, and Greece will likely get its next tranche of aid. The EUR/USD however, continues trading heavily and the hourly chart shows indicators heading strongly south below their midlines, while current candle opened below the 1.3320 Fibonacci level, now short term resistance. If the pair is unable to quickly regain it, there’s scope for a retest of 1.3250/60 weekly lows and 38.2% retracement of the same rally. With a double top developing at 1.3400, the 1.3250/60 area stands as the neckline: expect increasing bearish momentum if the level gives up.
Support levels: 1.3290 1.3250 1.3210
Resistance levels: 1.3320 1.3360 1.3400
GBP/USD Current price: 1.5925
View Live Chart for the GBP/USD (select the currency)
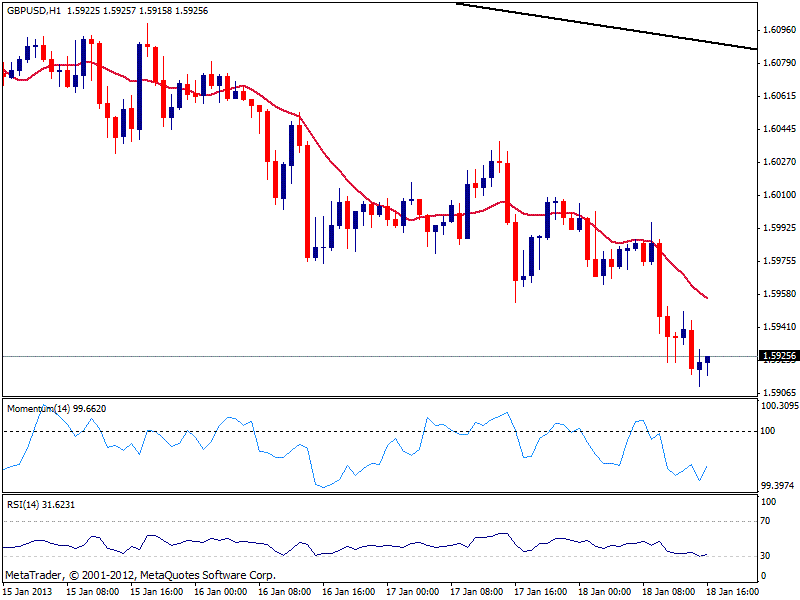
The GBP/USD was accelerated today by worse than expected Retail Sales in the UK, that printed-.0.1% against a 0.2% gain. So far the daily low stands at 1.5908, with the hourly chart still holding a bearish tone: 20 SMA continues to gain bearish slope above current price while the pair reaches lower lows with lower highs. Indicators in the mentioned time frame are attempting to head higher near oversold readings, yet unless a strong recovery above 1.5950, the upside seems well limited. Main target now lies at 1.5820, past November monthly low.
Support levels: 1.5900 1.5865 1.5820
Resistance levels: 1.5950 1.5990 1.6020
USD/JPY Current price: 89.95
View Live Chart for the USD/JPY (select the currency)
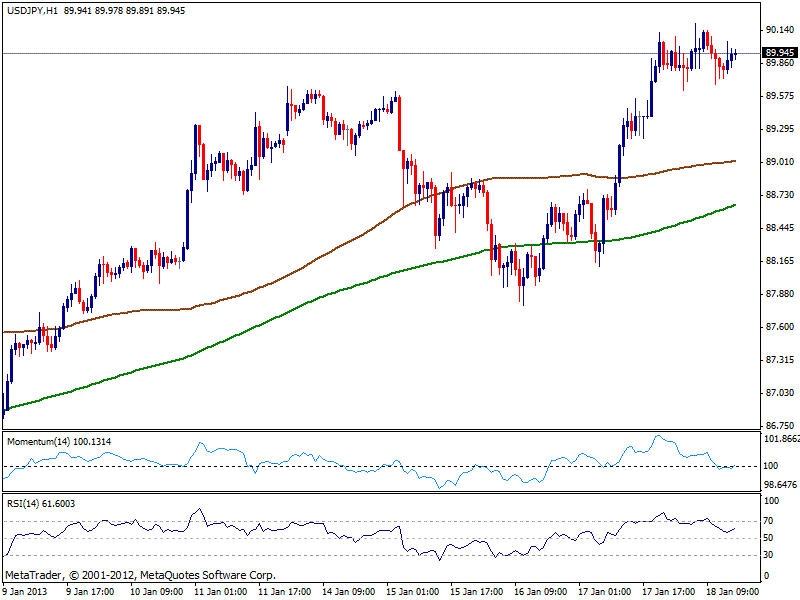
Stuck below 90.00, the USD/JPY maintains its bullish tone, supported by Japanese PM Abe, who stated that Japan should not worry unless the pair breaks above 110.00. In the hourly chart, technical indicators maintain a neutral stance, while moving averages are slowly turning north below current price. With not much short term strength, bigger time frames hold to a strong bullish momentum, which suggest the downside will also remain limited. Break above 90.00 and steady gains above will expose 92.50 for next week.
Support levels: 89.65 80.30 89.00
Resistance levels: 90.10 90.40 90.75
AUD/USD: Current price: 1.0507
View Live Chart for the AUD/USD (select the currency)
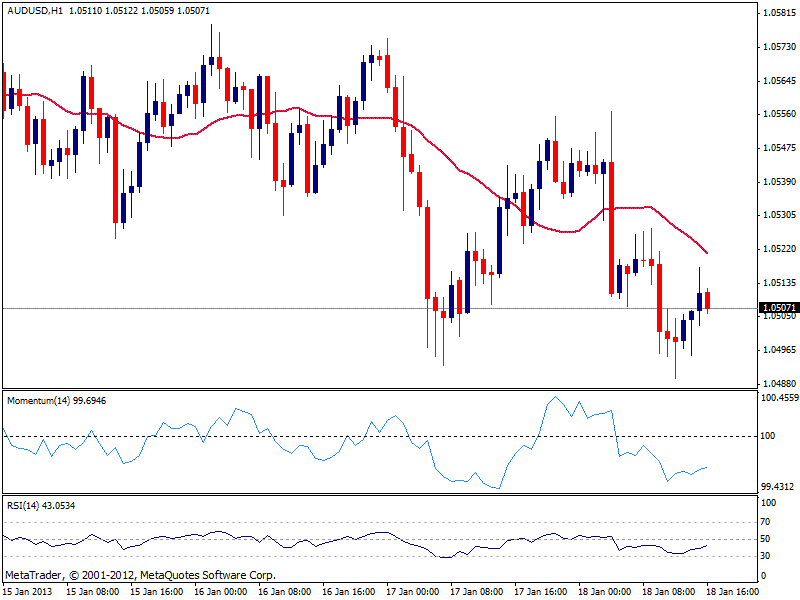
Aussie trades lower against the greenback, bouncing again from 1.0490 support yet unable to extend this time beyond 1.0520 resistance. The hourly chart shows 20 SMA gaining bearish slope above current level and offering dynamic resistance also around 1.0520, while indicators hold in negative territory. In the 4 hours chart however, and despite technical readings hold in negative territory, there’s no bearish strength. Overall, the downside is favored with a clear break of 1.0490, targeting then the 1.0430 price zone.
Support levels: 1.0490 1.0450 1.0430
Resistance levels: 1.0520 1.0550 1.0580
Recommended Content
Editors’ Picks
EUR/USD edges lower toward 1.0700 post-US PCE

EUR/USD stays under modest bearish pressure but manages to hold above 1.0700 in the American session on Friday. The US Dollar (USD) gathers strength against its rivals after the stronger-than-forecast PCE inflation data, not allowing the pair to gain traction.
GBP/USD retreats to 1.2500 on renewed USD strength

GBP/USD lost its traction and turned negative on the day near 1.2500. Following the stronger-than-expected PCE inflation readings from the US, the USD stays resilient and makes it difficult for the pair to gather recovery momentum.
Gold struggles to hold above $2,350 following US inflation

Gold turned south and declined toward $2,340, erasing a large portion of its daily gains, as the USD benefited from PCE inflation data. The benchmark 10-year US yield, however, stays in negative territory and helps XAU/USD limit its losses.
Bitcoin Weekly Forecast: BTC’s next breakout could propel it to $80,000 Premium

Bitcoin’s recent price consolidation could be nearing its end as technical indicators and on-chain metrics suggest a potential upward breakout. However, this move would not be straightforward and could punish impatient investors.
Week ahead – Hawkish risk as Fed and NFP on tap, Eurozone data eyed too

Fed meets on Wednesday as US inflation stays elevated. Will Friday’s jobs report bring relief or more angst for the markets? Eurozone flash GDP and CPI numbers in focus for the Euro.