![]() Nick Mastrandrea
Nick Mastrandrea
Market Tea Leaves
Good Morning Traders,
As of this writing 3:50 AM EST, here’s what we see:
US Dollar: Down at 93.660. The US Dollar is down 120 ticks and trading at 93.660.
Energies: June Crude is down at 44.11.
Financials: The June 30 year bond is up 1 tick and trading at 165.14.
Indices: The June S&P 500 emini ES contract is down 1 tick and trading at 2043.75.
Gold: The June gold contract is trading up at 1280.70. Gold is 84 ticks higher than its close.
Initial Conclusion
This is not a correlated market. The dollar is down- and crude is down- which is not normal but the 30 year bond is trading higher. The Financials should always correlate with the US dollar such that if the dollar is lower then bonds should follow and vice-versa. The indices are down and Crude is trading lower which is not correlated. Gold is trading up which is correlated with the US dollar trading down. I tend to believe that Gold has an inverse relationship with the US Dollar as when the US Dollar is down, Gold tends to rise in value and vice-versa. Think of it as a seesaw, when one is up the other should be down. I point this out to you to make you aware that when we don’t have a correlated market, it means something is wrong. As traders you need to be aware of this and proceed with your eyes wide open.
All of Asia traded lower. As of this writing Europe is trading mainly lower with the exception of the Milan and Spanish IBEX exchanges which are trading higher.
Possible Challenges To Traders Today
– Average Hourly Earnings m/m is out at 8:30 AM EST. This is major.
– Non-Farm Employment Change is out at 8:30 AM EST. This is major.
– Unemployment Rate is out at 8:30 AM EST. This is major.
– Consumer Credit m/m is out at 3 PM EST. This is major.
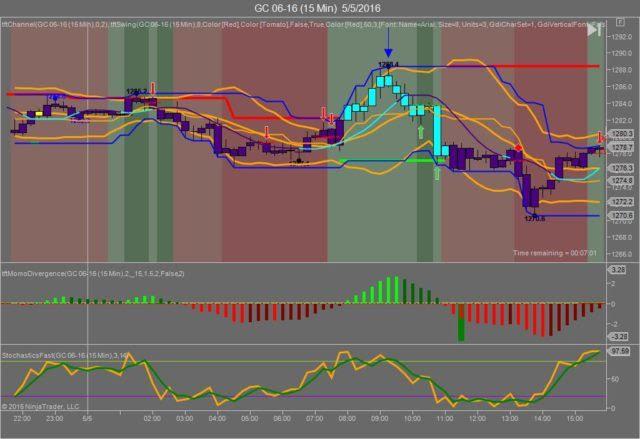
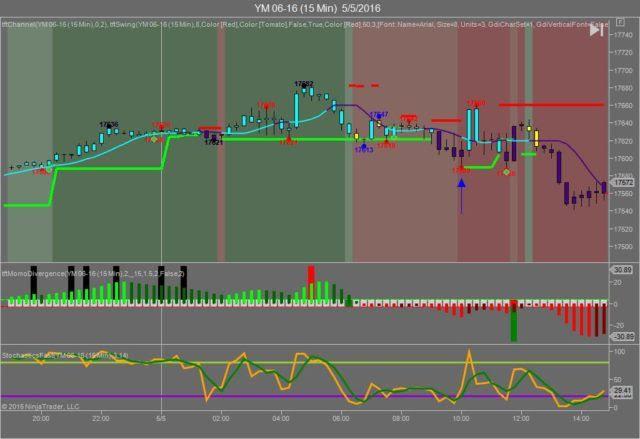
Gold
We’ve elected to switch gears a bit and show correlation between Gold and The YM futures contract. The YM contract is the DJIA and the purpose is to show reverse correlation between the two instruments. Remember it’s liken to a seesaw, when up goes up the other should go down and vice versa.
Yesterday Gold made it’s move at around 9:30 AM EST after the 8:30 round of economic news was reported. The YM hit a low at around that time and Gold hit a high. If you look at the charts below the YM gave a signal at around 9:30 AM EST, while Gold also gave a signal at just about the same time. Look at the charts below and you’ll see a pattern for both assets. The YM hit a low at around 9:30 AM EST and Gold hit a high. These charts represent the latest version of Trend Following Trades and I’ve changed the timeframe to a 15 minute chart to display better. This represented a shorting opportunity on Gold, as a trader you could have netted about 50 plus ticks per contract on this trade. Each tick is worth $10. We added a Donchian Channel to the charts to show the signals more clearly.
Charts Courtesy of Trend Following Trades built on a Ninja Trader platform
Bias
Yesterday we gave the markets an upside bias as the Bonds were trading lower and this usually represents and upside bias. The Dow rose by 9 points but the other indices fell slightly. Given that today is Jobs Friday we will maintain a neutral bias. Why? Because the markets have never shown any sense of normalcy on this day.
Could this change? Of Course. Remember anything can happen in a volatile market.
Commentary
Yesterday we gave the markets an upside bias as the Bonds were trading down and we felt the markets were due for a rebound. The Dow gained slightly over 9 points. Not much to be sure but upside is upside. Of course today we have Non-Farm Payrolls and yesterday the unemployment claims were up by about 13,000. The good news here is the Fed probably won’t be raising rates any time soon.
Trading performance displayed herein is hypothetical. The following Commodity Futures Trading Commission (CFTC) disclaimer should be noted.
Hypothetical performance results have many inherent limitations, some of which are described below. No representation is being made that any account will or is likely to achieve profits or losses similar to those shown.
In fact, there are frequently sharp differences between hypothetical performance results and the actual results subsequently achieved by any particular trading program. One of the limitations of hypothetical performance trading results is that they are generally prepared with the benefit of hindsight.
In addition, hypothetical trading does not involve financial risk, and no hypothetical trading record can completely account for the impact of financial risk in actual trading. For example, the ability to withstand losses or to adhere to a particular trading program in spite of trading losses are material points which can also adversely affect actual trading results.
There are numerous other factors related to the markets in general or to the implementation of any specific trading program which cannot be fully accounted for in the preparation of hypothetical performance results and all of which can adversely affect actual trading results.
Trading in the commodities markets involves substantial risk and YOU CAN LOSE A LOT OF MONEY, and thus is not appropriate for everyone. You should carefully consider your financial condition before trading in these markets, and only risk capital should be used.
In addition, these markets are often liquid, making it difficult to execute orders at desired prices. Also, during periods of extreme volatility, trading in these markets may be halted due to so-called “circuit breakers” put in place by the CME to alleviate such volatility. In the event of a trading halt, it may be difficult or impossible to exit a losing position.
Recommended Content
Editors’ Picks
EUR/USD holds above 1.0700 ahead of key US data

EUR/USD trades in a tight range above 1.0700 in the early European session on Friday. The US Dollar struggles to gather strength ahead of key PCE Price Index data, the Fed's preferred gauge of inflation, and helps the pair hold its ground.
USD/JPY stays above 156.00 after BoJ Governor Ueda's comments

USD/JPY holds above 156.00 after surging above this level with the initial reaction to the Bank of Japan's decision to leave the policy settings unchanged. BoJ Governor said weak Yen was not impacting prices but added that they will watch FX developments closely.
Gold price oscillates in a range as the focus remains glued to the US PCE Price Index

Gold price struggles to attract any meaningful buyers amid the emergence of fresh USD buying. Bets that the Fed will keep rates higher for longer amid sticky inflation help revive the USD demand.
Sei Price Prediction: SEI is in the zone of interest after a 10% leap

Sei price has been in recovery mode for almost ten days now, following a fall of almost 65% beginning in mid-March. While the SEI bulls continue to show strength, the uptrend could prove premature as massive bearish sentiment hovers above the altcoin’s price.
US core PCE inflation set to signal firm price pressures as markets delay Federal Reserve rate cut bets

The core PCE Price Index, which excludes volatile food and energy prices, is seen as the more influential measure of inflation in terms of Fed positioning. The index is forecast to rise 0.3% on a monthly basis in March, matching February’s increase.