![]() Matthew Ashley
Matthew Ashley
Blackwell Global Investments Limited
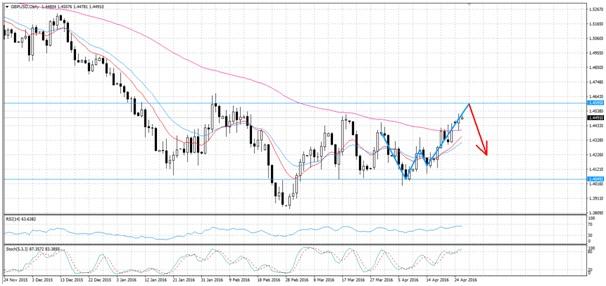
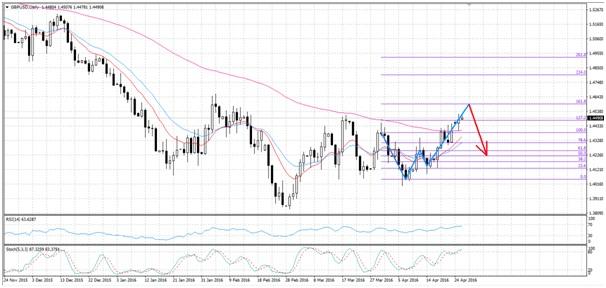
Despite an encouraging rally over the past week or so, the Cable looks relatively set to be taking a plunge back to the recent low at 1.4049. Specifically, the formation of a Gartley pattern, as the pair reaches the upside constraint of its sideways channel, could be indicative of a rather spectacular fall in the near future. Additionally, a combination of oscillator readings and the ever-present bearish 100 day EMA could provide strong downwards pressure as the pair nears the 1.4595 resistance level.
Firstly, the formation of a rather robust bearish crab is nearing completion which should see the pound falling after testing resistance at 1.4595. Presently, the pair still has some way to move before the pattern is completed in full. However, the movements so far have mirrored what one would usually expect to see in a bearish crab pattern. As a consequence, once the final leg is completed, the Cable should begin to tumble back towards the downside constraint of the channel.
Additionally, the zone of resistance at 1.4595 coincides with the 161.8% Fibonacci retracement level. As this particular retracement level is usually the turning point of a bearish crab pattern and is also the upside constraint of the channel, the Cable will find some very strong resistance at this level. Consequently, it would take an incredibly favourable UK Advance GDP or other fundamental results to break out here.
Furthermore, the 100 day EMA is still relatively bearish and it is likely to provide some strong selling pressure for the pair. However, it is worth noting that the 12 and 20 day EMA’s are beginning to give stronger bullish signals than have been seen in some time. In the event 100 the day EMA passes below the shorter EMA’s, there may be some intense buying pressure at the crossover point.
Contrary to some of the EMA signals, the stochastic and RSI oscillators are providing a reading which is in line with the bearish crab pattern. Specifically, the stochastic oscillator is signalling that the Cable is now overbought and the RSI is also verging on the same conclusion. Consequently, as the final leg of the crab pattern extends to the 161.8% Fibonacci level, we can expect the two oscillators to reach consensus and provide some very strong selling pressure. At this point, the plunge should begin and corrective movement back to support at 1.4049 should take place.
Ultimately, the Cable has been bearish for a significant period of time and the recent rally is unlikely to be the end of the trend. Consequently, the recent appreciation of the Pound against the USD is going to be met with some stiff opposition as it nears the upper constraint of the channel. The resulting fall may not find a new bottom but will certainly seek to test recent lows once again.
Forex and CFDs are leveraged financial instruments. Trading on such leveraged products carries a high level of risk and may not be suitable for all investors. Please ensure that you read and fully understand the Risk Disclosure Policy before entering any transaction with Blackwell Global Investments Limited.
Recommended Content
Editors’ Picks
EUR/USD trades with negative bias, holds above 1.0700 as traders await US PCE Price Index

EUR/USD edges lower during the Asian session on Friday and moves away from a two-week high, around the 1.0740 area touched the previous day. Spot prices trade around the 1.0725-1.0720 region and remain at the mercy of the US Dollar price dynamics ahead of the crucial US data.
USD/JPY jumps above 156.00 on BoJ's steady policy

USD/JPY has come under intense buying pressure, surging past 156.00 after the Bank of Japan kept the key rate unchanged but tweaked its policy statement. The BoJ maintained its fiscal year 2024 and 2025 core inflation forecasts, disappointing the Japanese Yen buyers.
Gold price flatlines as traders look to US PCE Price Index for some meaningful impetus

Gold price lacks any firm intraday direction and is influenced by a combination of diverging forces. The weaker US GDP print and a rise in US inflation benefit the metal amid subdued USD demand. Hawkish Fed expectations cap the upside as traders await the release of the US PCE Price Index.
Sei Price Prediction: SEI is in the zone of interest after a 10% leap

Sei price has been in recovery mode for almost ten days now, following a fall of almost 65% beginning in mid-March. While the SEI bulls continue to show strength, the uptrend could prove premature as massive bearish sentiment hovers above the altcoin’s price.
US economy: Slower growth with stronger inflation

The US Dollar strengthened, and stocks fell after statistical data from the US. The focus was on the preliminary estimate of GDP for the first quarter. Annualised quarterly growth came in at just 1.6%, down from the 2.5% and 3.4% previously forecast.