![]()
Last week saw precious metals stage a sharp rally. Gold extended its advance for a second week after a particularly strong rally on Wednesday and silver closed in the black for the third straight week. Both metals were underpinned first and foremost by a weaker US dollar, which meanwhile ended in the red for the fifth straight week. Clearly, this was a direct result of some disappointing US macro pointers which helped to push expectations about the first Fed rate hike further out. Indeed, even the Fed’s Charles Evans today said the central bank should hold off raising rates until at least early 2016. Mr Evans would like to see evidence that the soft data in Q1 was a “transitory aberration” and he is also worried that “inflation is too low.” Though the dollar has rebounded modestly at the start of this week, precious metals are holding up relatively well. Indeed, gold is trading at a good $1230 per ounce at the time of this writing while silver is hovering around the $17.70 mark. Both metals are thus at their best levels since February. With the Greek concerns hanging over the markets and the prospects of a Fed rate hike pushed further out, the opportunity cost for holding the safe haven metals appears to have diminished, especially as European equities are also losing some of their lustre. That said ETF investors don’t seem to be too impressed by gold’s upsurge yet. The world’s largest gold-backed ETF, the SPDR Gold Trust, saw no new net inflows last week. In fact, holdings were slashed by 4.4 tonnes last week and are already down more than 15 tonnes since the beginning of the month. Clearly, ETF investors are taking advantage of the firmer prices to reduce their holdings. This argues against the prospects of a sharp and sustained rally. Until such a time that ETFs experience noticeable inflows, gold will remain extremely vulnerable to sudden price drops. What’s more, the CFTC’s latest positioning data shows that money managers had already expanded their bullish bets in the week to 12 May and are likely to have increased their positions further in the wake of the rally since then. In other words, gold is now vulnerable to a sharp pullback if these speculators now take profit on their bullish positions.
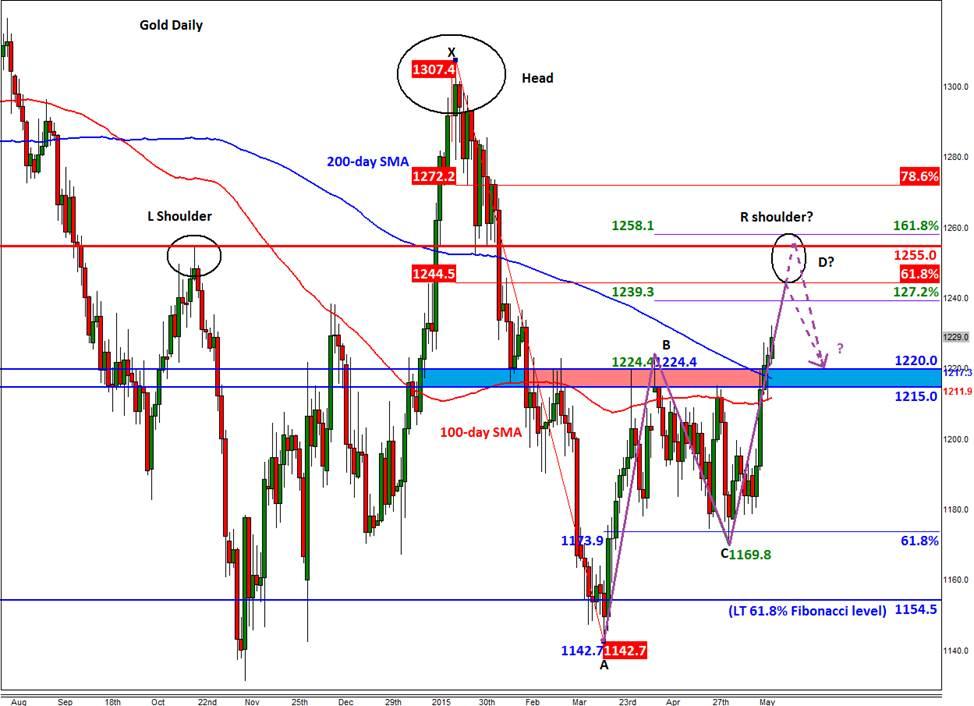
Nevertheless, the buyers appear to be in control of the near term trend now after they managed to take out sturdy resistance around $1220 last week. Thus the path of least resistance is now to the upside and more gains could be on the way later this week, US data permitting. Though it is possible that gold may have already formed a bottom (see the weekly chart, below), in the short-term, a potential Head and Shoulders pattern may cause gold to drop back significantly. As can be seen on the daily chart, the right shoulder of this reversal pattern may come in around the $1245-60 area for not only was this where the left shoulder was formed, here there will be a couple of Fibonacci levels that may also offer resistance. At the lower end of this range is the 61.8% retracement of the downswing from January while at the upper end it is the 161.8% extension of the last notable pullback from the April high. Therefore given the sheer number of technical levels converging in close proximity to each other, there is an increased probability for the rally to stall around this $1245-60 area, assuming it will get there in the first place. In any case, a potential closing break below the $1215-$1220 support range would put the bears back in control.
Figure 1:
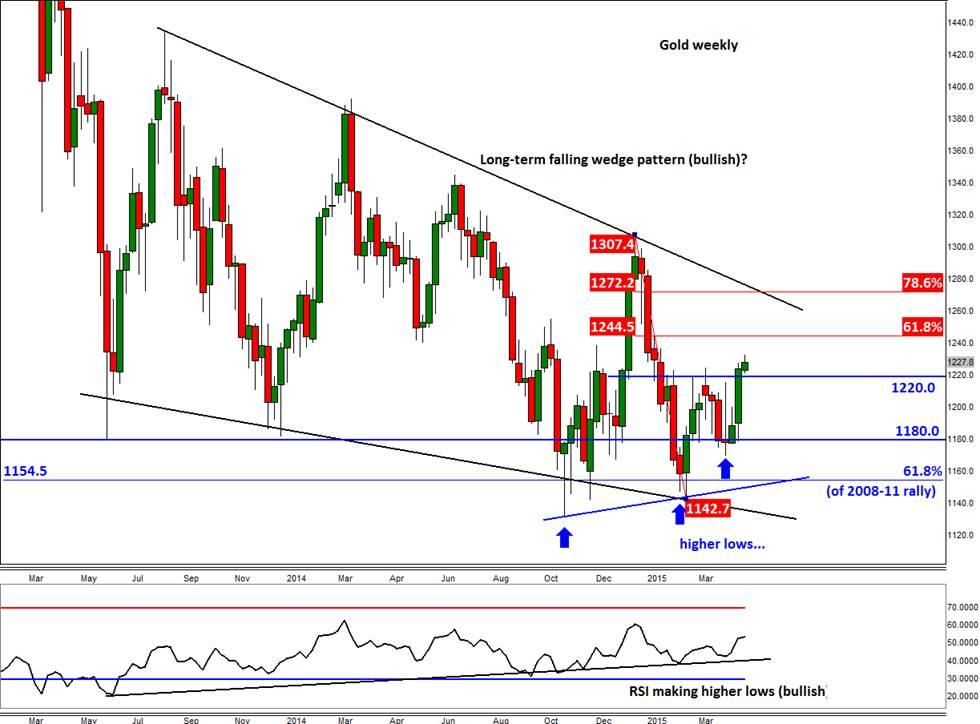
But gold’s weekly chart is showing a few clear long-term bullish signs – one being the bear’s inability to push the metal decisively below the long-term 61.8% Fibonacci retracement at $1155 on at least five attempts since November. Anyone who trades gold will know how important this 61.8% Fibonacci retracement level is on literally any time frame. So the fact that the long-term 61.8% level is holding is very encouraging for the gold bugs. What’s more, gold has created a couple of higher lows already and is on the verge of making another one if it breaks decisively above the $1220 horizontal resistance level and the 200-day moving average at $1218. If broken, the next logical target would be the 61.8% Fibonacci retracement of the downswing from the January high, at just shy of $1245. Beyond the 61.8% Fibonacci level is the long-term downward-sloping trend of the falling wedge pattern around $1270. If and when gold breaks this barrier then we could be talking about much, much, higher levels. Meanwhile, if the sellers defend this $1218/20 area then we wouldn’t be surprised if gold drops back to support levels at $1200 or even $1180, before deciding on its next move. Put another way, gold is currently at a key technical juncture and what it does next could determine the near-term direction at the very least. More importantly, gold’s next move could certainly open some decent trading opportunities for next week.
Figure 2:
Trading leveraged products such as FX, CFDs and Spread Bets carry a high level of risk which means you could lose your capital and is therefore not suitable for all investors. All of this website’s contents and information provided by Fawad Razaqzada elsewhere, such as on telegram and other social channels, including news, opinions, market analyses, trade ideas, trade signals or other information are solely provided as general market commentary and do not constitute a recommendation or investment advice. Please ensure you fully understand the risks involved by reading our disclaimer, terms and policies.
Recommended Content
Editors’ Picks
EUR/USD holds below 1.0750 ahead of key US data

EUR/USD trades in a tight range below 1.0750 in the European session on Friday. The US Dollar struggles to gather strength ahead of key PCE Price Index data, the Fed's preferred gauge of inflation, and helps the pair hold its ground.
USD/JPY stays firm above 156.00 after BoJ Governor Ueda's comments

USD/JPY stays firm above 156.00 after surging above this level on the Bank of Japan's decision to leave the policy settings unchanged. BoJ Governor said weak Yen was not impacting prices but added that they will watch FX developments closely.
Gold price oscillates in a range as the focus remains glued to the US PCE Price Index

Gold price struggles to attract any meaningful buyers amid the emergence of fresh USD buying. Bets that the Fed will keep rates higher for longer amid sticky inflation help revive the USD demand.
Bitcoin Weekly Forecast: BTC’s next breakout could propel it to $80,000 Premium

Bitcoin’s recent price consolidation could be nearing its end as technical indicators and on-chain metrics suggest a potential upward breakout. However, this move would not be straightforward and could punish impatient investors.
US core PCE inflation set to signal firm price pressures as markets delay Federal Reserve rate cut bets

The core PCE Price Index, which excludes volatile food and energy prices, is seen as the more influential measure of inflation in terms of Fed positioning. The index is forecast to rise 0.3% on a monthly basis in March, matching February’s increase.

