![]()
Highlights
- Market Movers: Weekly Technical Outlook
- The Dollar is Back!
- Look Ahead: Equities
- Look Ahead: Commodities
- Global Data Highlights
Market Movers: Weekly Technical Outlook
Technical Developments to Watch:
- EUR/USD consolidating between support at 1.28 and 1.31 resistance
- GBP/USD pressing 1.6280 resistance ahead of massive Scottish Referendum
- USD/JPY rally hitting six-year highs, bias bullish above 1.0545 support
- USD/CHF in play, SNB may determine whether we break 0.9400-50 resistance
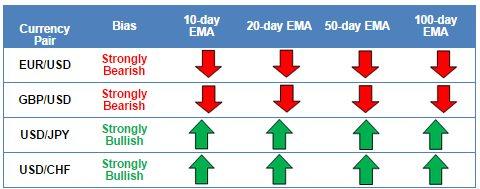
* Bias determined by the relationship between price and various EMAs. The following hierarchy determines bias (numbers represent how many EMAs the price closed the week above): 0 – Strongly Bearish, 1 – Slightly Bearish, 2 – Neutral, 3 – Slightly Bullish, 4 – Strongly Bullish.
** All data and comments in this report as of Friday’s European session close **
EUR/USD
- EURUSD inched to a new 14-month low in quiet trade
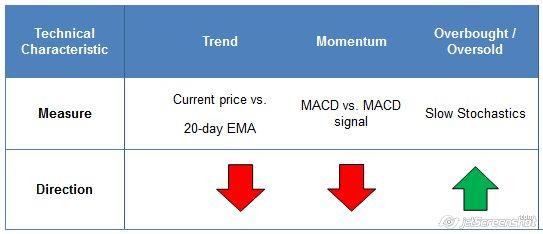
- MACD still shows bearish momentum, Slow Stochastics still in oversold territory
- Volatility likely to pick up heading into this week.
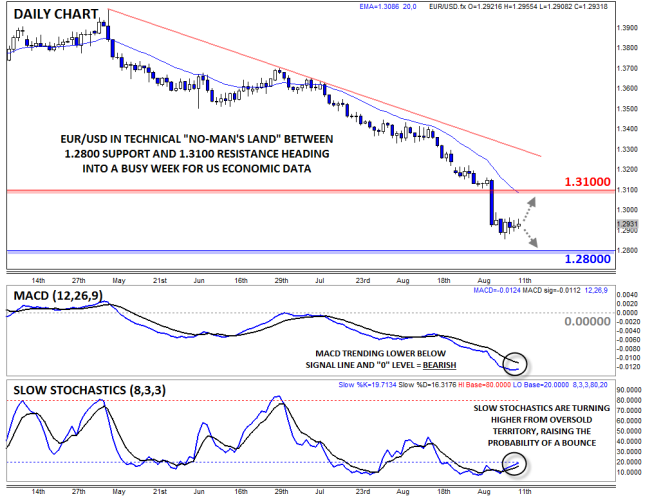
King Dollar reigns for another week. EURUSD dipped to a new 14-month low under 1.2900 in quiet trade last week. The biggest event risk of the week for the pair was Friday’s US Retail Sales report, which showed solid growth in US consumer activity. Looking to the chart, the pair is in a bit of a “no-man’s land” between support near 1.2800 and resistance at 1.3100. As you might expect, the MACD still shows strongly bearish momentum, while the Slow Stochastics indicator remains in oversold territory. With a busy slate of US economic data, including a highly anticipated Federal Reserve meeting, the pair is likely in for an injection of volatility this week.
Source: FOREX.com
GBP/USD
- GBP/USD recovered after gapping to new lows on Scottish Independence fears
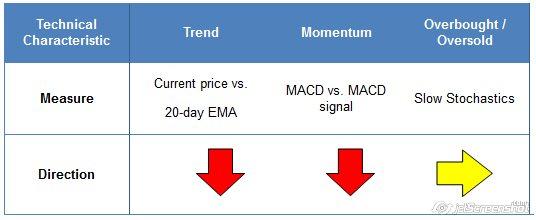
- Slow Stochastics turning higher from oversold territory
- All eyes on Thursday’s Scottish Independence referendum
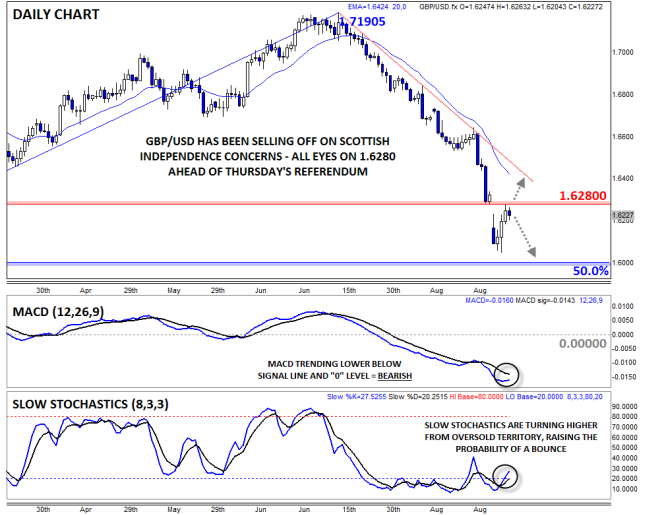
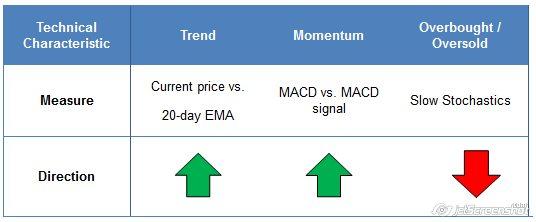
GBPUSD gapped sharply lower to start last week after a weekend poll showed an outright majority of likely Scottish voters in favor of independence. Rates recovered throughout the week as subsequent polls suggested the “no” votes still held a majority, but Thursday’s independence vote remains the marquee event risk for the week (for more, see the Data Highlights section below). Meanwhile, the GBPUSD’s MACD is still showing strongly bearish momentum, but the Slow Stochastics has turned higher from oversold territory, suggesting we may see a bounce from here. For this week, the GBPUSD’s outlook hinges almost entirely on Scotland’s Independence referendum; the pair may struggle to rally in the lead-up to the vote, but if the “No” voters are able to prevail, a short-covering rally could take GBPUSD back toward 20-day EMA / bearish trend line resistance at 1.6400.
Source: FOREX.com
USD/JPY
- USDJPY rally extended to hit new six-year highs above 107.00 last week
- MACD strongly bullish, Slow Stochastics deeply overbought
- Potential for further rallies if Fed turns more hawkish this week
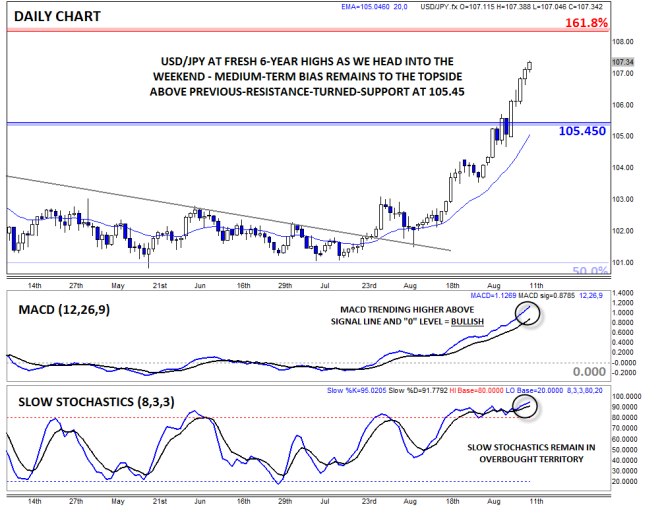
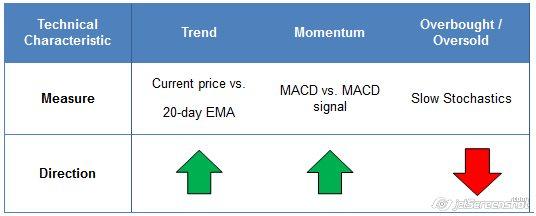
USDJPY extended its recent rally last week, surging to new six-year highs at 107.00. As we noted in Thursday’s piece, there are a number of eerie similarities between the price action in 2014 and 2012, suggesting that USDJPY may be on the verge of a major rally in the coming weeks. More immediately though, the outlook for the pair will depend on the Fed’s outlook for the economy and monetary policy on Wednesday, which could take the pair back toward support in the mid-105.00s or pour more fuel on the bullish fire for a possible rally to 108.00 or above.
Source: FOREX.com
USD/CHF
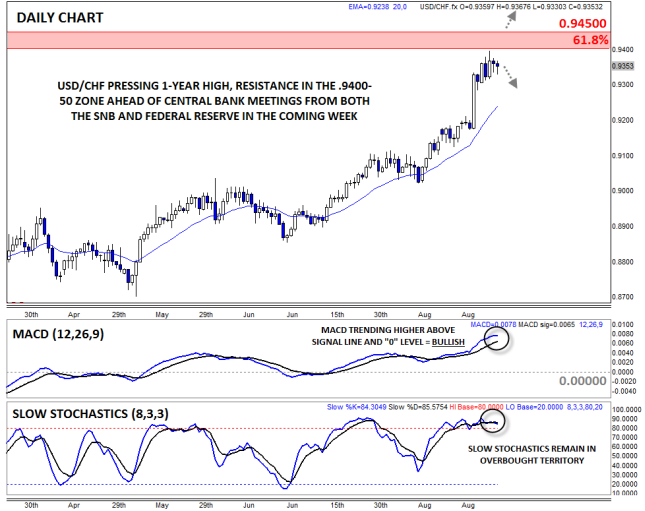
- USDCHF inched up to a one-year high at 0.9400 last week
- Like most other dollar pairs, the MACD is bullish, but Slow Stochastics are overbought
- Key resistance in the 0.9400 zone may cap rates unless the SNB goes negative
The USD/CHF is our currency pair in play this week due to a number of high-impact economic reports out of the U.S. and Switzerland, including central bank meetings in both countries (see “Data Highlights” below for more). From a technical perspective, the pair ticked up to a one-year high near 0.9400 last week, but the rally stalled out near long-term 61.8% Fibonacci retracement resistance at 0.9405. Of course, the MACD is showing strongly bullish momentum, but the Slow Stochastics are overbought after the prolonged rally. For this week, the Swiss National Bank will have to decide whether to follow the ECB down the negative-interest-rate rabbit hole, a decision that could extend the USDCHF rally through key resistance in the 0.9400-50 zone.
Source: FOREX.com
The Dollar is Back!
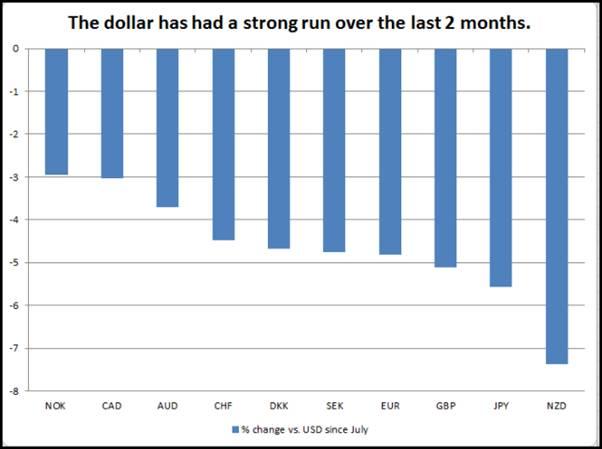
The dollar has had quite a rally over the last two months. Since July the dollar has risen consistently against the rest of the G10, and on a broader basis the only currency that has outperformed the dollar in the last two months is the Chinese renminbi. The renminbi has benefited from signs that its economy is picking up after a slump earlier this year and the government appears to have stopped intervening to weaken the CNY.
The dollar’s position as top performer in the G10 space is mostly courtesy of the Federal Reserve. The FOMC, who meet on Wednesday this week, are expected to start adjusting their communications to include a strategy to raise rates, potentially as early as the start of 2015. This is significantly before the ECB and 4 months ahead of the BOE. Dollar bulls were given a nudge in the right direction by Federal Reserve Bank of San Francisco who last week analysed market expectations of the timing of the first Fed funds hike, and the FOMC’s own expectations included in the most recent Summary of Economic Projections (SEP). It found that the public expected more accommodative monetary policy than the SEP suggests, and are less “uncertain about the future course of monetary policy” than the FOMC participants themselves. When the market’s expectations and the Fed’s expectations are not in line this can trigger a market reaction, and the dollar index climbed to a 14-month high on the back of this report.
But the big question is: Can the dollar keep pace with these gains? Interestingly, in the last two months the dollar has gained more than 7% against the Kiwi dollar, and more than 5% against the pound. Considering New Zealand interest rates are unlikely to come down any time soon, and the pound could come back once the Scottish referendum has passed later this week, we think that dollar strength against these two currencies could start to slow.
However, we would look for the greenback to continue to outperform the JPY, CHF and ECB, as their central banks are likely to embark on further loosening of monetary policy or keep policy loose for the long term. The CAD, Aussie and the Scandinavian pairs have fared the best against the dollar, although they are also down on a two-month basis. The Canadian loonie could be particularly resilient to a dollar upswing, if it is based on a stronger US economic recovery for the rest of this year. Canada has strong trade links with the US, so what is good for its neighbour’s economy is good for its economy, and the CAD could find some support as a result.
The Aussie dollar was supported last week by an extremely strong unemployment report. However, we think that was a one-off and the RBA are likely to err on the side of caution going forward, especially since the commodity boom seems to have ended. AUDNZD has also started to sell off last week after reaching its highest level since November 2013, which could see AUDUSD slip behind NZDUSD in the coming days.
Source: FOREX.com
Look Ahead: Equities
It was an uninspiring week for stocks as the lack of any major market-moving news or data discouraged market participants from establishing fresh bald positions at these elevated levels. The prior week’s disappointing US jobs report, combined with the Scottish independence fears in the UK, also weighed on the sentiment. The only noteworthy piece of US data – retail sales – was released on Friday, showing an increase of 0.6% in August. Although this was better than expected, the market’s reaction was more or less muted. It appears as though investors are assuming that the Fed will signal an interest rate hike at the FOMC meeting on Wednesday, hence the rallying dollar. In addition to the FOMC, there are at least two other major events to look forward to: the Scottish independence vote and Alibaba’s IPO – both on Thursday. If the Scots vote to stay in the UK, this should in theory at least alleviate some of the concerns that have recently become apparent from some of the UK and European businesses and investors alike. As a result, the UK’s FTSE could stage a relief rally and this may lend support to global markets, including the US. Meanwhile there’s apparently strong demand for Alibaba shares ahead of the tech giant’s IPO in New York. The Chinese Internet, e-commerce and computer software provider has set a $60-to-$66 price range for its IPO, which is expected to raise more than $20 billion. This would make it the largest technology listing in the history. According to media reports, the company is already planning to cover its books early after receiving strong demand for its shares.
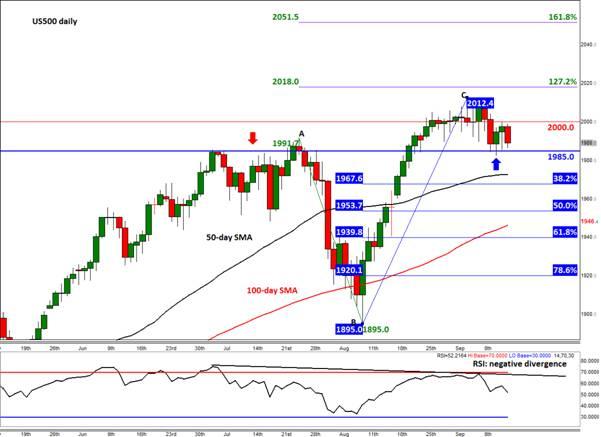
Meanwhile the technical outlook for the S&P looks mixed. Last week, the index rallied to a fresh all-time high of 2012 before slowly pulling back from there due to the lack of any supportive fundamental stimulus. But the selling has, for now at least, stalled around the resistance-turned-support level of 1985 which is a bullish development in our view. For as long as the buyers manage to hold their ground here (i.e. on a daily closing basis), the path of least resistance would likewise remain to the upside. In the very near term, they will need to push the index above the resistance and psychological level of 2000 in order to encourage fresh buying at these elevated levels. If and when last week’s record high is breached, the bulls may then target 2018 and possibly even 2051. These levels correspond with the 127.2 and 161.8 percent Fibonacci extension points of the corrective move we saw from July to August (i.e. the move from point A to B on the chart).
The bears will be hoping to see the S&P break the 1985 support level, preferably on a closing basis. If it does, a move down to the 50- or the 100-day moving average, at 1972 and 1946, could be on the cards soon. Traders will also want to watch some of the Fibonacci levels (of the BC rally) for support, especially the 38.2 and 61.8 percent levels at 1967 and 1940 respectively. They would be encouraged by the fact that the bullish momentum appears to be fading a touch: the RSI, for example, has failed to create a higher high like the underlying index, which suggests the momentum may be shifting in the bears’ favour.
Source: FOREX.com. Please note this product is not available to US clients.
Look Ahead: Commodities
Commodities have had a really bad week with gold, silver and crude oil all dropping sharply. If there was one reason that could explain their weakness it is this: the rallying dollar. The US currency has been climbing for weeks now as investors look forward to life after QE and the first rate hike early next year. It has been lent additional buoyancy by some stronger-than-expected US macroeconomic data as highlighted, for example, by Friday’s release of retail sales and consumer sentiment data. But as the US economy improves so too should demand for oil, which means the impact of the dollar is only temporary, especially on WTI. What’s more, with the summer now beyond us, demand for heating should begin to pick up. Oil prices may therefore bounce back from these extremely oversold levels, at least in the near term anyway. Over the slightly longer term, the excessive non-OPEC supply and the still-weak global demand argues against a sustained rally. Indeed, some of the major oil forecasters such as the EIA, IEA and OPEC have all lowered their demand projections for 2014. The OPEC has not only cut the world oil demand forecast (by 50 thousand barrels from its previous forecast to 1.05 million barrels per day), it has lifted the non-OPEC supply outlook, too (it envisages supply from this group of nations to be 1.58 mb/d in 2014, some 180 tb/d more than it had estimated last month). The EIA meanwhile expects global oil demand to be even less than 1 mb/d this year. On top of this, the oil agency’s weekly crude stockpiles report showed inventories in the US declined by just 1 million barrels last week which was bang in line with the estimates. Stocks at Cushing, the delivery hub for WTI, climbed slightly while crude products such as gasoline and distillate inventories increased. The data clearly points to weaker demand for crude and crude products from the world’s largest oil consumer.
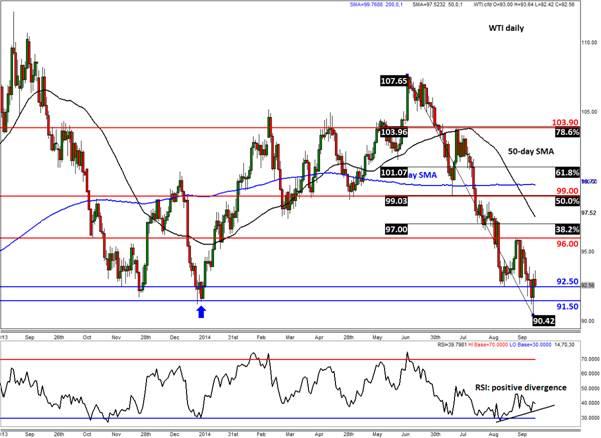
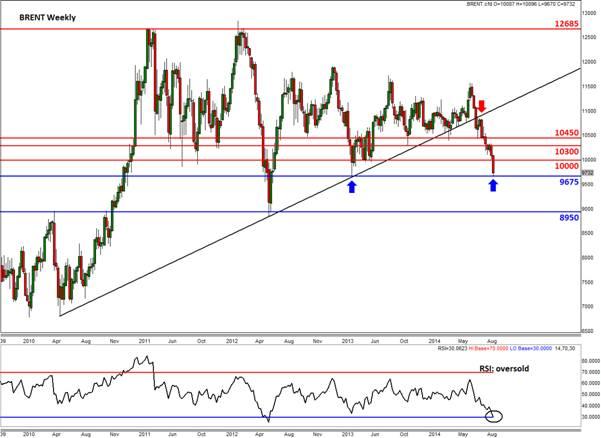
While the fundamental outlook does not look great for oil, the technicals point to a possible bounce in the price of both Brent and WTI. The US oil contract has already dipped below the $91.50 level where it had found major support in early January. But the bears could not hold their ground there, resulting in a possible false break, which is a major reversal pattern. As a result, WTI may push higher from here towards the next level of resistance at $94.00 or even $96 over the coming days. Meanwhile the RSI is in a state of positive divergence, suggesting that the bearish momentum is weakening. If eventually it manages to break above $96.00, then that could lead to a sharp rally as it would confirm this false break reversal pattern. But that level looks miles away from where we are at the moment and the chances are prices may weaken further instead. The bears will be hoping for a decisive daily close below the $91.20/50 area; if that happens we could see WTI drop towards a long-term bullish trend around $88 a barrel over the coming days and weeks. Brent meanwhile is testing $96.75 – the low hit in 2013. With the weekly RSI also in the oversold territory, there is a chance for a bounce back around this key support area. A break below here however could potentially pave the way for $89.50/$90.00.
Source: FOREX.com. Please note this product is not available to US clients.
Source: FOREX.com. Please note this product is not available to US clients.
General Risk Warning for stocks, cryptocurrencies, ETP, FX & CFD Trading. Investment assets are leveraged products. Trading related to foreign exchange, commodities, financial indices, stocks, ETP, cryptocurrencies, and other underlying variables carry a high level of risk and can result in the loss of all of your investment. As such, variable investments may not be appropriate for all investors. You should not invest money that you cannot afford to lose. Before deciding to trade, you should become aware of all the risks associated with trading, and seek advice from an independent and suitably licensed financial advisor. Under no circumstances shall Witbrew LLC and associates have any liability to any person or entity for (a) any loss or damage in whole or part caused by, resulting from, or relating to any transactions related to investment trading or (b) any direct, indirect, special, consequential or incidental damages whatsoever.
Recommended Content
Editors’ Picks
EUR/USD holds above 1.0700 ahead of key US data

EUR/USD trades in a tight range above 1.0700 in the early European session on Friday. The US Dollar struggles to gather strength ahead of key PCE Price Index data, the Fed's preferred gauge of inflation, and helps the pair hold its ground.
USD/JPY jumps above 156.00 on BoJ's steady policy

USD/JPY has come under intense buying pressure, surging past 156.00 after the Bank of Japan kept the key rate unchanged but tweaked its policy statement. The BoJ maintained its fiscal year 2024 and 2025 core inflation forecasts, disappointing the Japanese Yen buyers.
Gold price flatlines as traders look to US PCE Price Index for some meaningful impetus

Gold price lacks any firm intraday direction and is influenced by a combination of diverging forces. The weaker US GDP print and a rise in US inflation benefit the metal amid subdued USD demand. Hawkish Fed expectations cap the upside as traders await the release of the US PCE Price Index.
Sei Price Prediction: SEI is in the zone of interest after a 10% leap

Sei price has been in recovery mode for almost ten days now, following a fall of almost 65% beginning in mid-March. While the SEI bulls continue to show strength, the uptrend could prove premature as massive bearish sentiment hovers above the altcoin’s price.
US core PCE inflation set to signal firm price pressures as markets delay Federal Reserve rate cut bets

The core PCE Price Index, which excludes volatile food and energy prices, is seen as the more influential measure of inflation in terms of Fed positioning. The index is forecast to rise 0.3% on a monthly basis in March, matching February’s increase.
