![]()
Nearly 15 years ago, stock markets were the only topic of conversation in the US. The widely-followed S&P 500 index of large US companies was on its way to trade above 1500, while the tech-heavy NASDAQ index had surged to above 5,000. In retrospect, equity valuations were clearly in an unsustainable bubble, but euphoria and greed trumped all other considerations as stocks continued to trade higher.
Just yesterday the S&P500 broke to an all-time high above the widely-watched 2,000 level intraday, and traders can’t help but wonder if there are parallels to year 2000. After all, the index has more than tripled off its intraday low at 666 just five years ago, and certain sectors (including biotech and social media stocks) are trading at obscene valuations. In our view, there are some longer-term concerns that may provide headwinds over the next few months, but the situation is nowhere near as precarious as it was back in 2000.
Looking first at the fundamental picture, equities are clearly in a better position than they were at the turn of the millennium. Compared to its long-term average price-to-earnings ratio of 15.5, the S&P 500 is currently trading at a slight premium at 19.8, but far below the nauseating levels in excess of 40 that we saw in 2000. Longer-term valuation measures, like Tobin’s Q and the 10-year Cyclically-Adjusted P/E ratio, are at slightly more elevated levels, but those measures are not particularly useful for over the course of the next few weeks or months. Meanwhile, bullish sentiment is growing a bit frothy, but traders’ “buy the dip” mentality continues to support stocks on every short-term pullback.
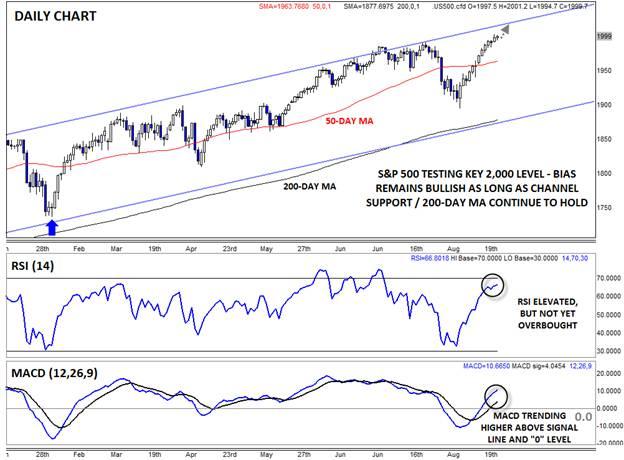
On a technical basis, the index continues to trend higher within its 2-year bullish channel. As long as the bullish structure remains intact, stocks’ path of least resistance will be to the topside. While the index is nearing the top of its channel after the recent rally to 2,000, pullbacks may remain limited in scope, given the lack of attractive alternative investments (bonds and commodities). The secondary indicators are also constructive at this point, with the RSI elevated, but not yet overbought, and the MACD trending higher above both its signal line and the “0” level.
As we roll into autumn, the forecast for the S&P 500 appears mostly sunny, though long-term thunderclouds are gathering far off on the horizon. In the short-term, the bullish party could take the index back to the top of its channel around 2015, though further gains from there may be more difficult. Meanwhile, a break below the 2-year bullish channel and 200-day MA (currently just below 1900) later this year would serve as a tornado siren for bullish traders to take cover.
This research is for informational purposes and should not be construed as personal advice. Trading any financial market involves risk. Trading on leverage involves risk of losses greater than deposits.
Recommended Content
Editors’ Picks
EUR/USD holds below 1.0750 ahead of key US data

EUR/USD trades in a tight range below 1.0750 in the European session on Friday. The US Dollar struggles to gather strength ahead of key PCE Price Index data, the Fed's preferred gauge of inflation, and helps the pair hold its ground.
USD/JPY stays firm above 156.00 after BoJ Governor Ueda's comments

USD/JPY stays firm above 156.00 after surging above this level on the Bank of Japan's decision to leave the policy settings unchanged. BoJ Governor said weak Yen was not impacting prices but added that they will watch FX developments closely.
Gold price oscillates in a range as the focus remains glued to the US PCE Price Index

Gold price struggles to attract any meaningful buyers amid the emergence of fresh USD buying. Bets that the Fed will keep rates higher for longer amid sticky inflation help revive the USD demand.
Bitcoin Weekly Forecast: BTC’s next breakout could propel it to $80,000 Premium

Bitcoin’s recent price consolidation could be nearing its end as technical indicators and on-chain metrics suggest a potential upward breakout. However, this move would not be straightforward and could punish impatient investors.
US core PCE inflation set to signal firm price pressures as markets delay Federal Reserve rate cut bets

The core PCE Price Index, which excludes volatile food and energy prices, is seen as the more influential measure of inflation in terms of Fed positioning. The index is forecast to rise 0.3% on a monthly basis in March, matching February’s increase.
