![]() Growth Aces Research Team
Growth Aces Research Team
Growth Aces
Do you want to know which are the Current Trading Positions of our contributors? Get a glance here.
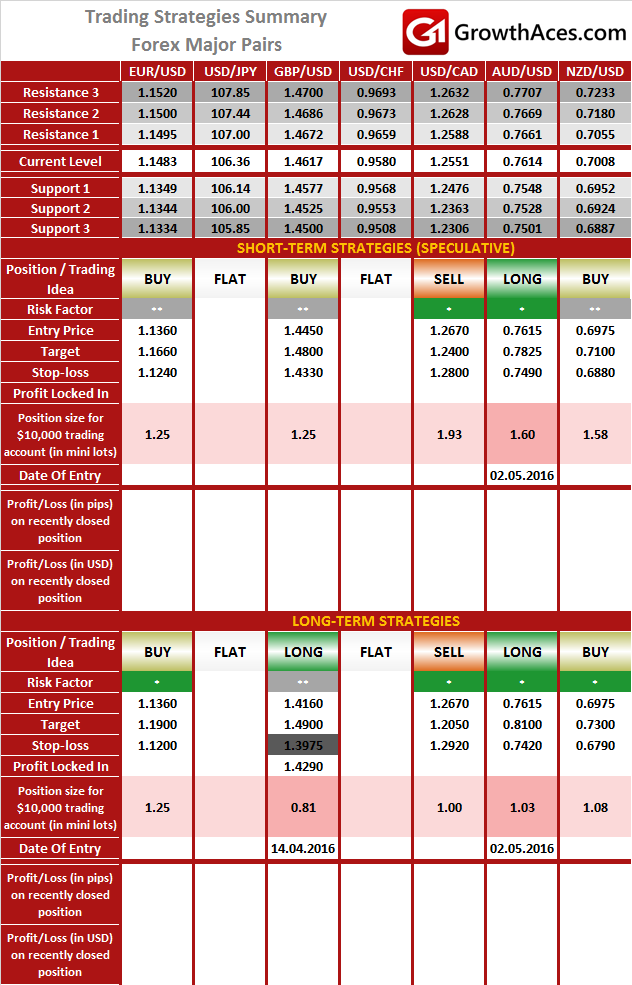
EUR/USD: Buy At 1.1360
-
US Commerce Department reported that the personal consumption expenditures (PCE) price index, excluding the volatile food and energy components, edged up 0.1% last month after increasing 0.2% in February. The so-called core PCE, which is the US central bank's preferred inflation measure and is running below its 2% target, rose 1.6% in the 12 months through March, after advancing 1.7% in February.
-
In a separate report, the Labor Department said its Employment Cost Index (ECI), the broadest measure of labor costs, increased 0.6% in the first quarter after gaining 0.5% in the fourth quarter. Labor costs rose 1.9% in the 12 months through March.
-
A strong dollar and lower energy prices are constraining inflation. Wage growth has been frustratingly slow and could remain moderate as the fairly robust labor market attracts people who had given up looking for work.
-
Lack of strong wage growth has contributed to moderate consumption growth. Consumer spending ticked up 0.1% in March after a 0.2% gain in February. The consumer spending figures were included in Thursday's gross domestic product report, which showed the economy growing at a 0.5% annual rate in the first quarter, a sharp slowdown from the fourth quarter's 1.4% pace. With income rising 0.4% in March and savings jumping to a more than three-year high last month, consumer spending is expected to regain momentum.
-
But households are likely to remain hesitant to loosen their purse strings in the near term, with a third report on Friday showing the University of Michigan's consumer sentiment index dipped to 89.0 in April from a reading of 91.0 in March.
-
Eurozone final manufacturing PMI for April came in at 51.7, better than the flash estimate of 51.5 and also slightly better than 51.6 previously. What stands out is the fact that the output price component remains stubbornly low with the April reading at 47.4 worse than the 47.1 flash reading although slightly better than the 47.1 in March.
-
Technical analysis suggests bullish trend to be continued. Tenkan and kijun lines are positive aligned, highlighting the upside bias. Surge on Friday left a large white candlestick line. We are looking to get long at 1.1360 which is ahead of Friday’s 1.1349 low, this should stem near-term corrective losses.
AUD/USD: Buy Ahead Of RBA Decision
-
The Aussie slipped last week after a surprisingly low inflation read in the first quarter prompted investors to price in a greater chance of a cut in interest rates. Interbank futures imply around a 50-50 chance of a cut tomorrow. But in our opinion the likelihood of such a move is low.
-
Markets hesitate to take large positions ahead of an interest rate decision by the Reserve Bank of Australia (RBA) on Tuesday and the AUD/USD is fluctuating in a narrow range. No change by the RBA tomorrow could push AUD/USD at least to 0.7750.
-
Also in focus on Tuesday is the government's annual budget, though it typically has limited impact on financial markets as Australia is seen a stable nation with relatively low debt.
-
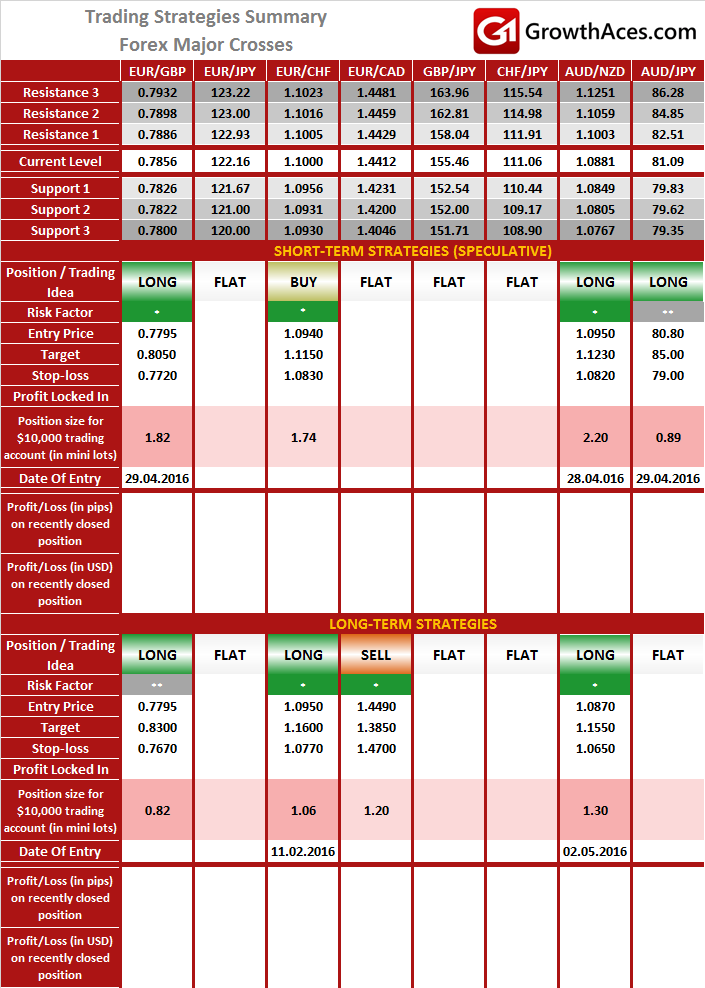
We went AUD/USD at 0.7615 today, as we expect the RBA to remain on hold tomorrow. We opened long-term AUD/NZD long at 1.0870.
FOREX - MAJOR PAIRS:
FOREX - MAJOR CROSSES:
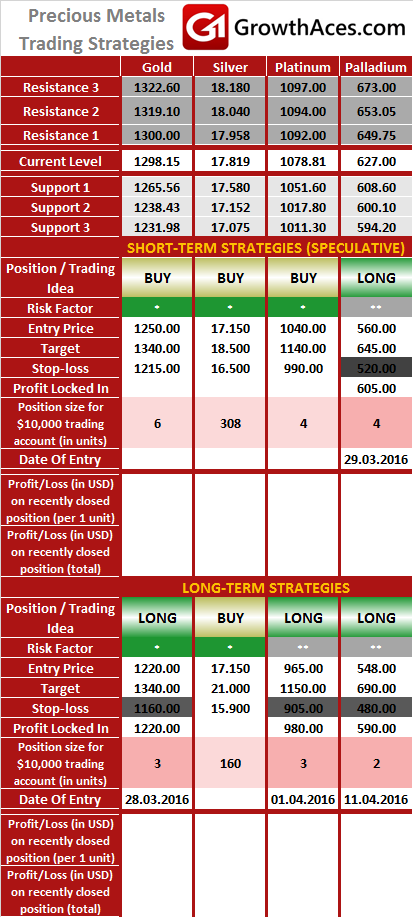
PRECIOUS METALS:
It is usually reasonable to divide your portfolio into two parts: the core investment part and the satellite speculative part. The core part is the one you would want to make profit with in the long term thanks to the long-term trend in price changes. Such an approach is a clear investment as you are bound to keep your position opened for a considerable amount of time in order to realize the profit. The speculative part is quite the contrary. You would open a speculative position with short-term gains in your mind and with the awareness that even though potentially more profitable than investments, speculation is also way more risky. In typical circumstances investments should account for 60-90% of your portfolio, the rest being speculative positions. This way, you may enjoy a possibly higher rate of return than in the case of putting all of your money into investment positions and at the same time you may not have to be afraid of severe losses in the short-term.
How to read these tables?
1. Support/Resistance - three closest important support/resistance levels
2. Position/Trading Idea: BUY/SELL - It means we are looking to open LONG/SHORT position at the Entry Price. If the order is filled we will set the suggested Target and Stop-loss level. LONG/SHORT - It means we have already taken this position at the Entry Price and expect the rate to go up/down to the Target level.
3. Stop-Loss/Profit Locked In - Sometimes we move the stop-loss level above (in case of LONG) or below (in case of SHORT) the Entry price. This means that we have locked in profit on this position.
4. Risk Factor - green "*" means high level of confidence (low level of uncertainty), grey "**" means medium level of confidence, red "***" means low level of confidence (high level of uncertainty)
5. Position Size (forex) - position size suggested for a USD 10,000 trading account in mini lots. You can calculate your position size as follows: (your account size in USD / USD 10,000) * (our position size). You should always round the result down. For example, if the result was 2.671, your position size should be 2 mini lots. This would be a great tool for your risk management! Position size (precious metals) - position size suggested for a USD 10,000 trading account in units. You can calculate your position size as follows: (your account size in USD / USD 10,000) * (our position size).
6. Profit/Loss on recently closed position (forex) - is the amount of pips we have earned/lost on recently closed position. The amount in USD is calculated on the assumption of suggested position size for USD 10,000 trading account.
Profit/Loss on recently closed position (precious metals) - is profit/loss we have earned/lost per unit on recently closed position. The amount in USD is calculated on the assumption of suggested position size for USD 10,000 trading account.
Our research is based on information obtained from or are based upon public information sources. We consider them to be reliable but we assume no liability of their completeness and accuracy. All analyses and opinions found in our reports are the independent judgment of their authors at the time of writing. The opinions are for information purposes only and are neither an offer nor a recommendation to purchase or sell securities. By reading our research you fully agree we are not liable for any decisions you make regarding any information provided in our reports. Investing, trading and speculation in any financial markets may involve high risk of loss. We strongly advise you to contact a certified investment advisor and we encourage you to do your own research before making any investment decision.
Recommended Content
Editors’ Picks
EUR/USD trades with negative bias, holds above 1.0700 as traders await US PCE Price Index

EUR/USD edges lower during the Asian session on Friday and moves away from a two-week high, around the 1.0740 area touched the previous day. Spot prices trade around the 1.0725-1.0720 region and remain at the mercy of the US Dollar price dynamics ahead of the crucial US data.
USD/JPY jumps above 156.00 on BoJ's steady policy

USD/JPY has come under intense buying pressure, surging past 156.00 after the Bank of Japan kept the key rate unchanged but tweaked its policy statement. The BoJ maintained its fiscal year 2024 and 2025 core inflation forecasts, disappointing the Japanese Yen buyers.
Gold price flatlines as traders look to US PCE Price Index for some meaningful impetus

Gold price lacks any firm intraday direction and is influenced by a combination of diverging forces. The weaker US GDP print and a rise in US inflation benefit the metal amid subdued USD demand. Hawkish Fed expectations cap the upside as traders await the release of the US PCE Price Index.
Sei Price Prediction: SEI is in the zone of interest after a 10% leap

Sei price has been in recovery mode for almost ten days now, following a fall of almost 65% beginning in mid-March. While the SEI bulls continue to show strength, the uptrend could prove premature as massive bearish sentiment hovers above the altcoin’s price.
US economy: Slower growth with stronger inflation

The US Dollar strengthened, and stocks fell after statistical data from the US. The focus was on the preliminary estimate of GDP for the first quarter. Annualised quarterly growth came in at just 1.6%, down from the 2.5% and 3.4% previously forecast.