Earlier today, the European Central Bank cut interest rates to a record-low 0.05% from 0.15%, surprising most market participants. As a result, EUR/USD dropped to a 14-month low, declining below the strong support zone. Are there any important levels that could stop currency bears’ charge?
In our opinion, the following forex trading positions are justified - summary:
EUR/USD: none
GBP/USD: none
USD/JPY: none
USD/CAD: none
USD/CHF: none
AUD/USD: none
EUR/USD
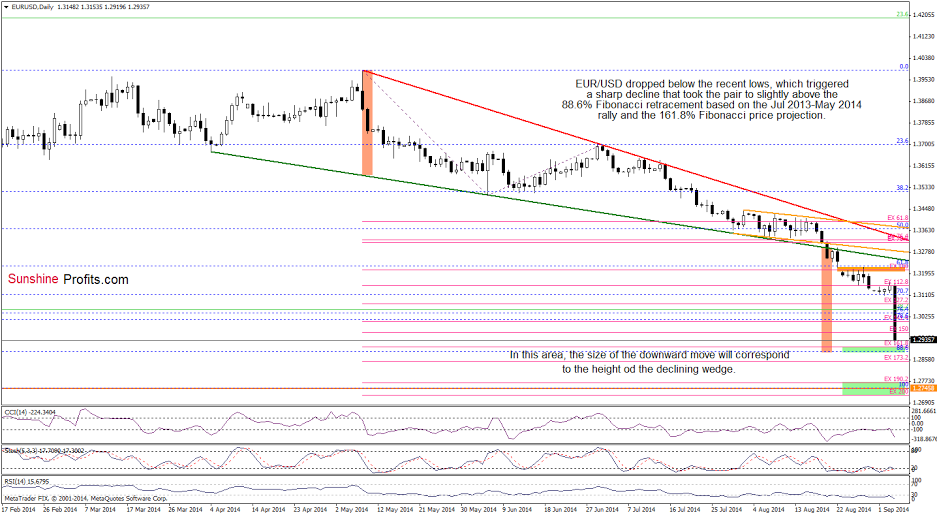
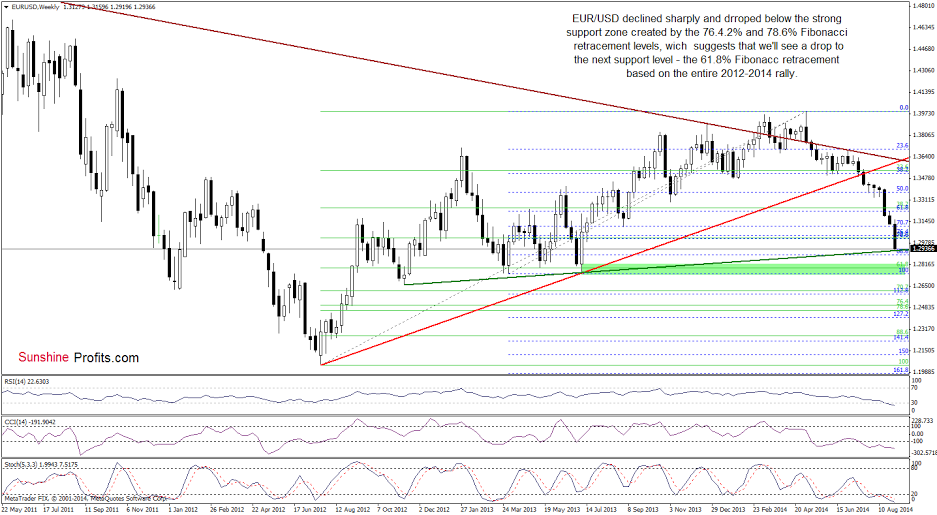
The medium-term picture has deteriorated significantly as EUR/USD accelerated declines after a drop below the recent lows and the 70.7% Fibonacci retracement level. With this downward move, the pair reached the 88.6% Fibonacci retracement, which is currently reinforced by the long-term green support line based on the Nov 2012 and Jul 2013 lows. We think that this strong support area should at least paused further deterioration in the nearest future and triggered a corrective upswing. Why this scenario is quite likely at the moment? Let’s take a closer look at the daily chart and find out.
From this perspective, we see that EUR/USD declined not only to the support levels that we discussed earlier, but also approached the 161.8% Fibonacci price projection. On top of that, in this area, the size of the downswing corresponds to the height of the declining wedge, which may reduce the selling pressure in the near future. Therefore, if this support zone holds, we may see a corrective upswing to at least the recent highs around 1.3145-1.3160. Please note that despite all these positive technical factors, we should keep in mind that there are no buy signals, which could support currency bulls.
Very short-term outlook: mixed
Short-term outlook: mixed
MT outlook: mixed
LT outlook: bearish
Trading position (short-term): In our opinion no positions are justified from the risk/reward perspective at the moment.
GBP/USD
In our last commentary on this currency pair we wrote:
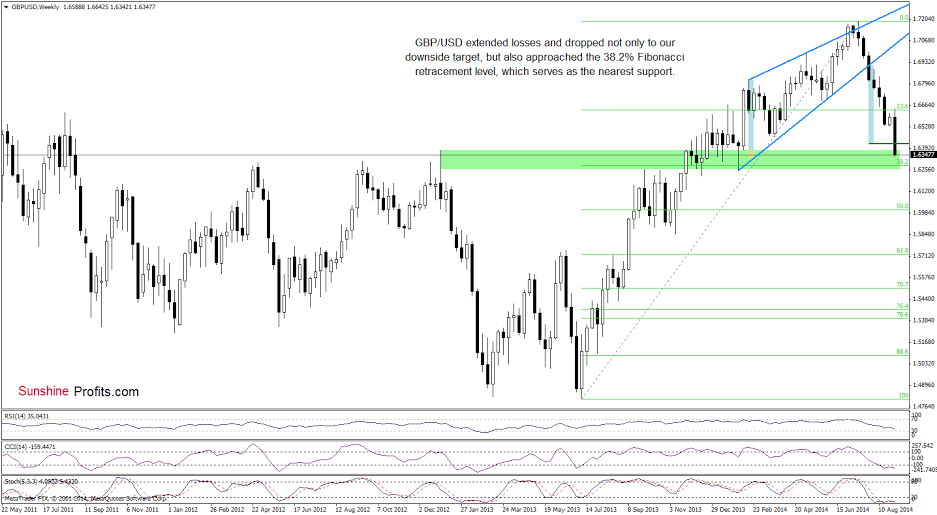
(…) Taking into account the fact that there are no buy signals, which could bode well and precede a pause or an upswing, we think that currency bears will try to reach to around 1.6419, where the size of the downswing will correspond to the height of the rising wedge (marked with blue).
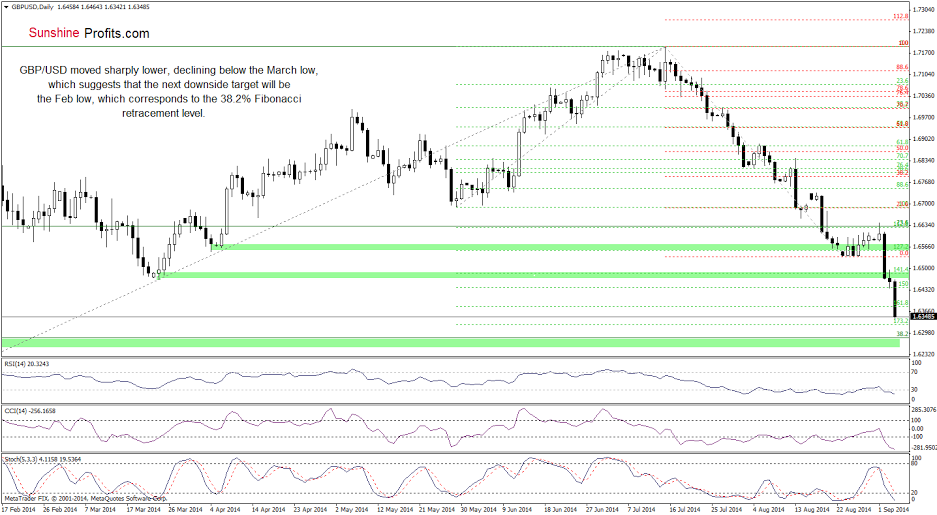
As you see on the above chart, the situation not only developed in line with the above-mentioned scenario, but currency bears managed to push the pair even lower. Such drop suggests that GBP/USD will likely move lower and reach the 38.2% Fibonacci retracement in the coming week.
Are there any short-term supports that could hinder the realization of the above-mentioned scenario? Let’s check.
Looking at the above chart, we see that GBP/USD declined below the middle green zone created by the March low and the 141.4% Fibonacci extension. This bearish signal triggered further deterioration and a drop below the 161.8% Fibonacci extension. Taking this fact into account and combining it with the current position of the indicators (although the RSI, CCI and Stochastic Oscillator are oversold, sell signals remain in place), we think that currency bears will realize their medium-term scenario in the coming days.
Very short-term outlook: bearish
Short-term outlook: mixed with bearish bias
MT outlook: bearish
LT outlook: mixed
Trading position (short-term): In our opinion no positions are justified from the risk/reward perspective at the moment.
USD/JPY
On Tuesday, we wrote the following:
(…) we may see further improvement and the next upside target will be the Dec high of 105.42. Nevertheless, we should keep an eye on the indicators because they suggest that correction is just around the corner.
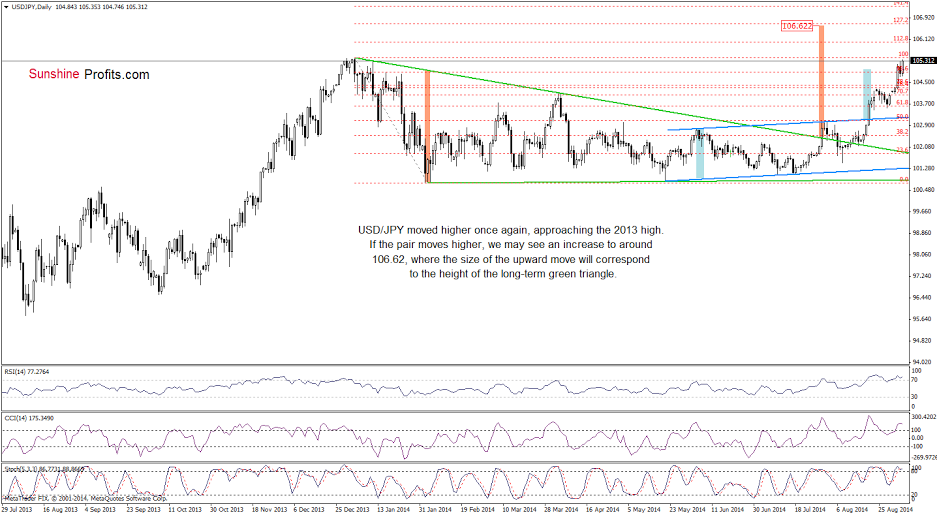
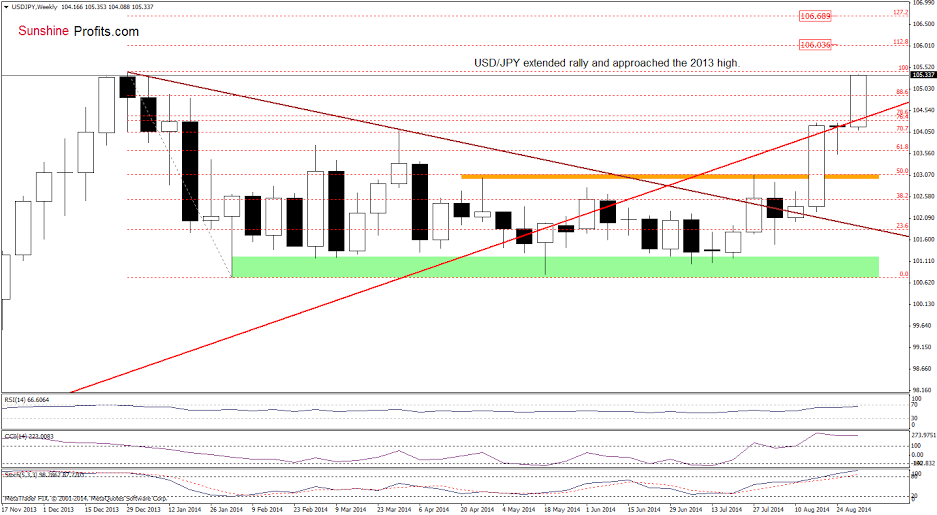
On the above chart, we see that although indicators reached their highest levels since the beginning of the year, USD/JPY moved higher as we expected. What’s next? If the pair breaks above the Nov high, we’ll see an increase to 106 (the 112.8% Fibonacci extension) or even to 106.68. Why the exchange rate could go so high? Let’s examine the daily chart and find out.
From this perspective, we can see more clearly the long-term green triangle. At the end of July there was a small breakout above the upper line of the formation, which was invalidated in the following days. Despite this bearish signal, currency bulls managed to push the exchange rate higher and USD/JPY came back above its major resistance line. In August, the pair broke above the upper border of the rising trend channel, which resulted in an increase to the current levels. As you see on the above chart, if the exchange rate breaks above the 2014 high, we may see an increase to around 106.62, where the size of the rally will correspond to the height of the long-term formation. Please keep in mind that the RSI still remains above the level of 70, while the CCI and Stochastic Oscillator are oversold (additionally there is a clearly visible divergence between the CCI and the exchange rate), which prescribe caution. Nevertheless, as long as there are no sell signals, another move higher is likely.
Very short-term outlook: mixed with bullish bias
Short-term outlook: mixed
MT outlook: mixed
LT outlook: bearish
Trading position (short-term): In our opinion no positions are justified from the risk/reward perspective at the moment.
All essays, research and information found above represent analyses and opinions of Przemyslaw Radomski, CFA and Sunshine Profits' employees and associates only. As such, it may prove wrong and be a subject to change without notice. Opinions and analyses were based on data available to authors of respective essays at the time of writing. Although the information provided above is based on careful research and sources that are believed to be accurate, Przemyslaw Radomski, CFA and his associates do not guarantee the accuracy or thoroughness of the data or information reported. The opinions published above are neither an offer nor a recommendation to purchase or sell any securities. Mr. Radomski is not a Registered Securities Advisor. By reading Przemyslaw Radomski's, CFA reports you fully agree that he will not be held responsible or liable for any decisions you make regarding any information provided in these reports. Investing, trading and speculation in any financial markets may involve high risk of loss. Przemyslaw Radomski, CFA, Sunshine Profits' employees and affiliates as well as members of their families may have a short or long position in any securities, including those mentioned in any of the reports or essays, and may make additional purchases and/or sales of those securities without notice.
Recommended Content
Editors’ Picks
EUR/USD holds above 1.0700 ahead of key US data

EUR/USD trades in a tight range above 1.0700 in the early European session on Friday. The US Dollar struggles to gather strength ahead of key PCE Price Index data, the Fed's preferred gauge of inflation, and helps the pair hold its ground.
USD/JPY stays above 156.00 after BoJ Governor Ueda's comments

USD/JPY holds above 156.00 after surging above this level with the initial reaction to the Bank of Japan's decision to leave the policy settings unchanged. BoJ Governor said weak Yen was not impacting prices but added that they will watch FX developments closely.
Gold price oscillates in a range as the focus remains glued to the US PCE Price Index

Gold price struggles to attract any meaningful buyers amid the emergence of fresh USD buying. Bets that the Fed will keep rates higher for longer amid sticky inflation help revive the USD demand.
Sei Price Prediction: SEI is in the zone of interest after a 10% leap

Sei price has been in recovery mode for almost ten days now, following a fall of almost 65% beginning in mid-March. While the SEI bulls continue to show strength, the uptrend could prove premature as massive bearish sentiment hovers above the altcoin’s price.
US core PCE inflation set to signal firm price pressures as markets delay Federal Reserve rate cut bets

The core PCE Price Index, which excludes volatile food and energy prices, is seen as the more influential measure of inflation in terms of Fed positioning. The index is forecast to rise 0.3% on a monthly basis in March, matching February’s increase.
