![]() Richard Perry
Richard Perry
Independent Analyst
Market Overview
The US dollar remains under pressure as the Dollar Index (the dollar measured against a basket of currencies) fell below 92.6 which is now the lowest since January 2015. Economic data continues to come in weaker than expected for the US and will make it increasingly hard for the Federal Reserve (which is now seemingly ready to focus on domestic factor once more) to hike at the next meeting in June. The ISM Manufacturing has been the latest data point to disappoint yesterday, missing expectations and falling back to 50.8 (a level which again reflects meagre growth in the US). The dollar weakness seen over the past few trading sessions has meant that some key breakouts on some major charts are looking to be confirmed. Trading in early can be impacted by weaker volumes (due to the May Day holidays) but the move has been decisive.
Overnight, markets have also had to digest a disappointment in the Caixin Chinese Manufacturing PMI which dropped back to 49.4 (49.9 exp) but that does not seem to have dampened sentiment. The Asian markets have also been reacting to a 25 basis point interest rate cut by the Reserve Bank of Australia which has hit the Aussie dollar but bolstered equities. Wall Street closed higher by +0.8% and this also helped to support Asian markets, although Japan was closed for Constitution Day public holiday. European equities are trading with a positive bias in early moves.
In forex markets the broad dollar weakness continues, with breakouts from the euro and sterling continuing, as is the yen strength. The Aussie is the main underperformer which is 1% weaker against the dollar, which seems to have dragged also on the Kiwi. Gold and silver have also found an element of support after a disappointing end to trading yesterday, whilst the oil price is around a percent higher.
Traders will be watching out for UK Manufacturing PMI today at 0930BST which is expected to improve slightly to 51.2 (from 51.0 last month). Later on there is also the API oil report from the US (at 2130BST) and New Zealand unemployment at 2345BST which is expected to increase slightly to 5.5% (from 5.3%).
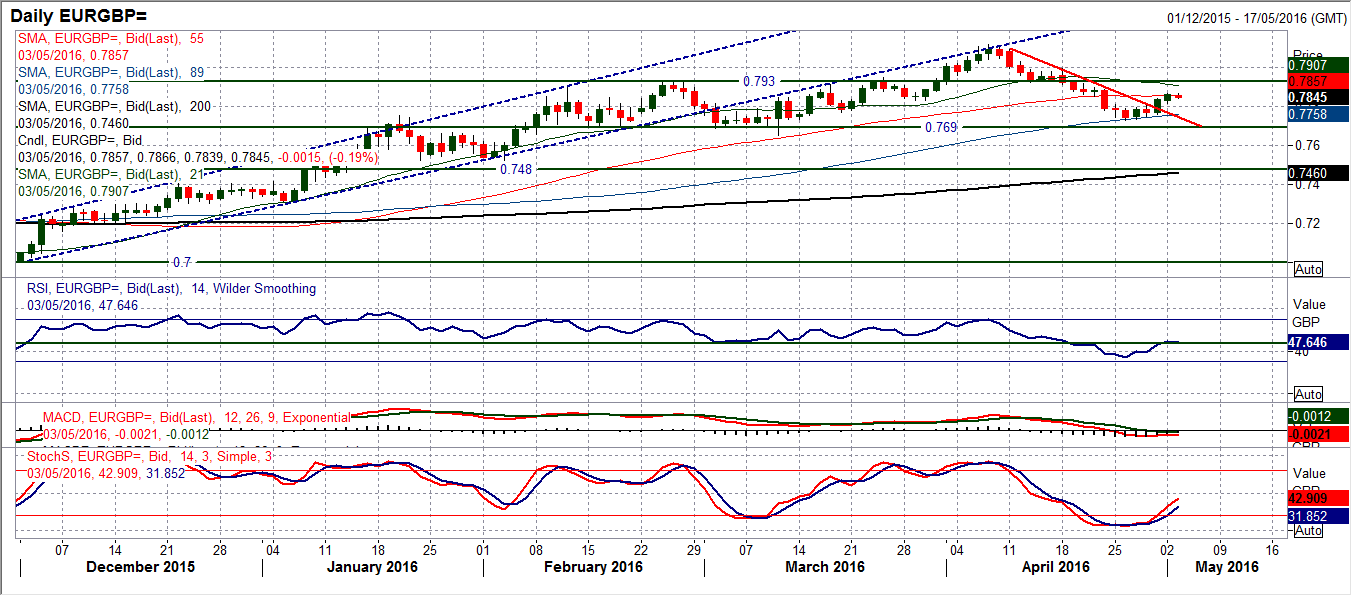
Chart of the Day – EUR/GBP
The correction on sterling over the past few weeks may have come to an end as the downtrend intact since the price topped out at £0.8117 in early April has been broken. The strong bull candle on Friday broke the trend, a move that has been confirmed by the RSI. However, we now also have the other momentum indicators improving as the Stochastics have formed a buy signal which has also been confirmed, whilst the MACD lines are also bottoming out again. Yesterday’s candle was again positive, although on lower volume due to the May Day bank holiday, so this makes today’s candle even more important for the next direction. The hourly chart shows the improvement pushed through the resistance at £0.7850, however the more important level to breach would be at £0.7900 which would then open upside towards £0.7993. The hourly MACD lines are the most positively configured since the market topped out over three weeks ago. The support band £0.7800/£0.7820 is key today and if the bulls can maintain this level and build the support then confidence for a recovery will build.
EUR/USD
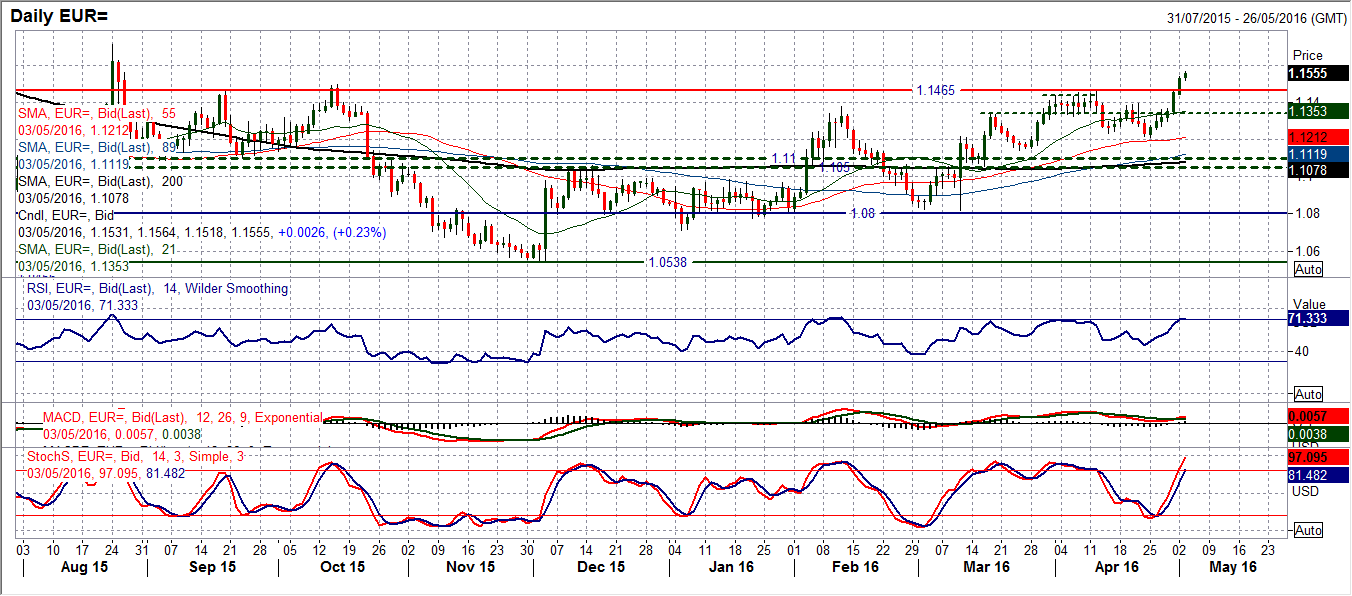
With a run of six consecutive bullish candles, the last two of which have added over 200 pips, the euro has burst through the top of the long term resistance at $1.1465. Interestingly, very little regard seemed to be given to a resistance level that has consistently been the key turning point over the past 16 months. Perhaps the small volume could be a minor caveat (smallest level since Easter) but the move has been seen. It does though now need to have a confirmation move today, and the early gains seem to be doing just that. Once before (in August 2015) we saw a similar run of strong bullish candles spiking to $1.1711 before an equally sharp retracement, but this is the only previous time since January 2015 that the euro has traded up in these heady levels. The momentum is strong but the RSI is now around 70 again (a level which has also previously resulted in a correction). For now the hourly chart still looks well set up to hold on to these gains. The old breakout at $1.1465 now becomes the basis of support and needs to be held for at least today to help suggest the bulls are accepting the breakout. An interesting crossroads in the outlook for the euro, can it complete the breakout?
GBP/USD
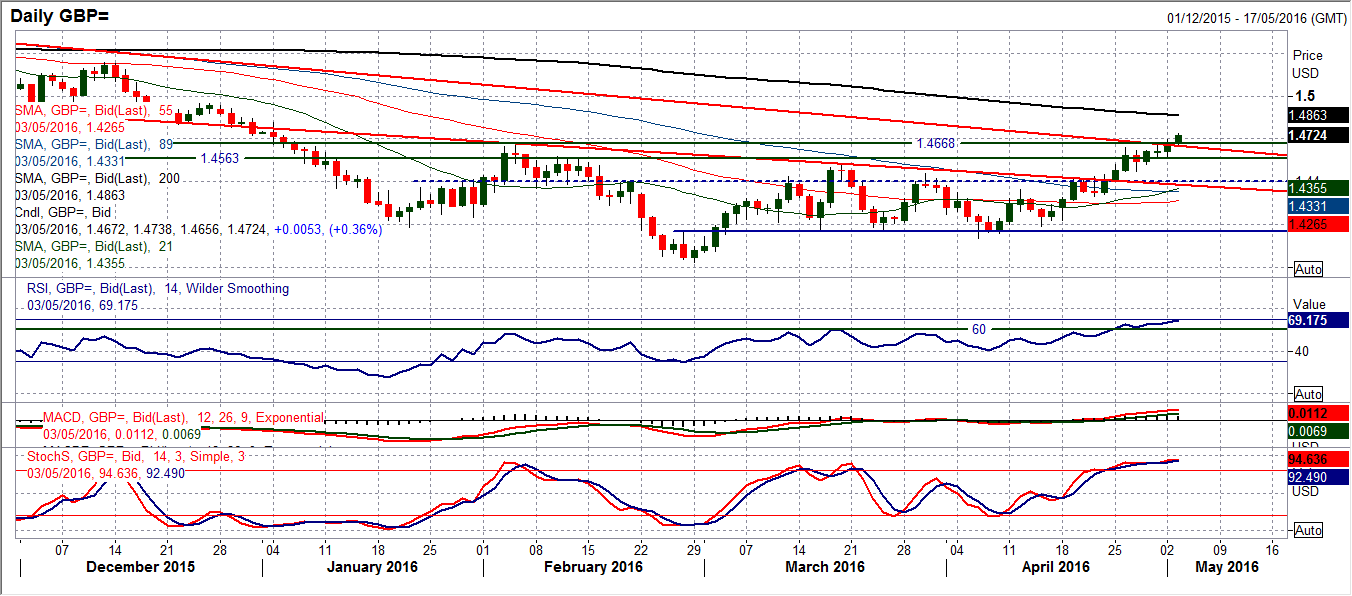
Sterling continues to strengthen against the dollar and put pressure on the key overhead resistance around $1.4670 which was the February high. The consistent pressure also means that the old downtrend that dates back to August 2015 also continues to be under pressure. After a bit of a consolidation candle on Friday, the Cable bulls have put together another solidly positive candle in which the intraday resistance was breached only to interestingly dip back to close around $1.4670 again. This makes today’s candle very important, however, the early push higher again today seems to suggest the bulls are making their move. Momentum is increasingly strong on a medium term basis with the RSI firmly holding above 60 and the MACD and Stochastics lines also bullishly configured. The hourly chart shows a series of higher lows which have also tended to use the support of old breakouts for the basis of the next push higher. Subsequently $1.4470 and $1.4575 are now key support areas near term. A strong close above $1.4670 opens upside towards the next resistance band $1.4800/$1.4950.
USD/JPY
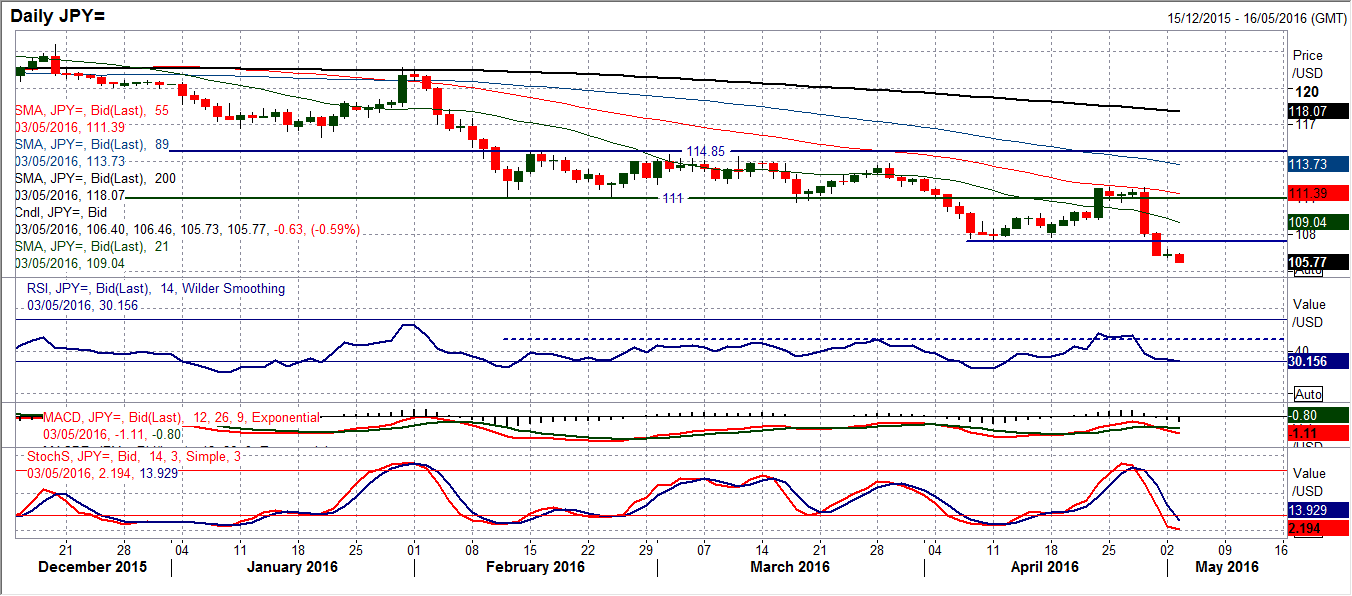
The weakness of the Dollar/Yen chart remains significant. Although the bulls somehow managed to scrape together around 5 pips of gains on the day for a marginally positive candle, the lowest traded volume for over a month (since Easter, seemingly due to the UK bank holiday) means that perhaps it is only delaying the continuation of the sell-off which has resumed in Asian trading overnight. The momentum indicators on the daily chart are still very bearish and also have further downside potential with the RSI only just hitting 30 (the recent early April sell-off had the RSI below 30 for a week), the MACD lines just crossing lower again and the Stochastics only just entering into really bearish configuration. Technical downside targets have mostly already been met, however the bearish outlook to the long term head and shoulders top pattern implies 105.20, which also happens to be the key support from October 2014, so this seems to be the next are the sellers are looking at. The hourly chart shows that any rallies are being treated as another chance to sell with yesterday’s high at 106.80 and bears seeing the hourly RSI up around 50/60 as a trigger signal. Key resistance does not come in until 107.60.
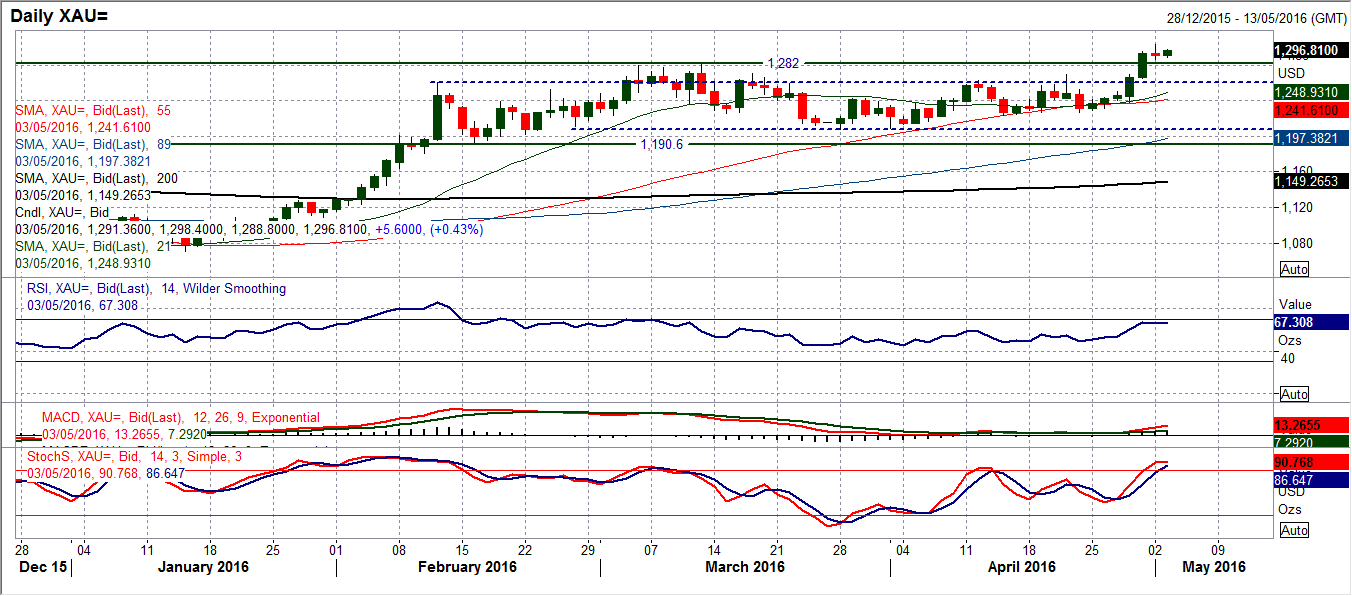
Gold
Several markets that have been a play on dollar weakness have been breaking through key levels in the past few days and gold is another that has benefitted strongly. The run of five bulls candles that had been accelerating higher broke out through the key resistance at $1282.50 on Friday. However yesterday’s candle has thrown up a few caveats. The run hit a high at $1303.60 (which was just under the key January 2015 high at $1306, but then fell back to close marginally lower on the day. This has left us with a slightly corrective candle (that is bordering on being a bit of a shooting star), which makes today’s candle very important. A second corrective candle that closes back below $1282.50 would suggest that the bulls had lost control (at least for the near term). However, if there can be support formed in the band $1260/$1282.50 then on a medium term basis this would be taken as a positive. This is subsequently a very interesting period for gold. The hourly chart shows the potential for a near term correction, the hourly RSI dropping below the mid-30s would be a signal for a dip. Initial support is at $1282.50 and $1270. Above $1306 opens the $1322 high from August 2014 and $1345 from July 2014.
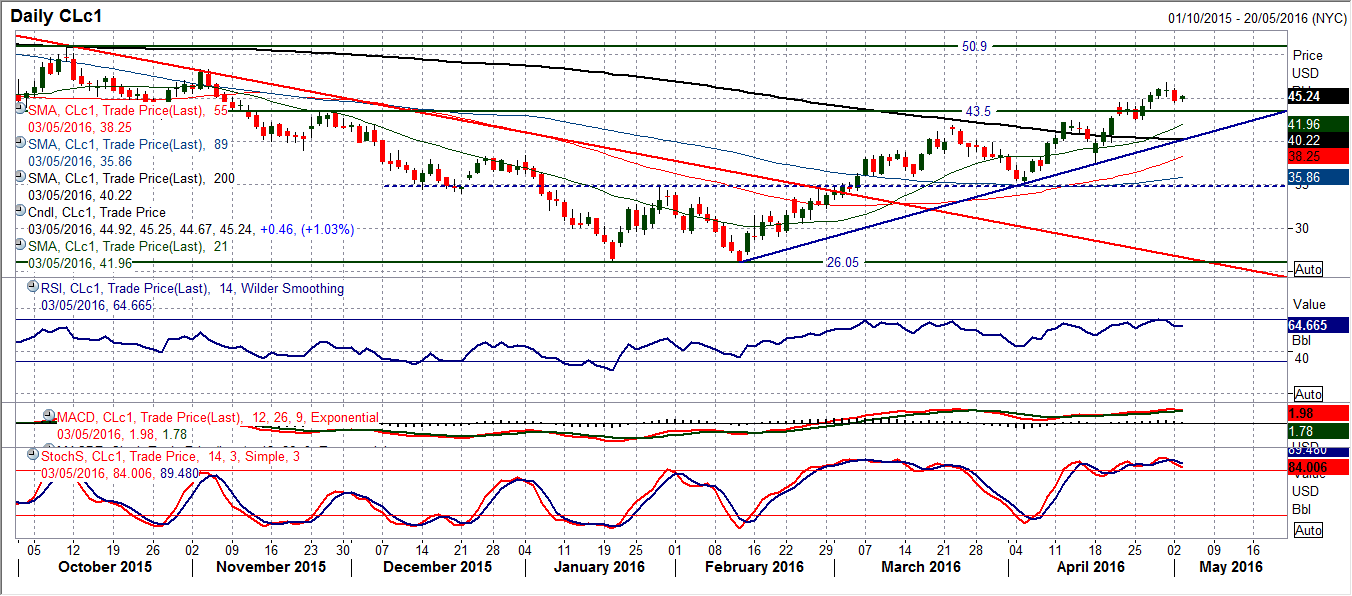
WTI Oil
After four days of gains the oil price found resistance at $46.78 just before a corrective candle started what should merely be a near term move lower yesterday. The unwinding candle comes just a day after a “doji” candle that reflected uncertainty with the recent run higher and therefore is in keeping with correction. Furthermore, this may not be so much of a surprise given that the RSI was once more up towards 70 again (hitting 69 on Friday). However, I continue to believe that near term corrections can be used as a chance to buy again. The band of support between $43.50/$44.50 is ready for the correction, whilst the bulls will remain in control as the support at $42.60 remains intact. The hourly chart shows the hourly RSI has unwound back to 30 and turned up, so the hourly momentum indicators are back to areas where the buyers have returned in the last couple of weeks. A move above $46.15 would re-engage the bull control.
Note: All information on this page is subject to change. The use of this website constitutes acceptance of our user agreement. Please read our privacy policy and legal disclaimer. Opinions expressed at FXstreet.com are those of the individual authors and do not necessarily represent the opinion of FXstreet.com or its management. Risk Disclosure: Trading foreign exchange on margin carries a high level of risk, and may not be suitable for all investors. The high degree of leverage can work against you as well as for you. Before deciding to invest in foreign exchange you should carefully consider your investment objectives, level of experience, and risk appetite. The possibility exists that you could sustain a loss of some or all of your initial investment and therefore you should not invest money that you cannot afford to lose. You should be aware of all the risks associated with foreign exchange trading, and seek advice from an independent financial advisor if you have any doubts.
Recommended Content
Editors’ Picks
EUR/USD holds above 1.0700 ahead of key US data

EUR/USD trades in a tight range above 1.0700 in the early European session on Friday. The US Dollar struggles to gather strength ahead of key PCE Price Index data, the Fed's preferred gauge of inflation, and helps the pair hold its ground.
USD/JPY stays above 156.00 after BoJ Governor Ueda's comments

USD/JPY holds above 156.00 after surging above this level with the initial reaction to the Bank of Japan's decision to leave the policy settings unchanged. BoJ Governor said weak Yen was not impacting prices but added that they will watch FX developments closely.
Gold price oscillates in a range as the focus remains glued to the US PCE Price Index

Gold price struggles to attract any meaningful buyers amid the emergence of fresh USD buying. Bets that the Fed will keep rates higher for longer amid sticky inflation help revive the USD demand.
Sei Price Prediction: SEI is in the zone of interest after a 10% leap

Sei price has been in recovery mode for almost ten days now, following a fall of almost 65% beginning in mid-March. While the SEI bulls continue to show strength, the uptrend could prove premature as massive bearish sentiment hovers above the altcoin’s price.
US core PCE inflation set to signal firm price pressures as markets delay Federal Reserve rate cut bets

The core PCE Price Index, which excludes volatile food and energy prices, is seen as the more influential measure of inflation in terms of Fed positioning. The index is forecast to rise 0.3% on a monthly basis in March, matching February’s increase.