Market Overview
The euro was boosted yesterday afternoon as news began to filter through that the talks between Greece and the Eurozone were working through the proposals, although deal may not be done by Friday’s Eurogroup meeting. At least some progress is being made. This resulted in a reversal of the earlier dollar strength. Equity markets seem to be moving almost on individual earnings stories in the US and as a result there was very little overall direction, with the S&P500 down 0.2%. Asian markets were reasonably positive overnight, with the Nikkei 225 up 1.0% after Japan posted a trade surplus showing that the weaker yen is helping the country’s exporters. European markets are mixed to slightly stronger in the early moves today.
Forex trading shows the dollar coming under a little further pressure again today after yesterday’s fluctuations. The main mover is the Aussie dollar which has strengthened by almost a percent in the wake of Australian inflation data which came in line with expectations on the month and showed a 1.3% change on the year. Gold and silver are showing little signs of any real move, whilst oil prices have started to fall back after the announcement that Saudi Arabia had ended its campaign of air strikes on Yemen.
Traders will be watching out for the Bank of England meeting minutes today at 0930BST. The expectation is for another unanimous decision to keep rates steady, but interest will come in any signs of potentially hawkish moves on the committee. The Eurozone consumer confidence is at 1500BST and is expected to improve very slightly to -3 from -4. Also at 1500BST is the US existing home sales, which are expected to improve to 5.04m (from 4.88m last month). Dollar bulls will hope that the housing data can show signs of an improvement after disappointing building permits and housing starts last week.
Chart of the Day – EUR/JPY
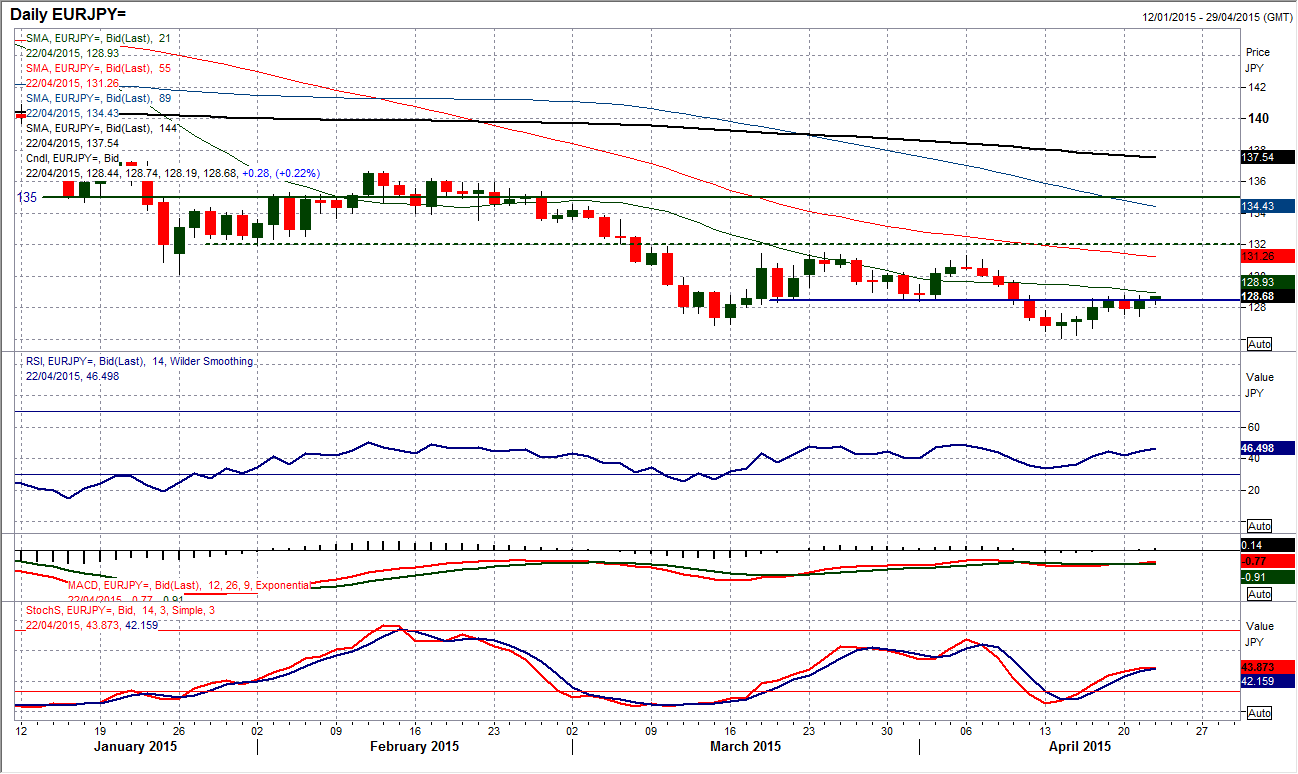
The chart of Euro/Yen shows the battle between two central banks engaged in huge monetary stimulus and is in effect a great illustration of the concept of risk appetite. The yen is winning this battle. The sequence of lower highs and lower lows continues on the daily chart, with the daily momentum indicators in consistent bearish configuration. The 21 day moving average (at 128.90) has consistently (although not perfectly) been a basis of resistance in recent months and once more the rebound of the past week and a half is finding resistance around it again. The resistance of the old early April low around 128.40 seems to also be playing a role. In fact, the hourly chart shows there to be around 60 pips of historic resistance between 128.40/129.00 which is capping the recent rally. With the hourly RSI failing to push above 70 the bulls have never really been able to grasp the momentum in this rebound. That makes the support of the reaction low at 127.40 now increasingly important. A breach of the support would seriously test the ability of the bulls to hold on to this move and also re-open the support at 126.70 and 126.25. Above resistance at 129.00 would be needed to re-engage the bulls.
EUR/USD
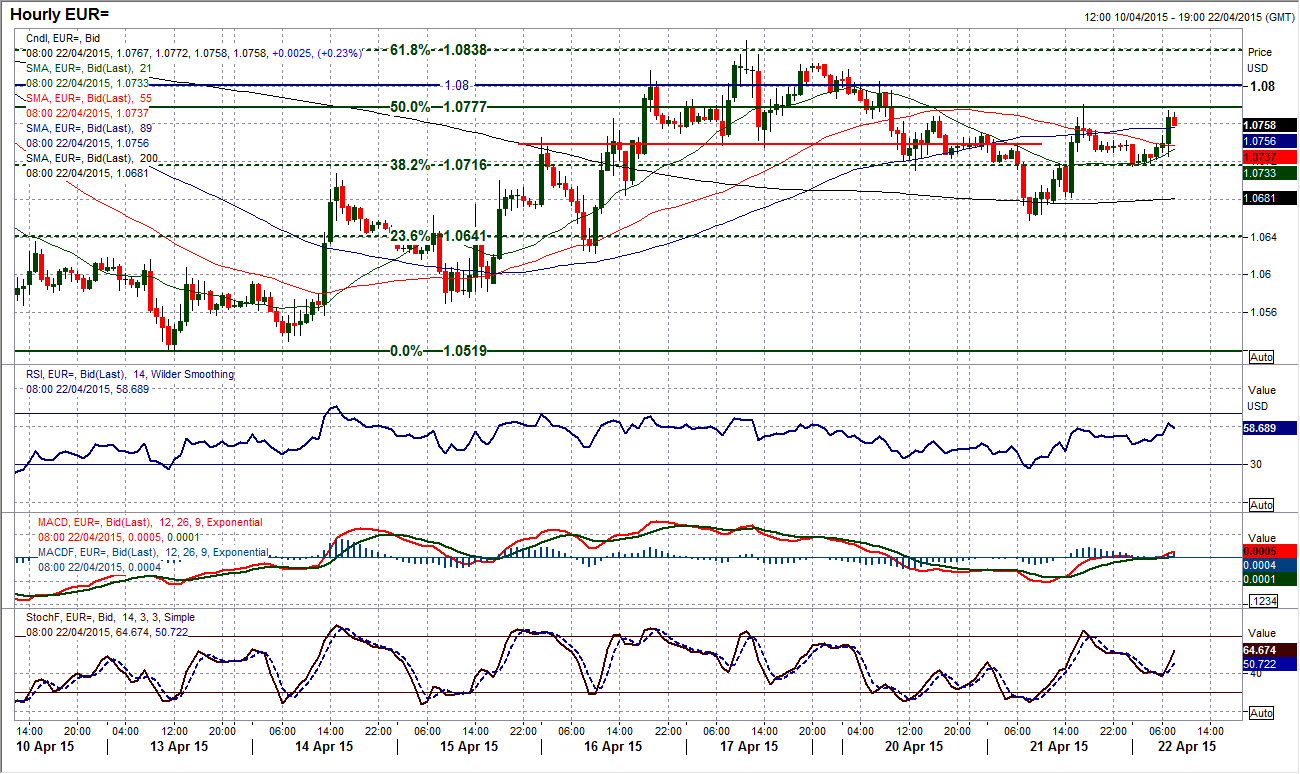
Judging by the uncertainty of the situation regarding Greece’s bailout proposals, it is probably fair enough that the euro finished yesterday’s session with almost no change on the day and a “doji” candlestick (which denoted uncertainty with the prevailing trend). Technically speaking the outlook for the euro remains bearish and ultimately I see the euro retesting the recent lows $1.0520 and then $1.0456. Medium to longer term trend, moving averages and momentum indicators all suggest further downside. However for the immediate outlook, it is a little less obvious as more of a consolidation has set in in the past few days. The hourly chart still shows a head and shoulders top pattern under $1.0735 is intact which implies $1.0620. Although yesterday’s initial weakness got within 40 pips before a rally kicked in and the rally high at $1.0780 is now near term resistance, the gains seen as the European session has got underway are putting the resistance under pressure again. Technically speaking, the top remains intact whilst under the right hand shoulder high at $1.0825, but the euro bulls will be gaining in confidence if they can hold these gains. Hourly momentum indicators such as MACD and RSI have improved but not to the extent at which you would class the momentum as positive. I am still expectant that the near term top pattern will prevail but it could be a choppy one.
GBP/USD
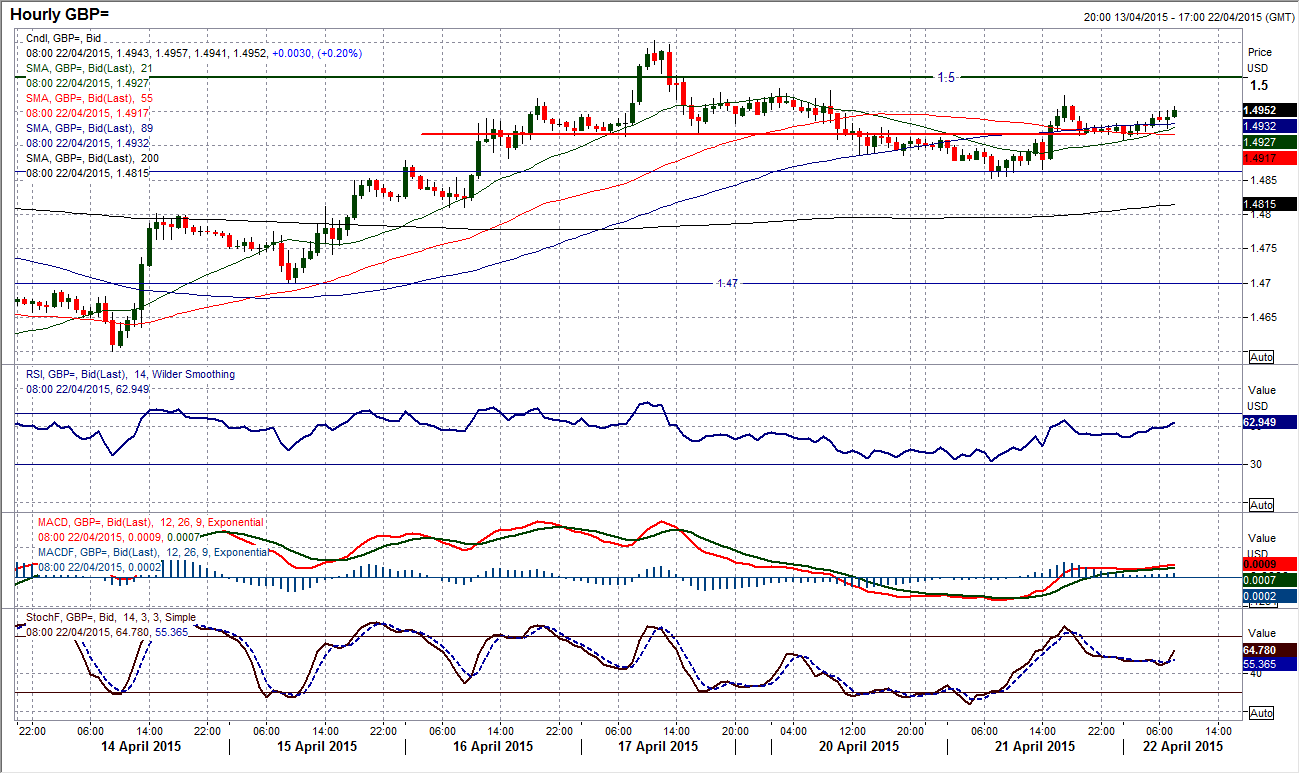
I still see sterling as a better performer than the euro and this is shown in the reaction yesterday on Cable with the daily chart showing continued pressure around the old resistance zone $1.4950/$1.5000. This trading sequence could therefore take on extra significance as if the sterling bulls are unable to make the decisive breakout this time with the constant pressure then it could be a big turning point. I thought that yesterday, with the head and shoulders top pattern that had formed that the bulls had already run out of fight but they have hung on. The small top pattern on the hourly chart is still intact but only just now, with a move above $1.4980 now would be enough to abort it. A decisive breach would then re-open the rally high at $1.5050Hourly momentum is again more positive for sterling than on the euro. The uncertainty over the near to medium term outlook continues. Yesterday’s low at $1.4853 is the key near term support now.
USD/JPY
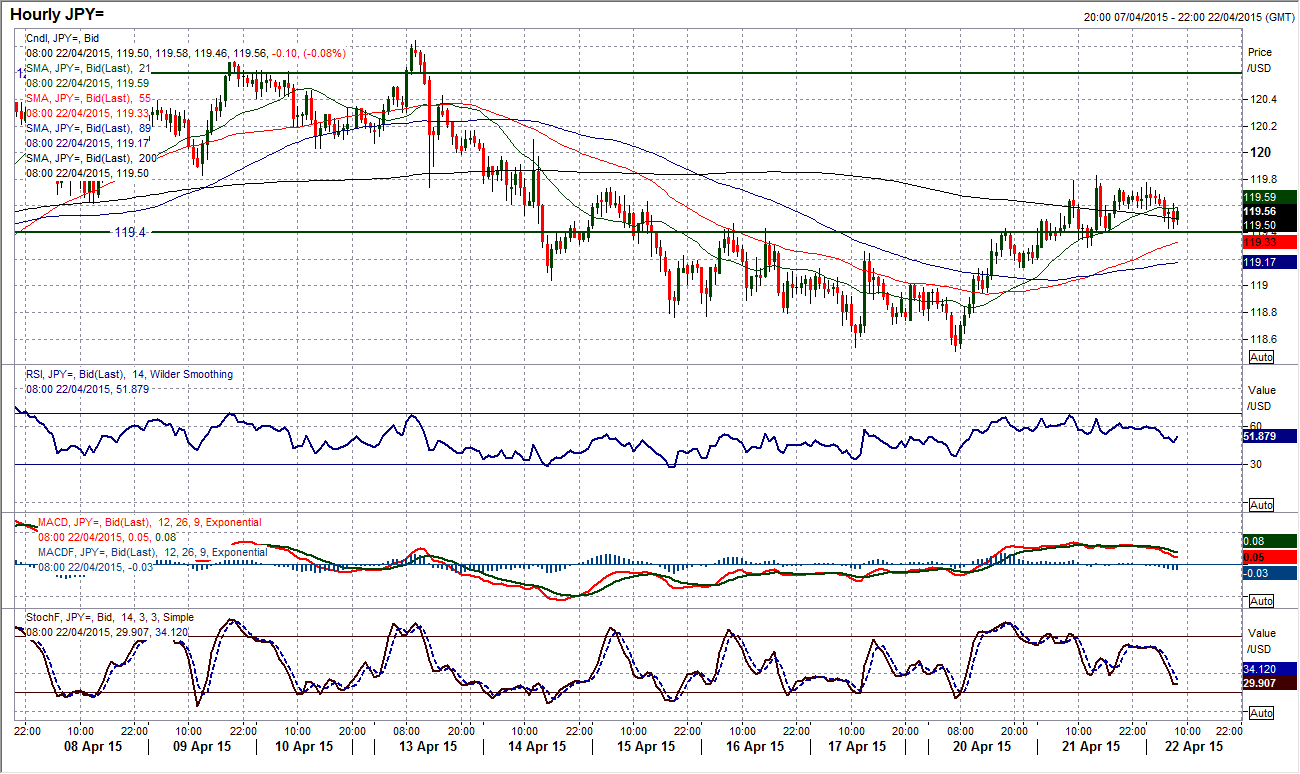
The neutral and I might add, uncertain, outlook for Dollar/Yen is a key feature of the daily chart. The sequence of six bearish candles and a decline of 230 pips is now being undone by a retracement of two bullish candles that has unwound over half of the decline already. What I am alluding to is that there is a lack of medium term direction on the pair which results in little overall decisive move. In fact, even on the daily chart you can get a gauge of the role that the 119.40 pivot level is playing. This level has come to symbolise the uncertain movement in recent weeks. Daily momentum is very neutral, with only a hint of bullish bias near term as the Stochastics are rising. The hourly chart shows the 119.40 pivot in greater detail and once again this looks to be the level to watch today. A slight bearish divergence on the hourly Stochastics are now suggesting loss of impetus (so therefore conflicting with the daily Stochastics). Support levels come in at 119.14 and 118.50. Yesterday’s high at 119.80 is immediate resistance.
Gold
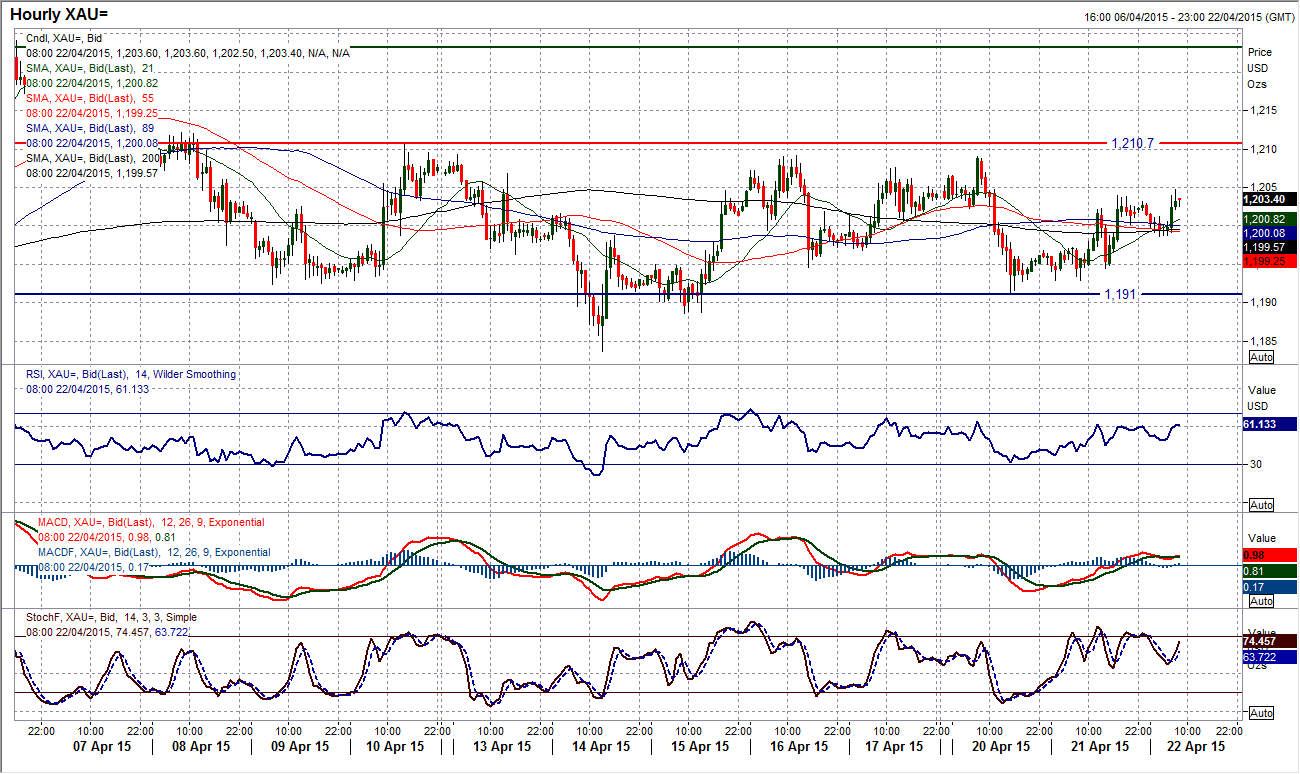
The daily chart shows the continuation of the tight range that has built up over the past couple of weeks. Finding consistent resistance under $1210.70 the support has been gradually rising, with the latest reaction low at the old low of $1191. However, gold appears to be unable to string two consistent candles together at the moment which is reflected in the neutral daily momentum and the lack of conviction. That makes it very difficult to call a breakout and the need for a more decisive signal to suggest some direction. The intraday hourly chart shows a near term improvement in momentum but until the range breaks, it is still possible to play the classic overbought/oversold signals on the hourly RSI.
WTI Oil
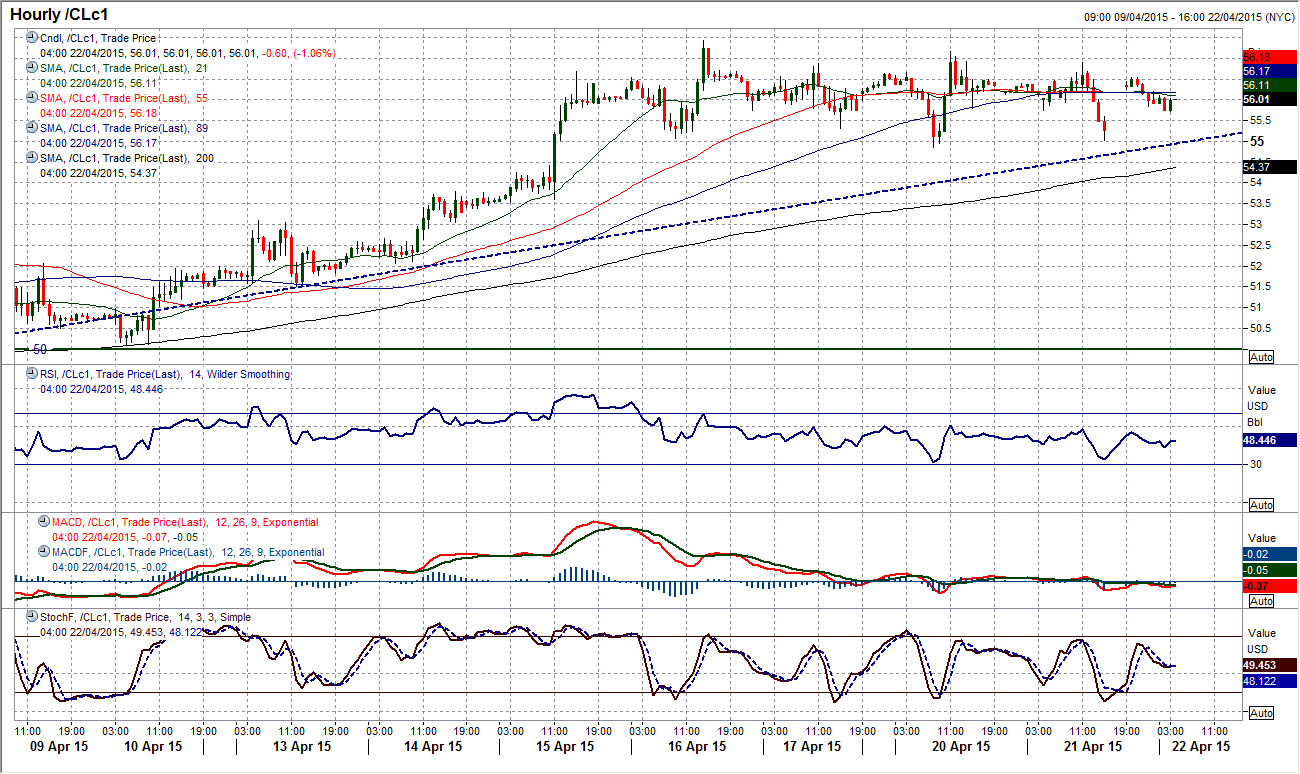
The consolidation above the key breakout of $54.24 continues. For the past few days the WTI price has not come under any selling pressure despite the rebound in the US dollar. Daily momentum indicators remain strong and suggest looking to use any correction as a chance to buy now. The hourly chart does not show a great deal more detail than we see with the daily candles which are reflective of the consolidation. The breakout old resistance at $54.24 is now the top of the immediate support band that goes down to $53.00. A close above the recent peak at $57.42 would open the upside again. The big base pattern still implies upside towards $65.00. Next resistance is at $59.00.
Note: All information on this page is subject to change. The use of this website constitutes acceptance of our user agreement. Please read our privacy policy and legal disclaimer. Opinions expressed at FXstreet.com are those of the individual authors and do not necessarily represent the opinion of FXstreet.com or its management. Risk Disclosure: Trading foreign exchange on margin carries a high level of risk, and may not be suitable for all investors. The high degree of leverage can work against you as well as for you. Before deciding to invest in foreign exchange you should carefully consider your investment objectives, level of experience, and risk appetite. The possibility exists that you could sustain a loss of some or all of your initial investment and therefore you should not invest money that you cannot afford to lose. You should be aware of all the risks associated with foreign exchange trading, and seek advice from an independent financial advisor if you have any doubts.
Recommended Content
Editors’ Picks
EUR/USD holds above 1.0700 ahead of key US data

EUR/USD trades in a tight range above 1.0700 in the early European session on Friday. The US Dollar struggles to gather strength ahead of key PCE Price Index data, the Fed's preferred gauge of inflation, and helps the pair hold its ground.
USD/JPY stays above 156.00 after BoJ Governor Ueda's comments

USD/JPY holds above 156.00 after surging above this level with the initial reaction to the Bank of Japan's decision to leave the policy settings unchanged. BoJ Governor said weak Yen was not impacting prices but added that they will watch FX developments closely.
Gold price oscillates in a range as the focus remains glued to the US PCE Price Index

Gold price struggles to attract any meaningful buyers amid the emergence of fresh USD buying. Bets that the Fed will keep rates higher for longer amid sticky inflation help revive the USD demand.
Sei Price Prediction: SEI is in the zone of interest after a 10% leap

Sei price has been in recovery mode for almost ten days now, following a fall of almost 65% beginning in mid-March. While the SEI bulls continue to show strength, the uptrend could prove premature as massive bearish sentiment hovers above the altcoin’s price.
US core PCE inflation set to signal firm price pressures as markets delay Federal Reserve rate cut bets

The core PCE Price Index, which excludes volatile food and energy prices, is seen as the more influential measure of inflation in terms of Fed positioning. The index is forecast to rise 0.3% on a monthly basis in March, matching February’s increase.
