Crude Oil - Setting Lower Highs
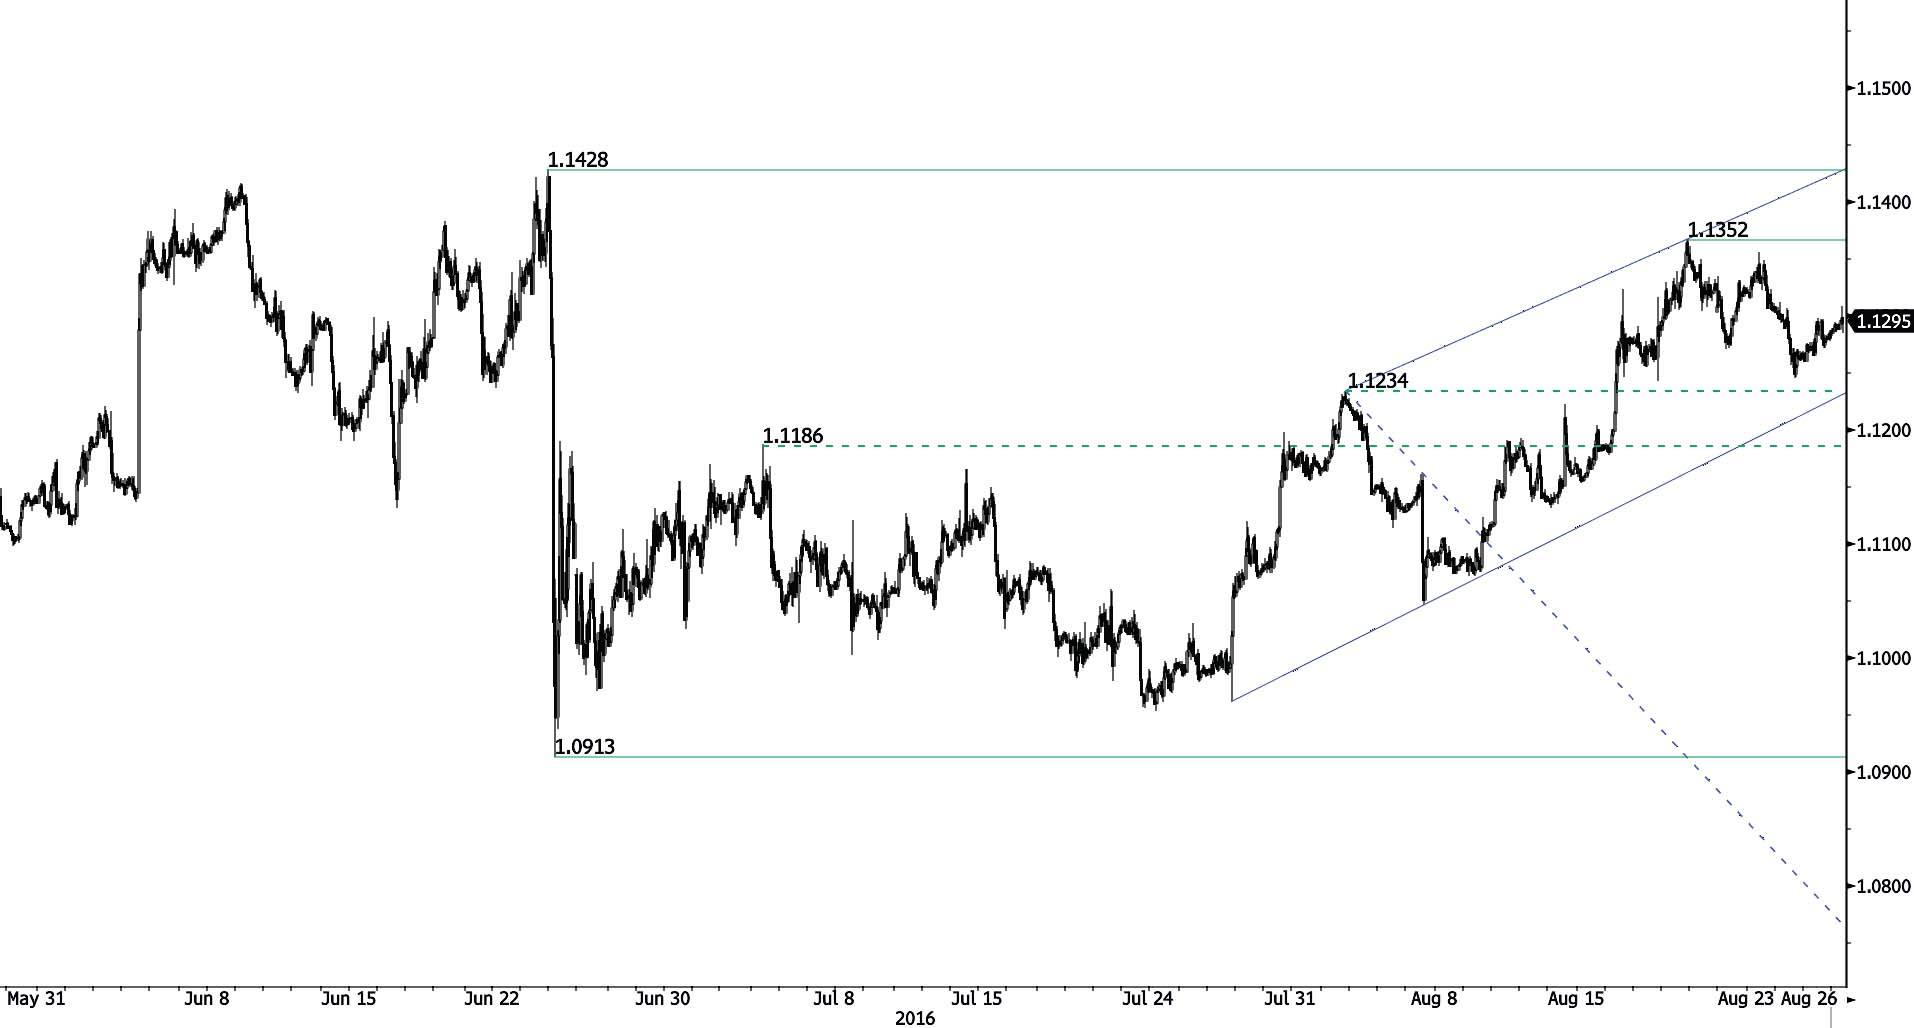
EUR/USD
Bullish momentum.
-
EUR/USD is well into a bullish momentum. Uptprend remains strong. Key resistance is given at 1.1352 (23/08/2016 high) then 1.1428 (23/06/2016 high). Hourly support can be found at 1.1245 (24/05/2016 low). Expected to increase again.
-
In the longer term, the technical structure favours a very long-term bearish bias as long as resistance at 1.1714 (24/08/2015 high) holds. The pair is trading in range since the start of 2015. Strong support is given at 1.0458 (16/03/2015 low). However, the current technical structure since last December implies a gradual increase.
GBP/USD
Slight increase.
-
GBP/USD's buying interest is growing even if the pair fails to go above former resistance implied by the top of channel. For the time being, the medium-term bearish momentum is lively. Hourly resistance can be found at 1.3372 (03/08/2016 high). Hourly support can be found at 1.3024 (19/08/2016 low).
-
The long-term technical pattern is even more negative since the Brexit vote has paved the way for further decline. Long-term support given at 1.0520 (01/03/85) represents a decent target. Long-term resistance is given at 1.5018 (24/06/2015) and would indicate a long-term reversal in the negative trend. Yet, it is very unlikely at the moment.

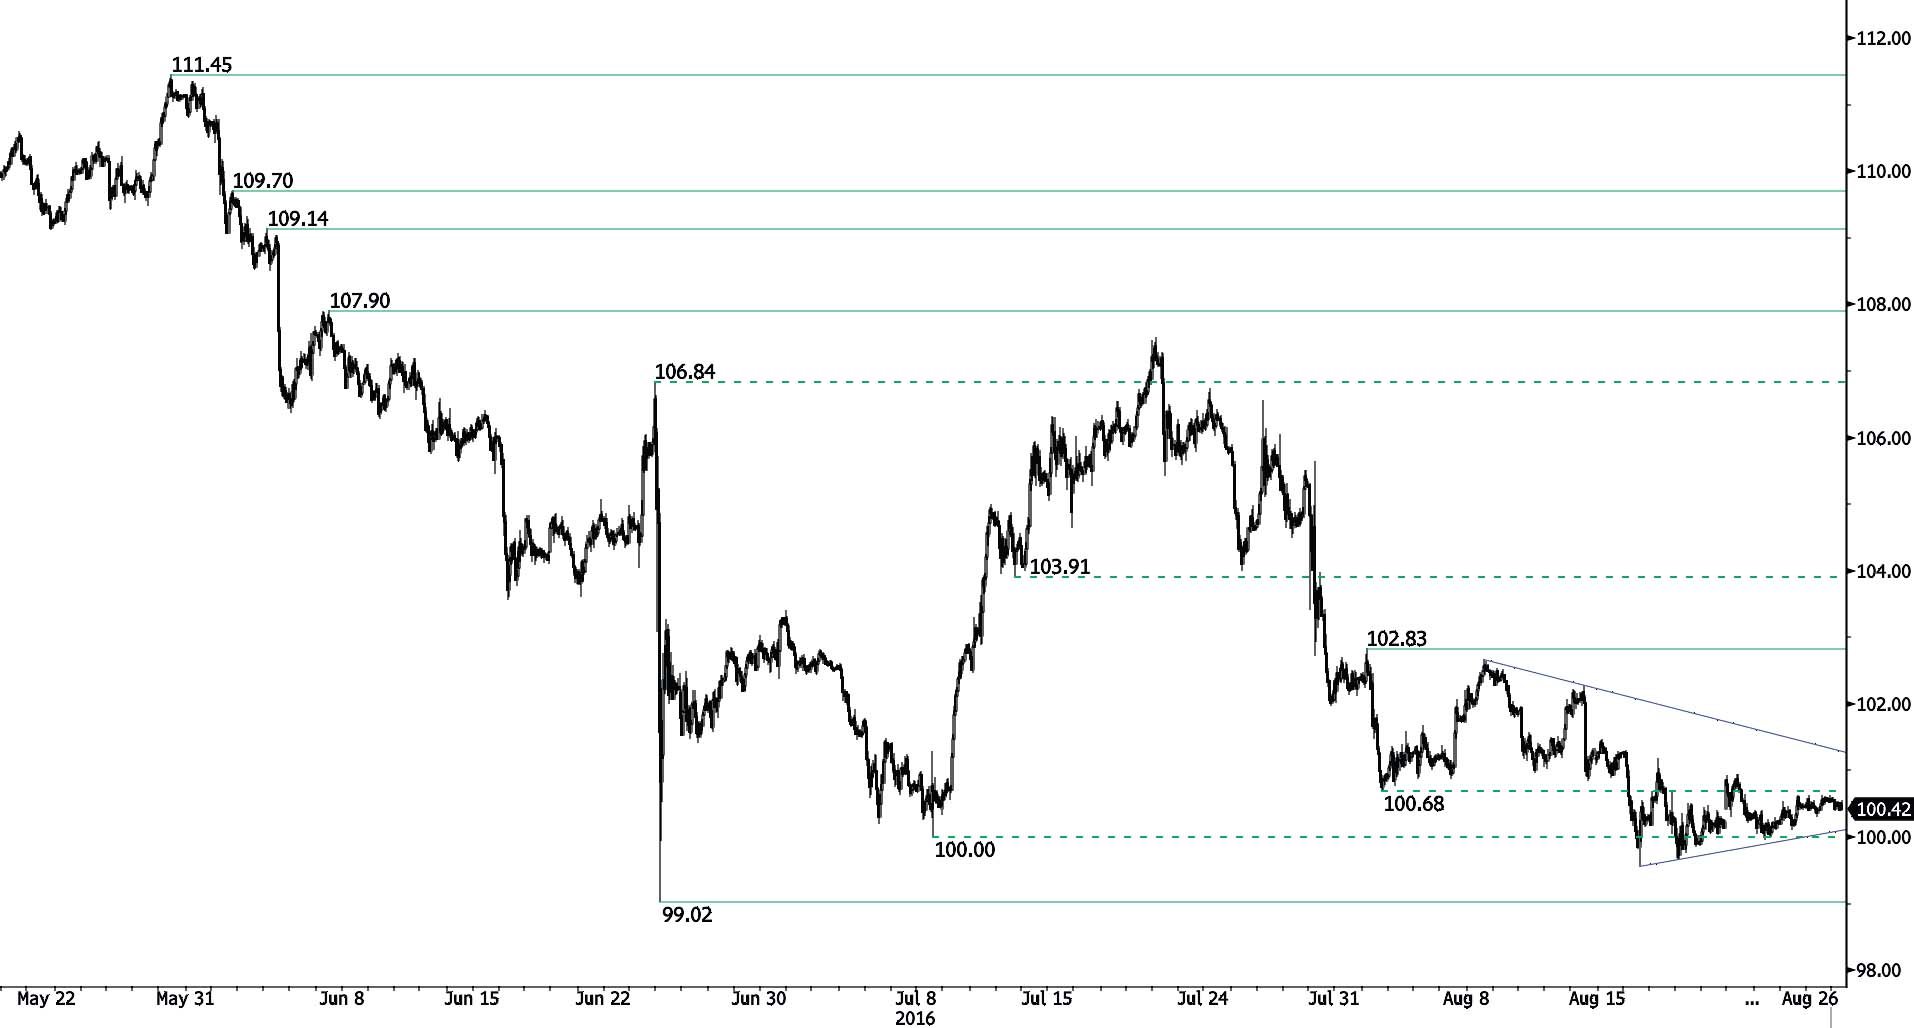
USD/JPY
Continued bullish consolidation.
-
USD/JPY is trading above the 100-mark without much volatility. The technical structure suggests that the pair is consolidating before a further head lower. Strong support is given at 99.02 (24/06/2016 low). Hourly resistance is given at 102.83 (02/08/2016 high). Selling pressures should continue.
-
We favour a long-term bearish bias. Support is now given at 96.57 (10/08/2013 low). A gradual rise towards the major resistance at 135.15 (01/02/2002 high) seems absolutely unlikely. Expected to decline further support at 93.79 (13/06/2013 low).
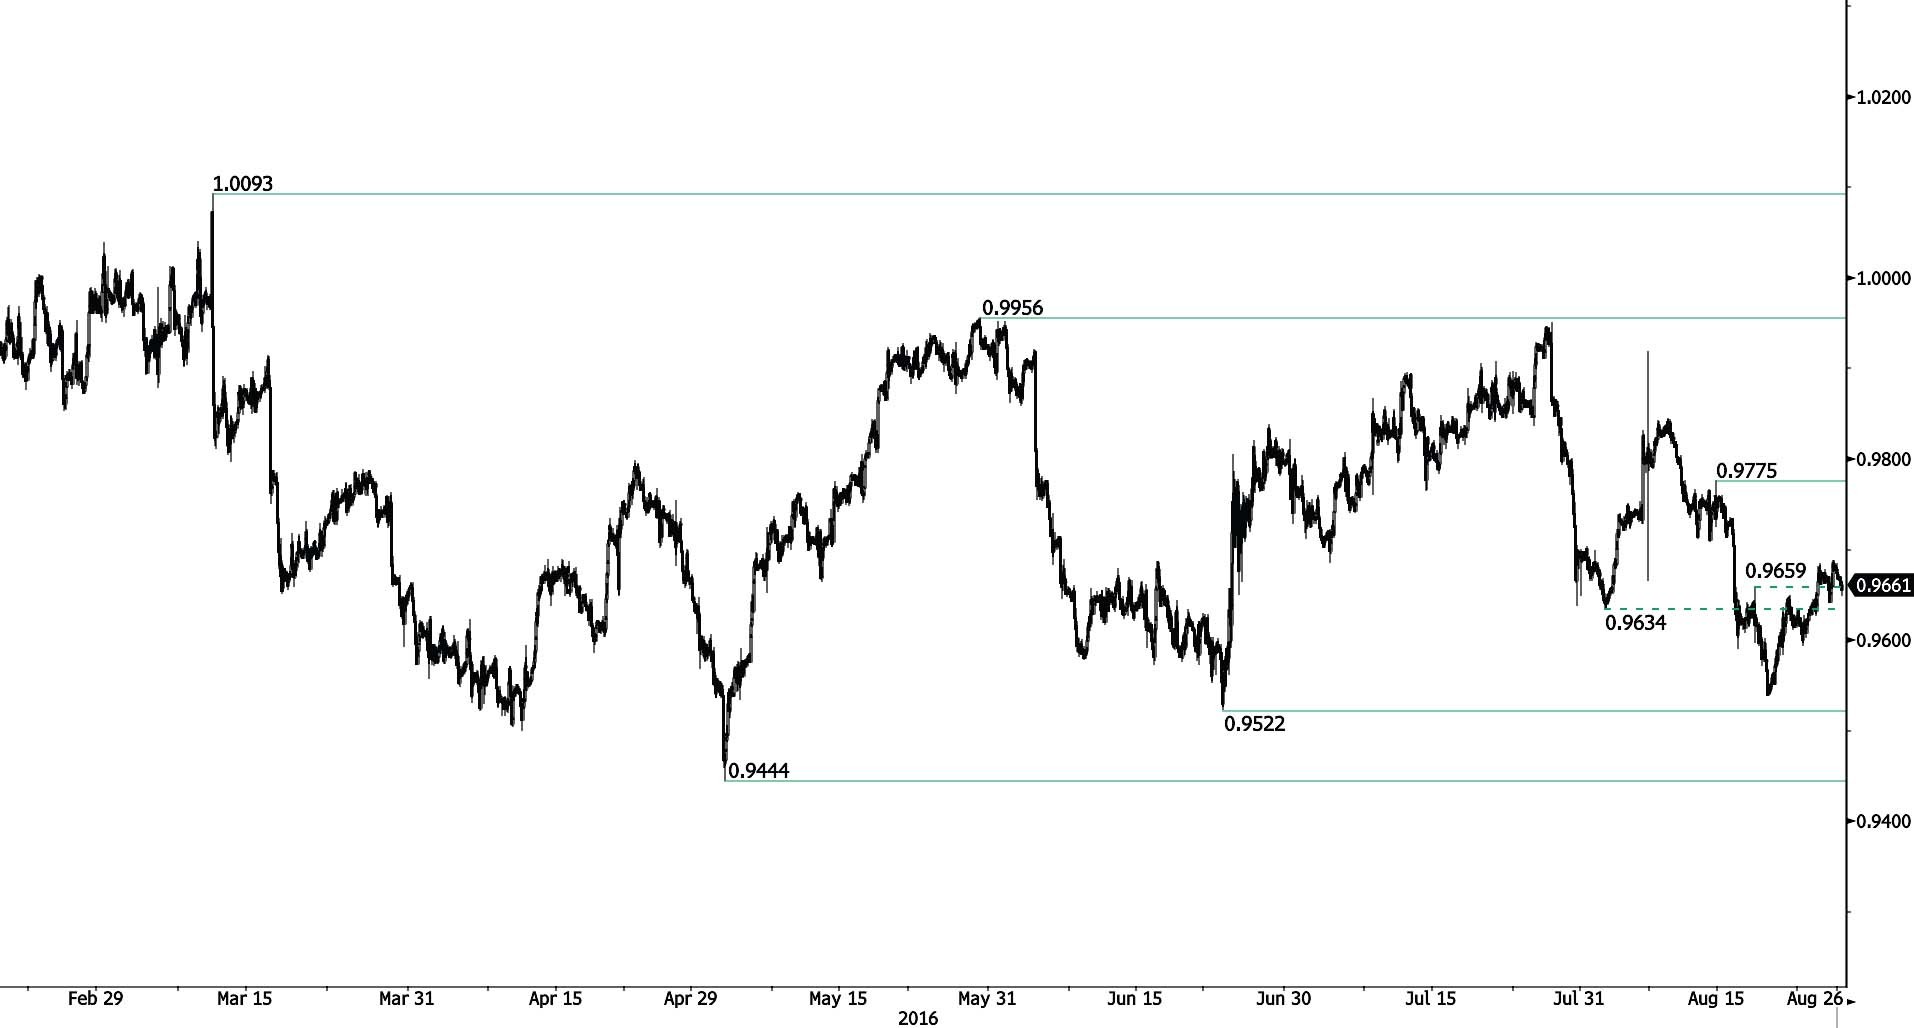
USD/CHF
Consolidating.
-
USD/CHF is trading around former resistance at 0.9659 (09/08/2016 high) after a pickup in short-term buying interest. Hourly support given at 0.9522 (23/06/2016 low) is on target. The road is wide-open for further strengthening.
-
In the long-term, the pair is still trading in range since 2011 despite some turmoil when the SNB unpegged the CHF. Key support can be found 0.8986 (30/01/2015 low). The technical structure favours nonetheless a long term bullish bias since the unpeg in January 2015.
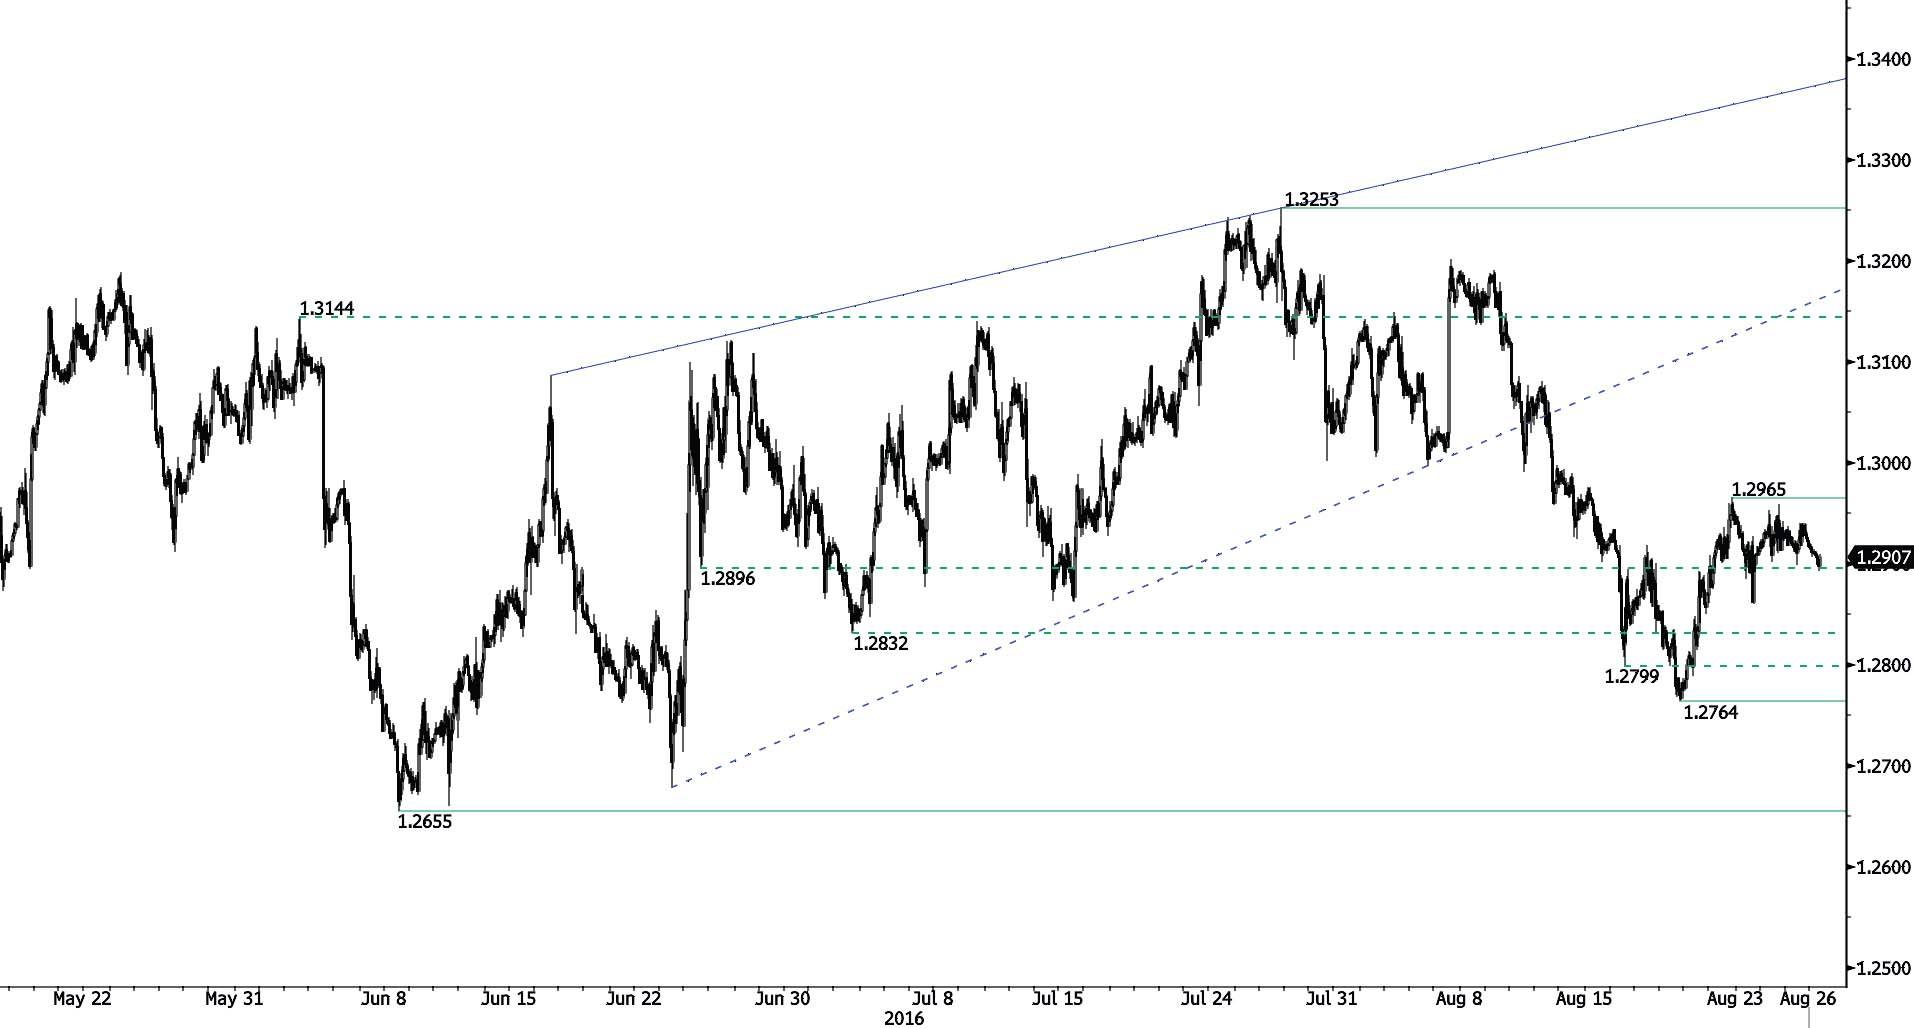
USD/CAD
Holding below resistance at 1.2965.
-
USD/CAD is holding below resistance at 1.2965 (22/08/2016 high). A break is needed to confirm deeper buying interests. The pair is now consolidating and should head again higher. Strong support can be found at 1.2764 (18/08/2016 low).
-
In the longer term, the pair is still trading below its 200-day moving average. Strong resistance is given at 1.4690 (22/01/2016 high). Long-term support can be found at 1.2461 (16/03/2015 low). The pair is likely in a consolidation phase within a new long-term decline.
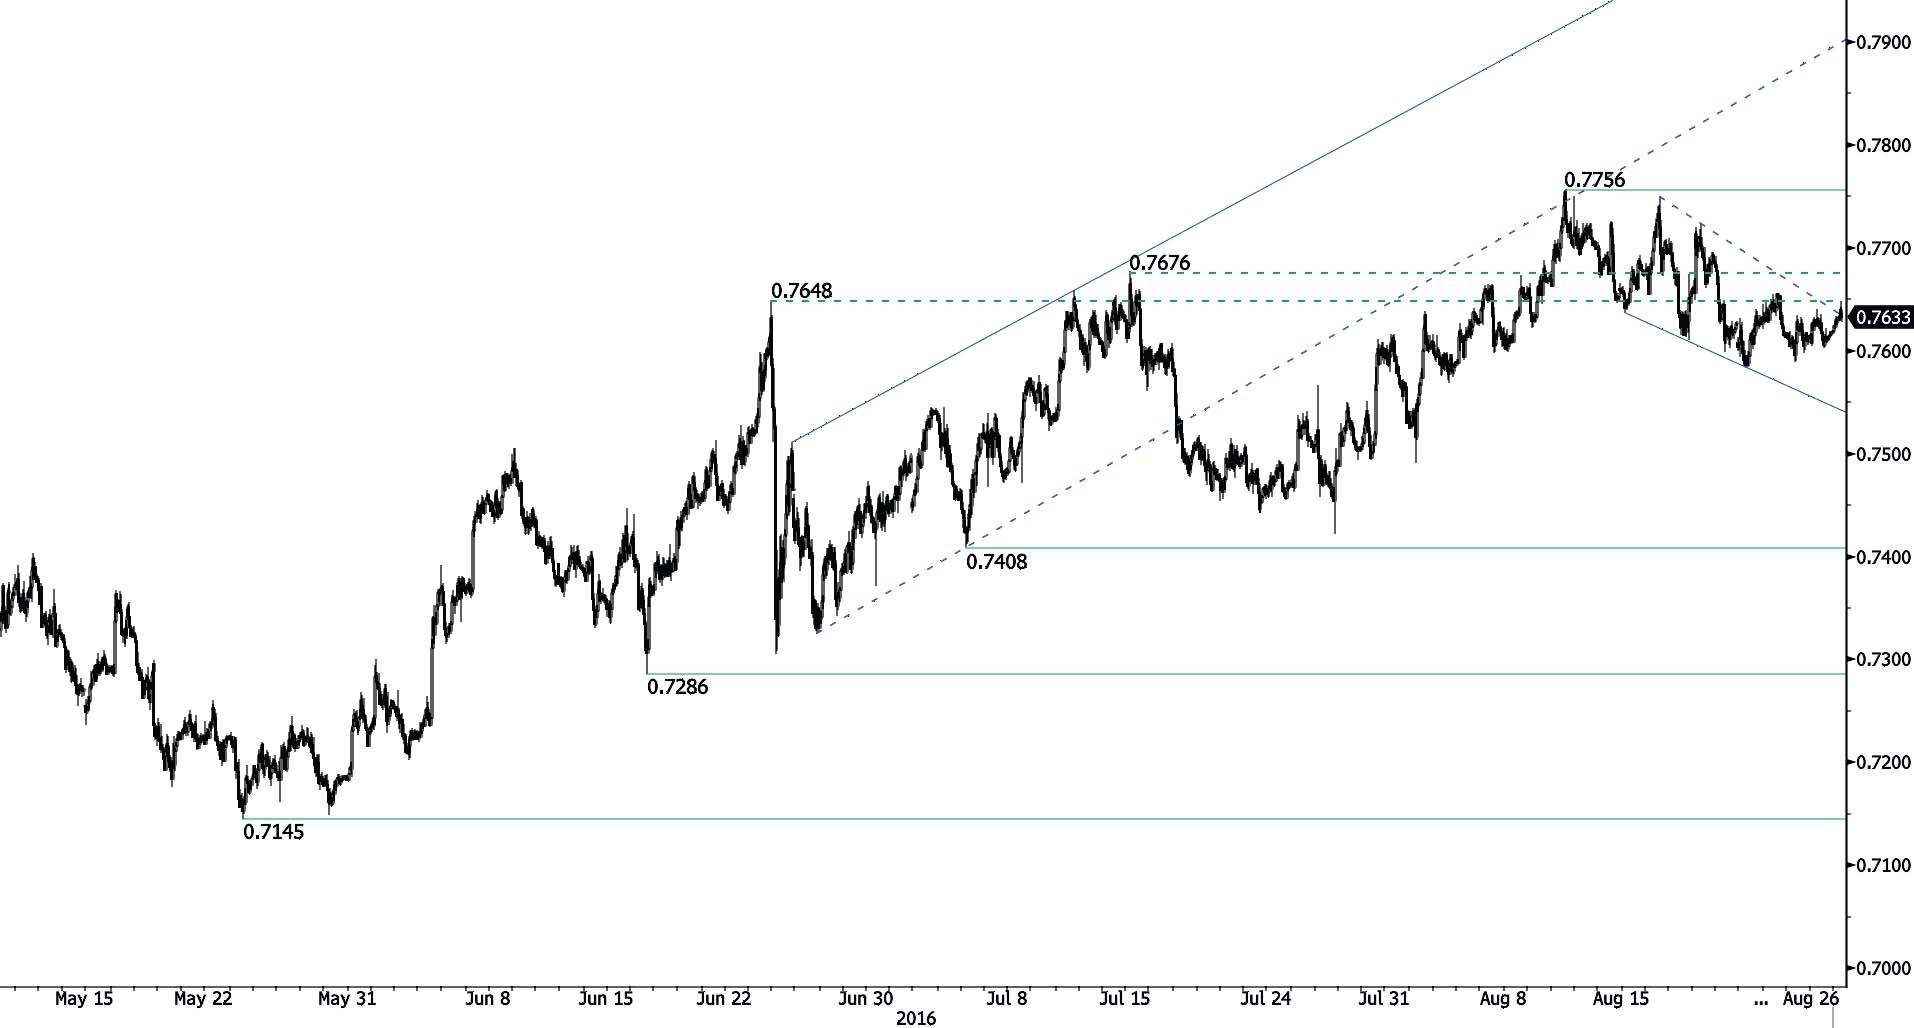
AUD/USD
Bullish signals?
-
AUD/USD is trading within downtrend channel. The pair has broken downtrend channel but further upside are needed to confirm the bullish move. Hourly support is given at 0.7584 (22/08/2016 low) and key resistance can be found at 0.7756 (10/08/2016 high). The brekaout may be a false bullish signal, expected further weakness.
-
In the long-term, we are waiting for further signs that the current downtrend is ending. Key supports stand at 0.6009 (31/10/2008 low) . A break of the key resistance at 0.8295 (15/01/2015 high) is needed to invalidate our long-term bearish view.
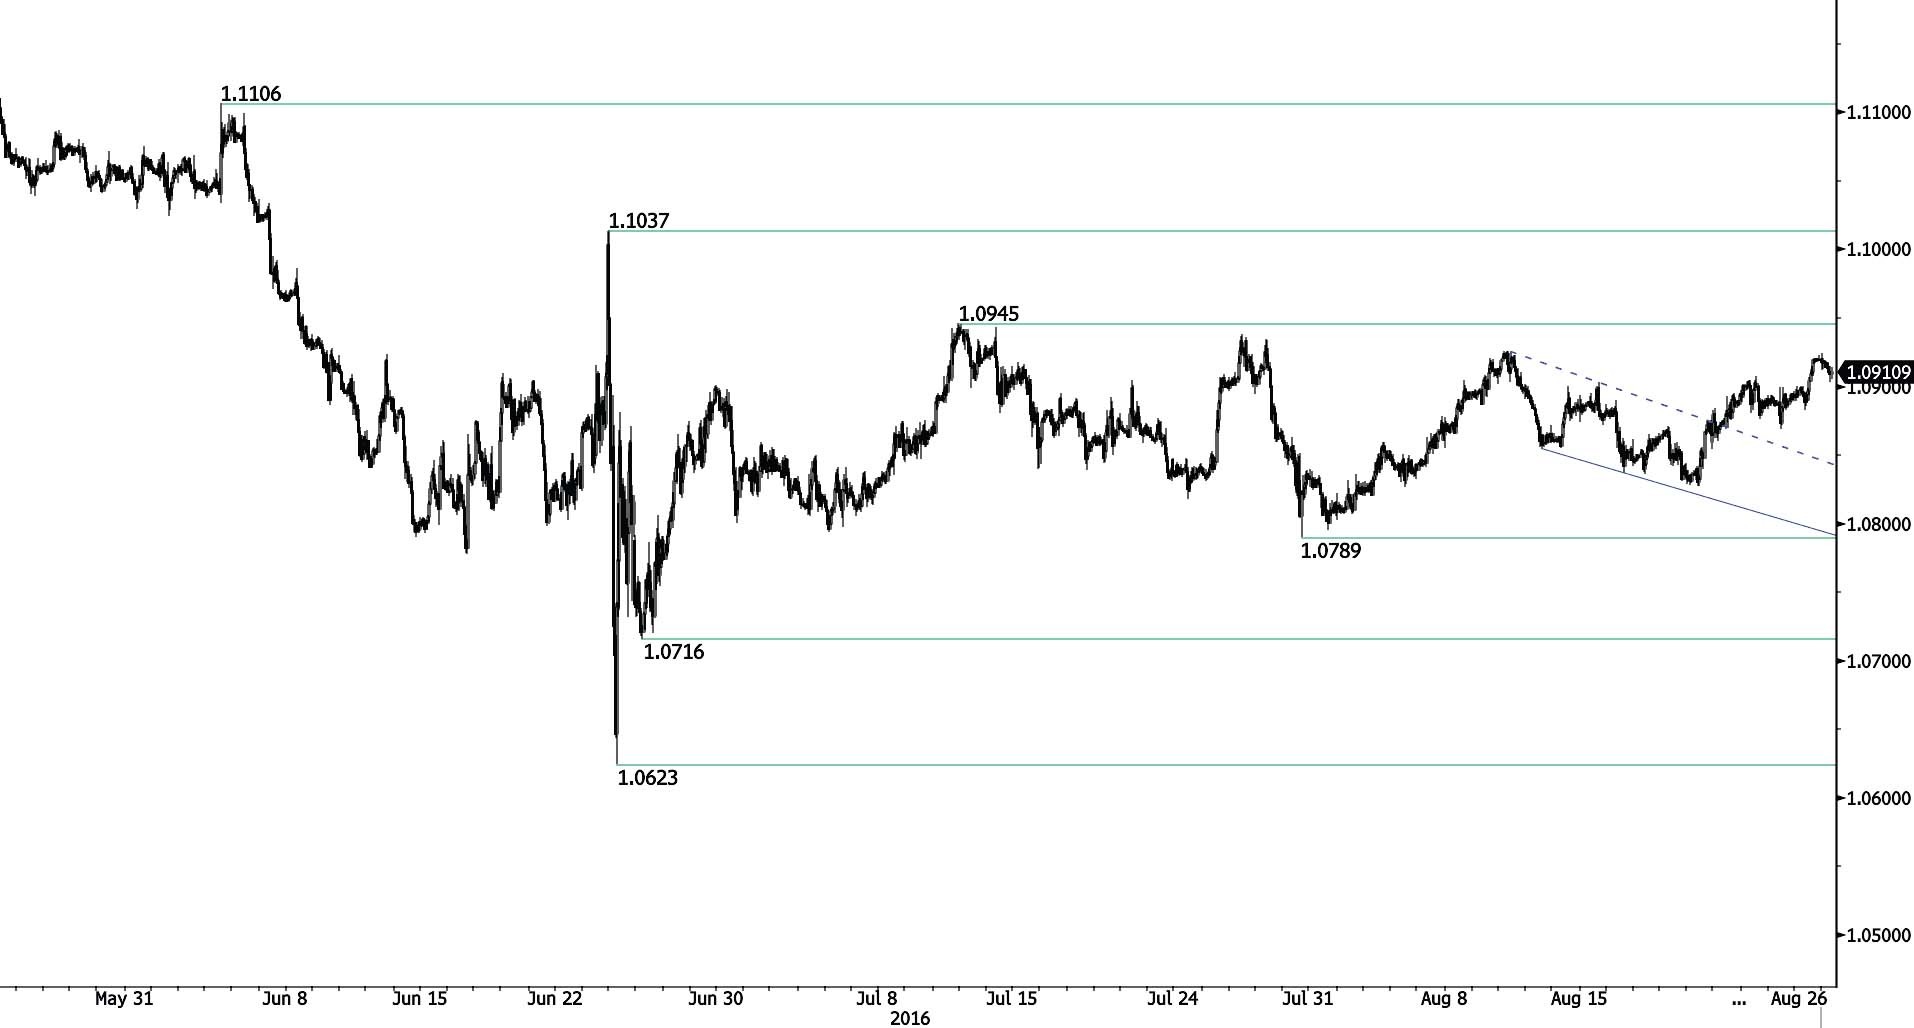
EUR/CHF
Trading above 1.0900.
-
EUR/CHF has increased above 1.0900. The pair is still having difficulties to reach resistance at 1.0945 (12/07/2016 low). A significant support lies at 1.0794 (06/07/2016 low). The low volatility may indicate that further weakness should happen.
-
In the longer term, the technical structure remains positive. Resistance can be found at 1.1200 (04/02/2015 high). Yet,the ECB's QE programme is likely to cause persistent selling pressures on the euro, which should weigh on EUR/CHF. Supports can be found at 1.0184 (28/01/2015 low) and 1.0082 (27/01/2015 low).
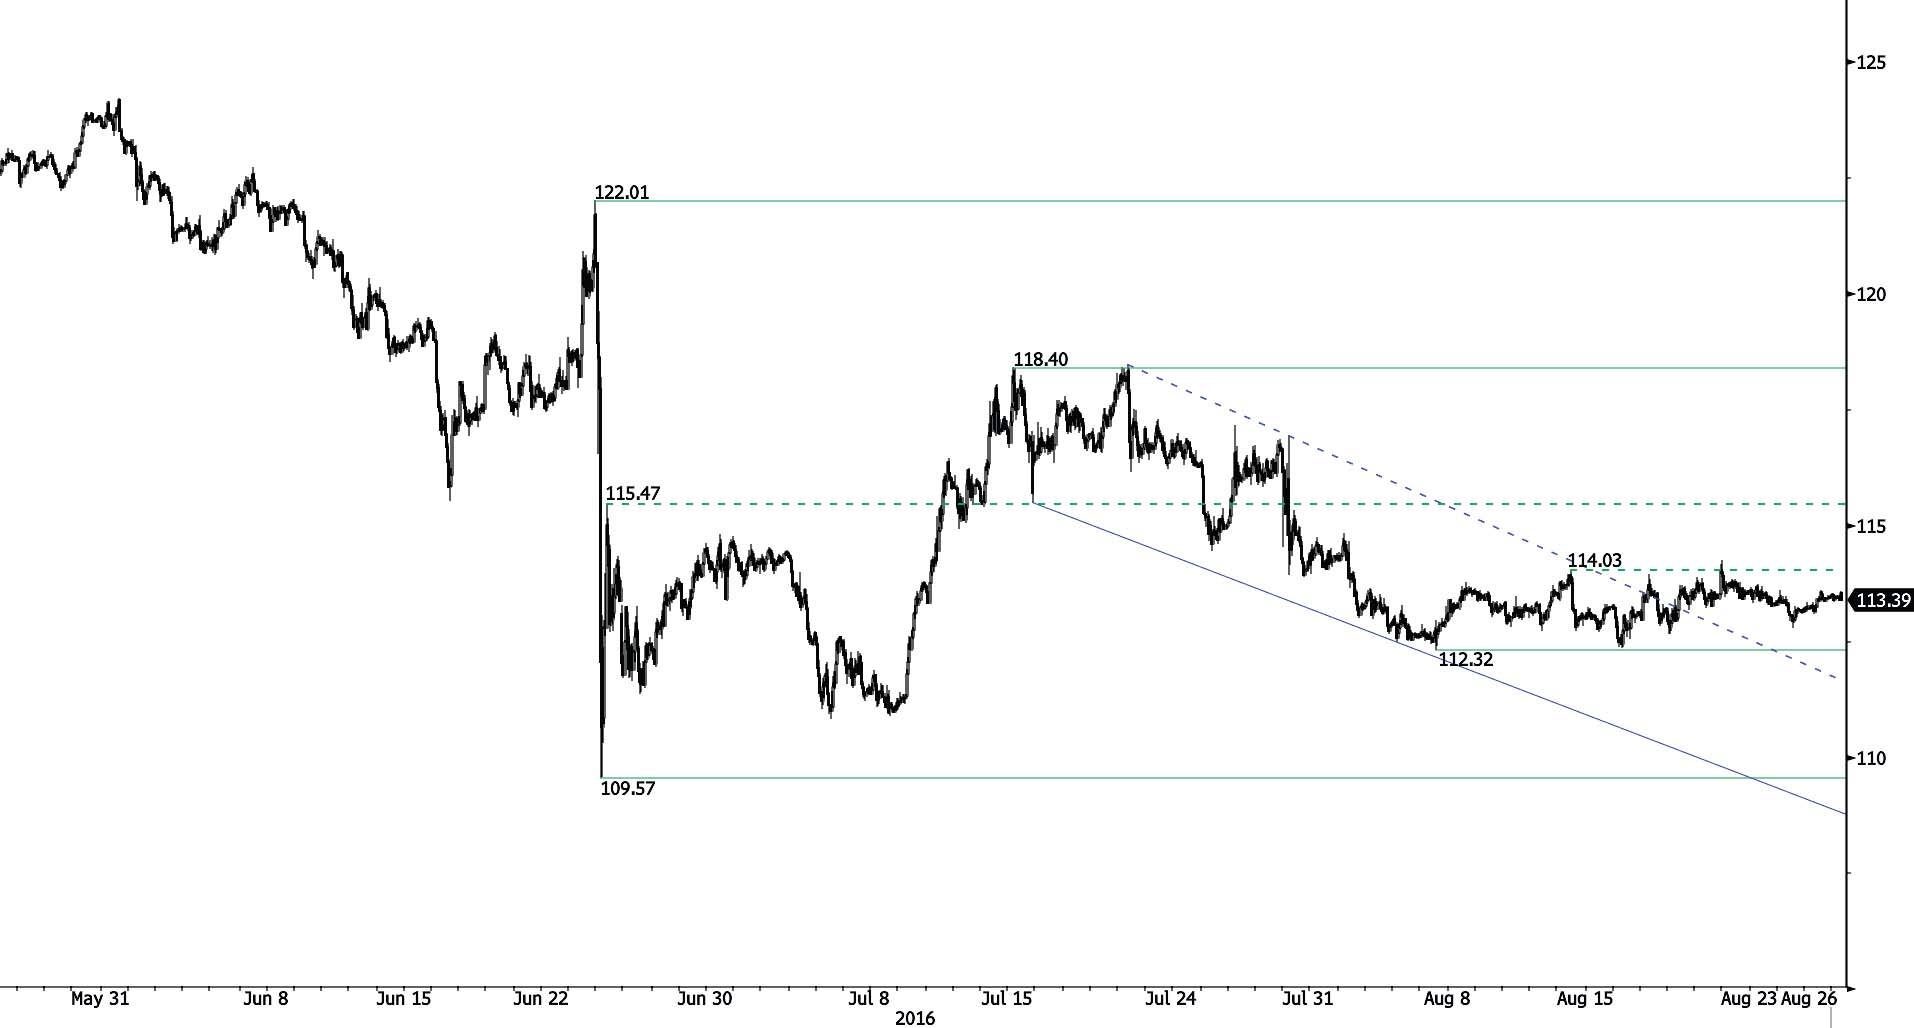
EUR/JPY
Still pausing.
-
EUR/JPY is trading with no volatility. A support is located at 110.83 (06/07/2016 low). Closest support lies at 112.32 (05/08/2016 low). Hourly resistance is given at 114.23 (21/08/2016 high). Buying pressures are weak. Expected to show continued consolidation.
-
In the longer term, the technical structure validates a medium-term succession of lower highs and lower lows. As a result, the resistance at 149.78 (08/12/2014 high) has likely marked the end of the rise that started in July 2012. The road is now wide open towards strong support at 94.12 (24/07/2012 low).
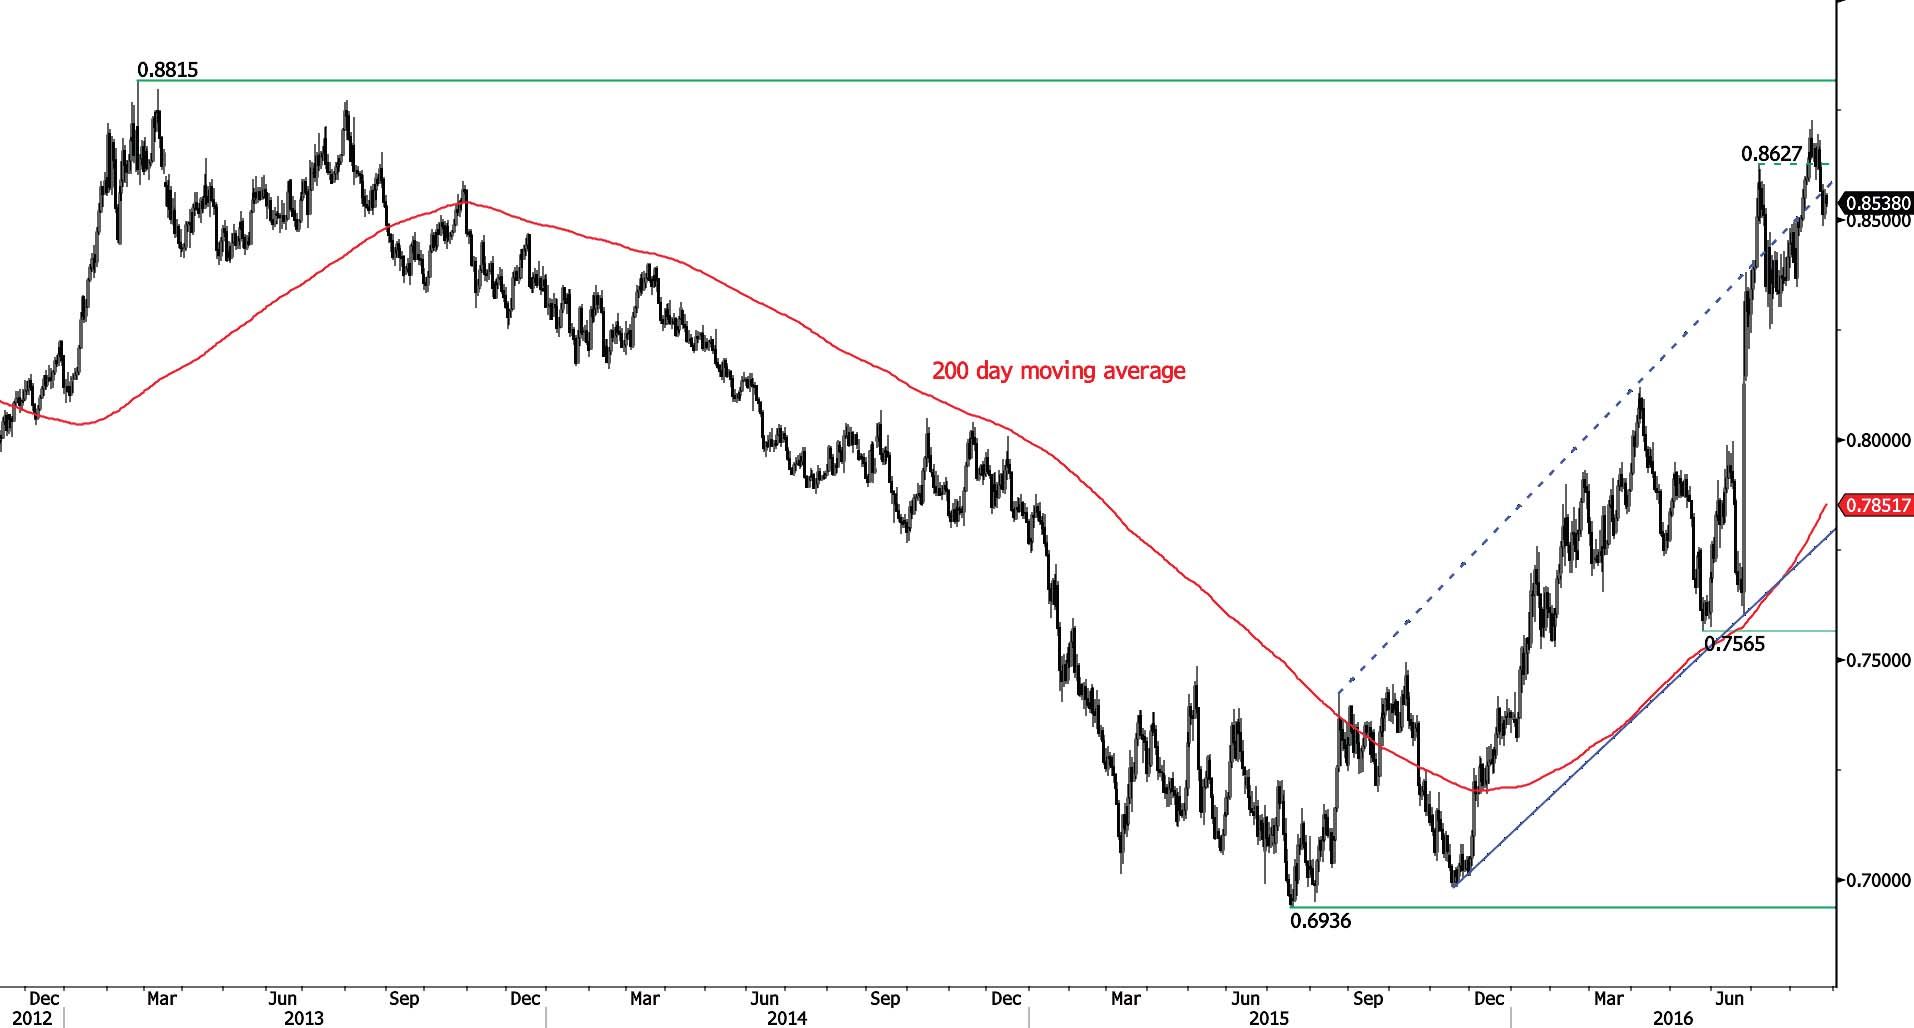
EUR/GBP
Ready for another upside move.
-
EUR/GBP has ended its short-term consolidation. The short-term technical structure has turned positive. Hourly resistance is given at 0.8724 (16/08/2016 high) and hourly support is located at 0.8518 (10/08/2016 low).
-
In the long-term, the pair is currently recovering from recent lows in 2015. The technical structure suggests a growing upside momentum. The pair is trading far above from its 200 DMA. Strong resistance can be found at 0.8815 (25/02/2013 high).
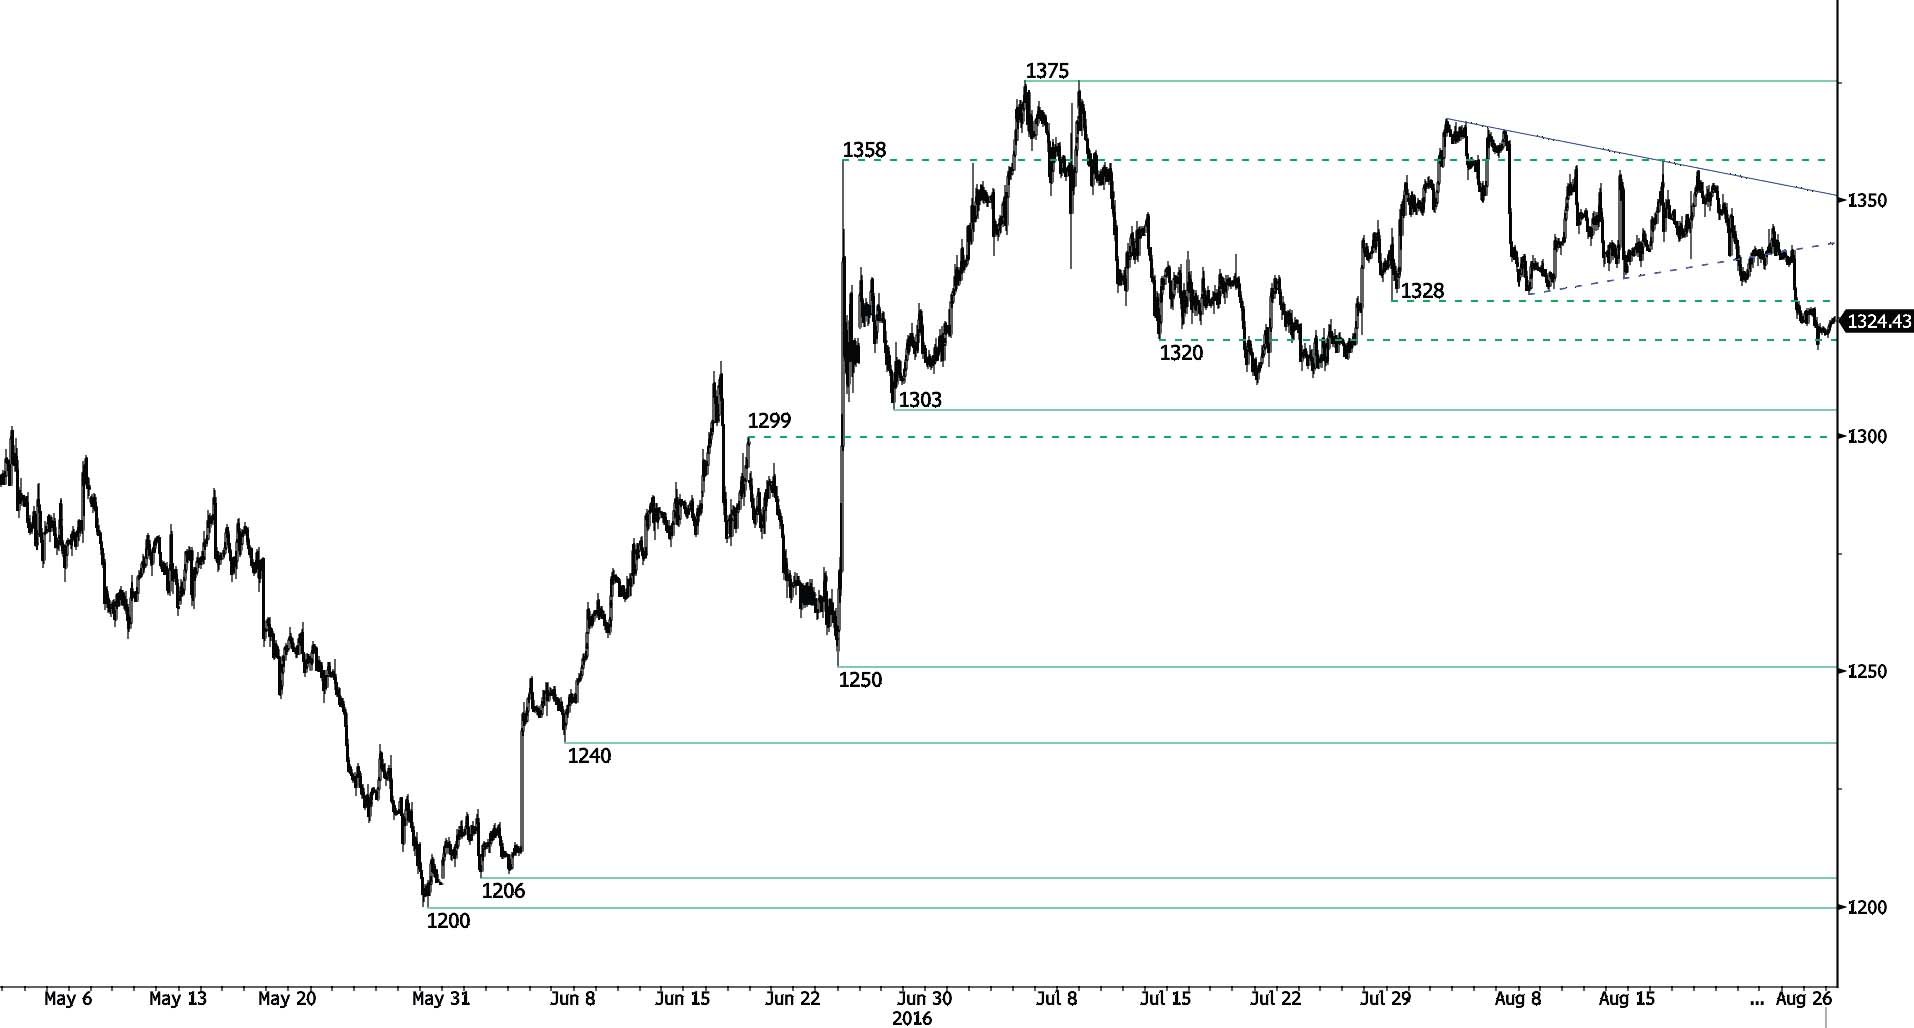
GOLD (in USD)
Selling pressures diminish.
-
Gold has broken hourly support at 1328 (29/07/2016 low) which was a key support. It is still a great entry point to reload bullish positions . A key resistance stands at 1375 (06/07/2016 high). Expected to show renewed bullish pressures.
-
In the long-term, the technical structure suggests that there is a growing upside momentum. A break of 1392 (17/03/2014) is necessary ton confirm it, A major support can be found at 1045 (05/02/2010 low).
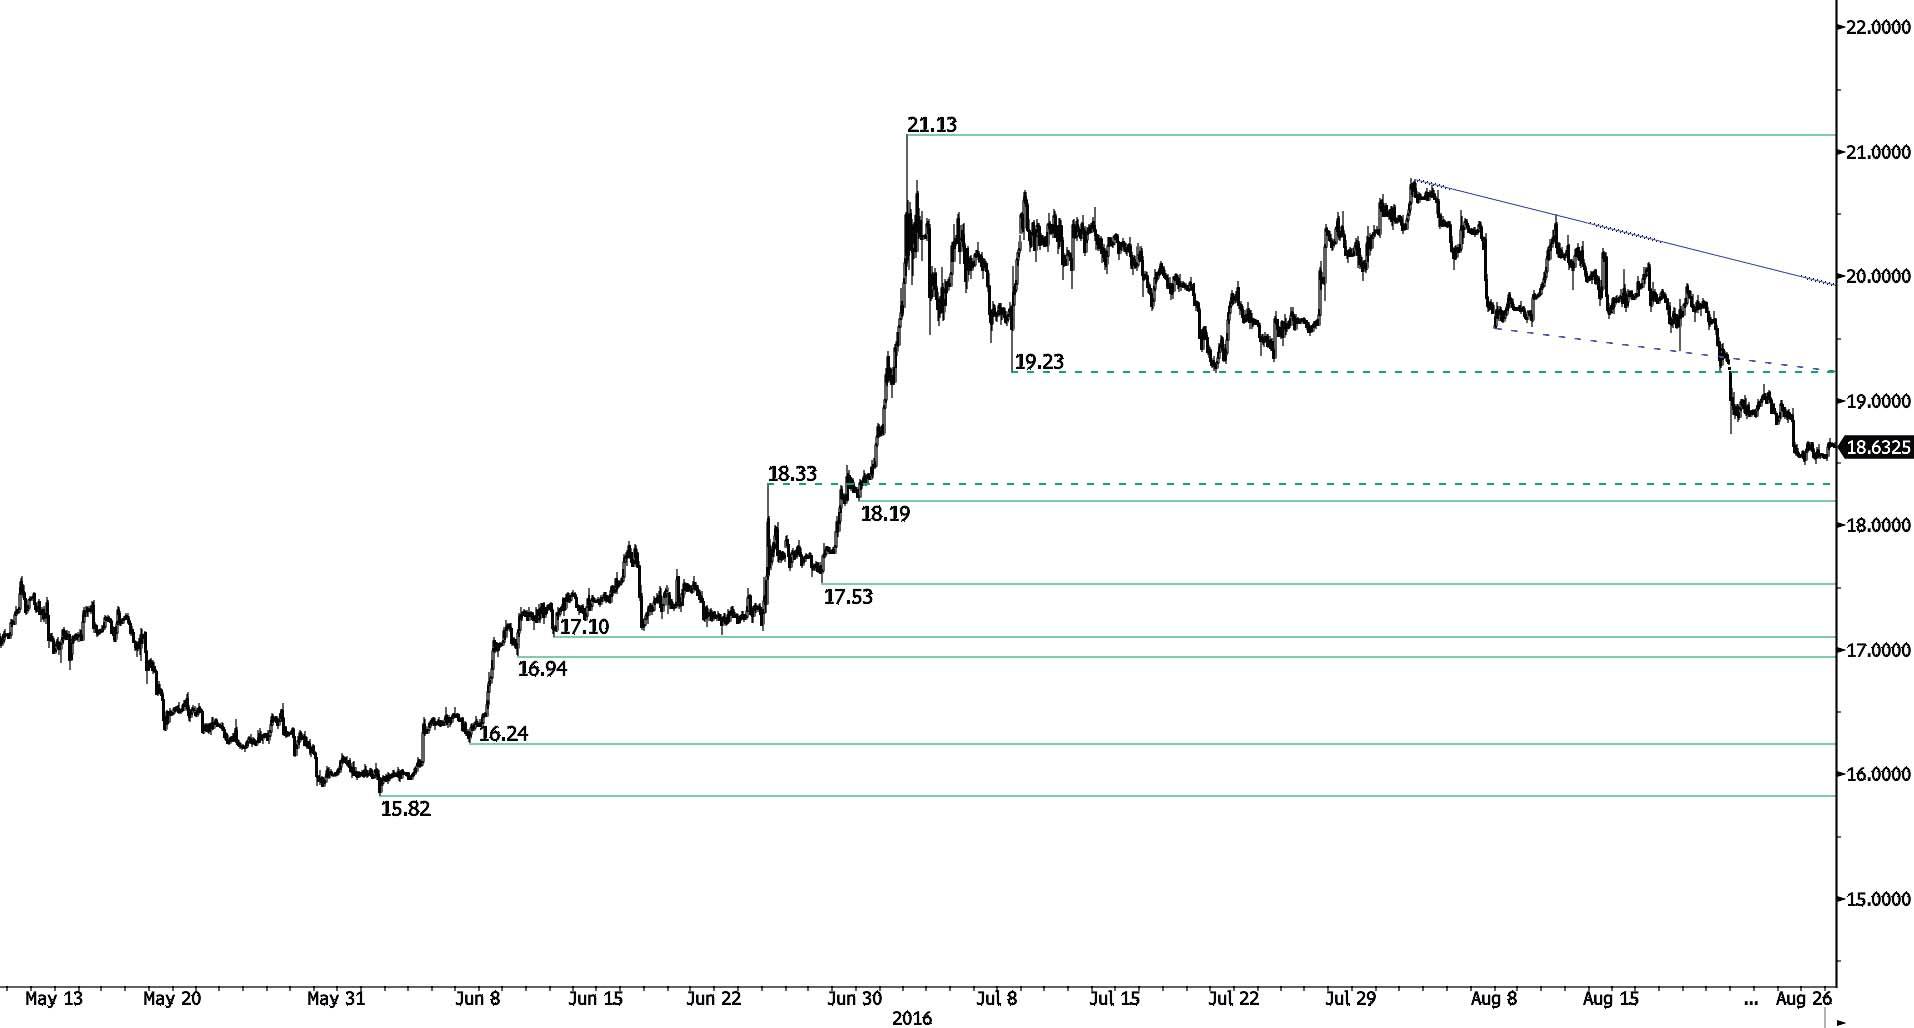
SILVER (in USD)
Medium-term bearish.
-
Silver is consolidating after the breach of the key support at 19.23 (08/07/2016 low). Hourly resistance can now be found at 19.12 (23/08/2016 high). Strong resistance is given at 21.13 (04/07/2016 high). Expected to further consolidate.
-
In the long-term, the metal is now in an increasing uptrend. Resistance is located at 25.11 (28/08/2013 high). Strong support can be found at 11.75 (20/04/2009).
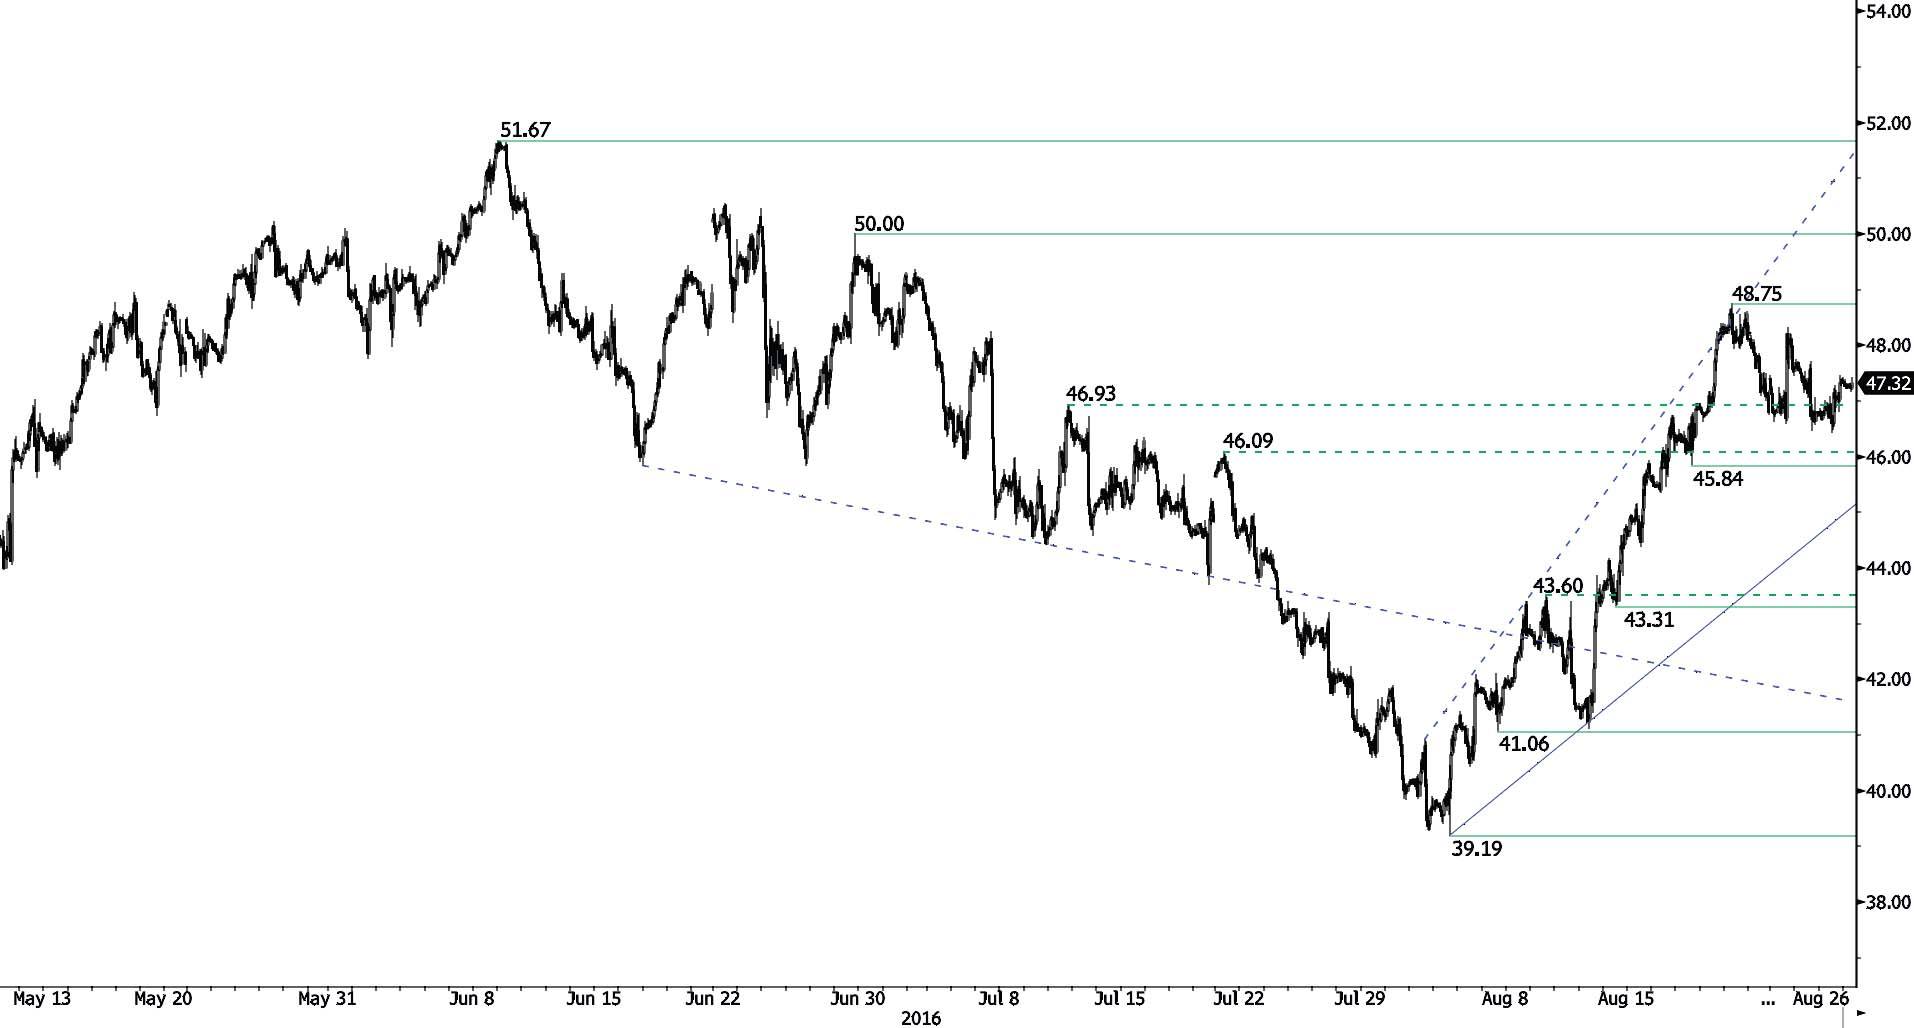
Crude Oil (in USD)
Setting lower highs.
-
Crude oil's bullish momentum has ended as the pair is now setting lower highs. Hourly resistance can be found at 48.75 (19/08/2016 high). A break of hourly support given at 45.84 (17/08/2016 low) would confirm a deeper bearish move. Time to reload bearish position.
-
In the long-term, crude oil is now recovering from its sharp decline and the signs of recovery are now strong. Strong support lies at 24.82 (13/11/2002) while strong resistance at 50.96 (09/10/2015 high) has been broken. Crude oil is holding way above its 200-Day Moving Average. Expected to reach 60 before year-end.
Author

Yann Quelenn
Swissquote Bank Ltd
Yann Quelenn is a Market Analyst at Swissquote Bank with strong technical and financial background. Previously, he worked as FX Trader at Banque Privée Edmond de Rothschild and as Portfolio Manager at Polaris Investment in Luxembourg.


