Soybeans or soya beans to some. Most people probably associate them with soy milk and soy sauce. Mmm. I feel like some Chinese food already! These are just two examples of its many uses.
Let’s take a top down approach to the analysis beginning with the big picture yearly chart.
SOYBEANS YEARLY CHART
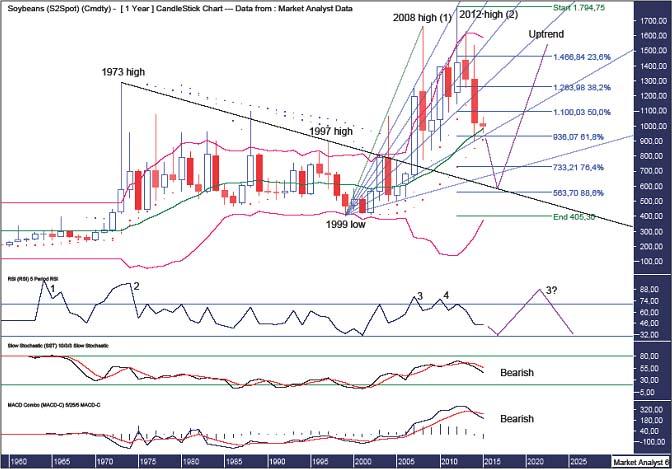
There is a lot of interesting information on this chart so let’s break it down piece by piece.
There appears to be a “three strikes and you’re out” top formation in play. This is a common topping pattern which consists of three consecutive higher highs. The first strike was the 2008 high while the second strike was the 2012 high. We now just await the third and likely final high to complete the pattern.
The 2012 high at US$1794 was accompanied by a rare fourth bearish divergence on the Relative Strength Indicator (RSI). This is bearish indeed and, not surprisingly, price has declined steeply from that top.
However, something I have noticed in this situation is that after the decline ends price then goes back up to make a new high that is accompanied by a RSI reading that is higher than that found at the third and fourth bearish divergences but lower than the second bearish divergence. So, I am looking for the third strike high to be accompanied by a RSI reading that is higher than that found at the 2008 and 2012 highs but lower than the second bearish divergence which accompanied the 1973 high. This would make a triple bearish divergence.
The Stochastic and Moving Average Convergence Divergence (MACD) indicators have both made recent bearish crossovers so there still appears to be further downside in store. And this is on the yearly chart no less.
I have added the Parabolic Stop and Reverse (PSAR) indicator which pertains to the dots. Now there are two sets of dots on this chart. That is because I use both a tight setting and loose setting with this indicator. The tight setting acts as a kind of warning system as price more often than not then goes on to bust the support (or resistance) from the loose setting.
In this case, we can see price busted the tight PSAR support in 2014 and has now found support at the loose setting support. I expect a more substantial rally but the early warning system leads me to believe any rally will be suspect and once finished price should come back down to bust the loose setting support which currently stands at US$909.
I have added Bollinger Bands which show price has left the upper band and is now at the middle band. I expect price to do some more work around this middle band before making its way to the lower band. And considering the 2008 and 2012 highs traded well above the upper band signifying solid tops then it makes sense that a big downtrend is now in play in which price could be expected to finally bottom out at the lower band.
So where is the final low likely to be?
I have added Fibonacci retracement levels of the move up from 1999 low to 2012 high. I am looking for a deep retracement back to at least the 76.4% level at US$733 and even as low as the 88.6% level at US$563.
I have also added a Fibonacci Fan from the 1999 low to 2008 high which is showing some nice symmetry with price. The 2012 high was rejected right at the 23.6% angle while the 2013 high was rejected at the 38.2% angle. And the recent low in 2014 was at support given by the 76.4% angle. I am looking for the final low to be around the 88.6% angle and possibly a false break of that angle. Let’s see.
Also, I have drawn a downtrend line from the 1973 high connecting the 1997 high. I am looking for the final low to test this trend line.
Interestingly, a low in late 2016 and most likely in 2017 between the 76.4% and 88.6% Fibonacci retracement levels would be right around this downtrend line. That would also be a marginal break of the 88.6% Fibonacci Fan angle and be right around the lower Bollinger Band. Time will tell!
Once this next major low is in place I then expect an uptrend that takes price to new all time highs.
Let’s move on to the monthly chart.
SOYBEANS MONTHLY CHART
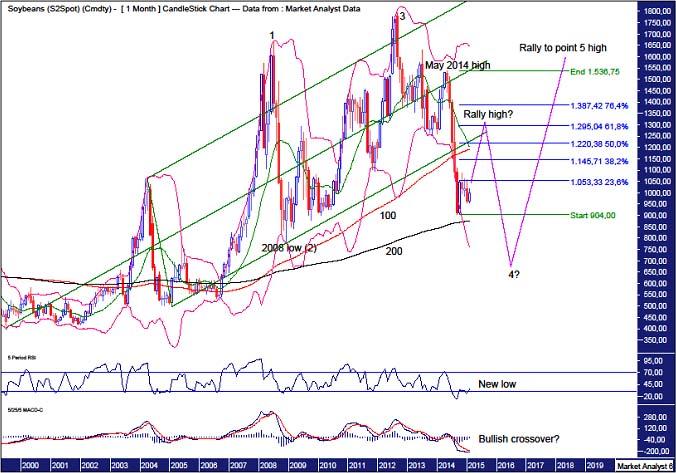
I have drawn an Andrew’s Pitchfork which shows the first two highs were false breaks above this structure. Price eventually broke down below the structure in mid 2014. Is this a false break low? I doubt it. However, I do favour price heading back up and attempt to get back inside the pitchfork. But I suspect price will turn back down around the lower channel line and continue the downtrend. Why?
The RSI made a new low and is looking weak. I expect the final low to be accompanied by bullish divergences which requires new price lows accompanied by less weak indicator readings.
The MACD indicator looks to be threatening a bullish crossover so perhaps price is already headed back up to the pitchfork formation.
The Bollinger Bands show price has moved away from the lower band and while a move back to the lower band is not out of the question I favour price is now on its way back to the middle band. I favour the rally ending just above the middle band although price pushing further up to the upper band is certainly a possibility.
As for where any coming rally may end, I have added Fibonacci retracement levels of the move down from May 2014 high to recent low. A move back to the lower pitchfork trend line would see price around the 50% level at US$1220 or the 61.8% level at US$1295. Of course it is possible for price to rally even higher but we can come back to that at a later stage.
Once the next rally high is in place I favour a move to new lows.
This scenario sets up the potential for a big 5 point broadening top with the 2008 high point 1, the 2008 low point 2 and the 2012 top point 3. That means price is currently on its way to a point 4 low which would then be followed by a huge bull run up to all time highs that eventually sees the point 5 high complete the pattern.
Finally, I have added moving averages with time periods of 100 (red) and 200 (black) which is evidence of the massive bull trend in place despite recent declines. The 100ma is well above the 200ma and this is the monthly chart so the bull trend is solid indeed. I expect these averages to move closer together as the final price low is put in place.
Let’s wrap it up with the weekly chart.
SOYBEANS WEEKLY CHART
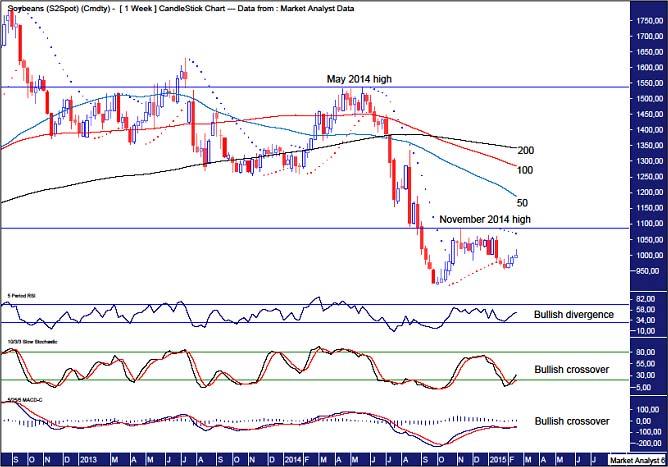
The RSI shows a bullish divergence on the recent low while the Stochastic and MACD indicators both show recent bullish crossovers. While a new low is not out of the question, I believe price is now on the up – a bear market rally is in progress.
Confirmation the rally is on will be taking out the November 2014 high at US$1086. And any rally should not trade above the May 2014 high at US$1536.
The PSAR indicator has a bearish bias which gives credence to a new low but I doubt that. Instead, I believe price will shortly take out that resistance.
The moving averages with time periods of 50 (blue), 100 (red) and 200 (black) is testament to the weekly downtrend in place with the 200ma above the 100ma which is in turn above the 50ma. Perhaps one of these moving averages will reject any price advance.
Summing up, the short to medium term looks promising for the bulls however caution must be heeded as the longer term favours lower prices. That’s how I see it anyway!
The above is a matter of opinion provided for general information purposes only and is not intended as investment advice. Information and analysis above are derived from sources and utilising methods believed to be reliable, but we cannot accept responsibility for any losses you may incur as a result of this analysis. Individuals should consult with their personal financial advisors. Put simply, it is JUST MY OPINION.
Recommended Content
Editors’ Picks
EUR/USD holds above 1.0700 ahead of key US data

EUR/USD trades in a tight range above 1.0700 in the early European session on Friday. The US Dollar struggles to gather strength ahead of key PCE Price Index data, the Fed's preferred gauge of inflation, and helps the pair hold its ground.
USD/JPY stays above 156.00 after BoJ Governor Ueda's comments

USD/JPY holds above 156.00 after surging above this level with the initial reaction to the Bank of Japan's decision to leave the policy settings unchanged. BoJ Governor said weak Yen was not impacting prices but added that they will watch FX developments closely.
Gold price oscillates in a range as the focus remains glued to the US PCE Price Index

Gold price struggles to attract any meaningful buyers amid the emergence of fresh USD buying. Bets that the Fed will keep rates higher for longer amid sticky inflation help revive the USD demand.
Sei Price Prediction: SEI is in the zone of interest after a 10% leap

Sei price has been in recovery mode for almost ten days now, following a fall of almost 65% beginning in mid-March. While the SEI bulls continue to show strength, the uptrend could prove premature as massive bearish sentiment hovers above the altcoin’s price.
US core PCE inflation set to signal firm price pressures as markets delay Federal Reserve rate cut bets

The core PCE Price Index, which excludes volatile food and energy prices, is seen as the more influential measure of inflation in terms of Fed positioning. The index is forecast to rise 0.3% on a monthly basis in March, matching February’s increase.


