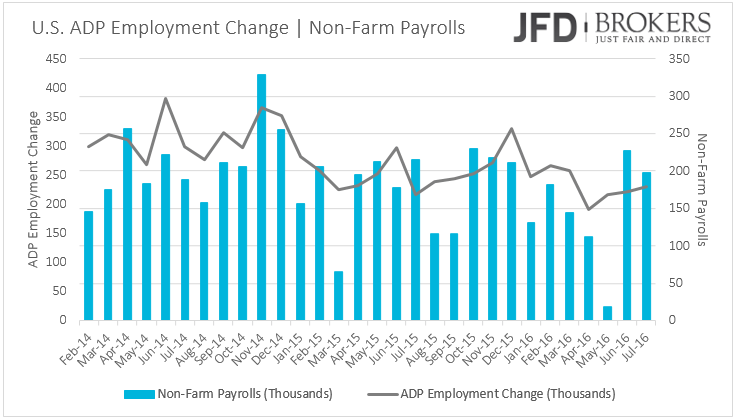
All the Eyes on the U.S. ADP Employment Change; When is the next Fed Rate Hike?

All the eyes today are concentrated on the U.S. ADP number, which is a preparation for the non-farm payrolls report coming out on Friday. Fed policymakers left the door open for a rate hike as soon as September, however, everything signals that the next rate hike is heavily data dependent.
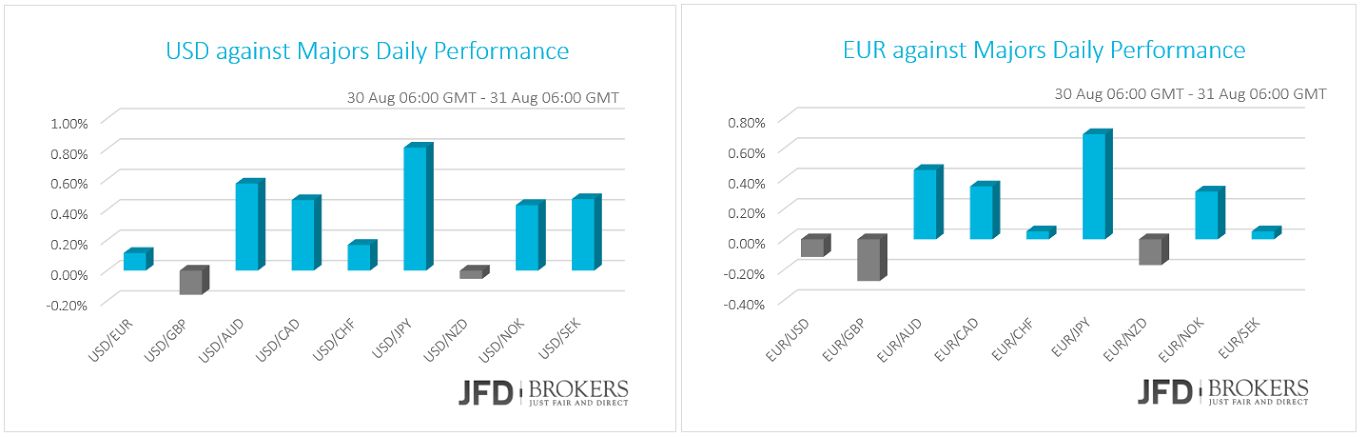
The ADP employment change is expected to show that 171K payrolls were added in August versus an increase of 179K in July. On Tuesday, the U.S. dollar has been slightly higher against most of the G10 currencies bolstered by the better than expected consumer confidence in August. The sentiment indicator picked up to 101.1 versus 97.0 forecasted reaching the highest level in nearly a year. The prices of the houses rose 5.1% in June according to the Case-Shiller Indices, marginally lower than last month’s increase of 5.2%.
Eurozone’s Sentiment Plunged
The single currency was traded mixed against the majors on Tuesday and early Wednesday despite the weak sentiment indicators released for August. The services sentiment fell at 10.0 versus 11.2 before, industrial confidence plunged further in the negative territory at -4.4 from -2.6 before while both the economic sentiment and the business climate came below expectations as well. Later in the day, Eurozone’s flash inflation rate for August and the unemployment rate for July are coming out.
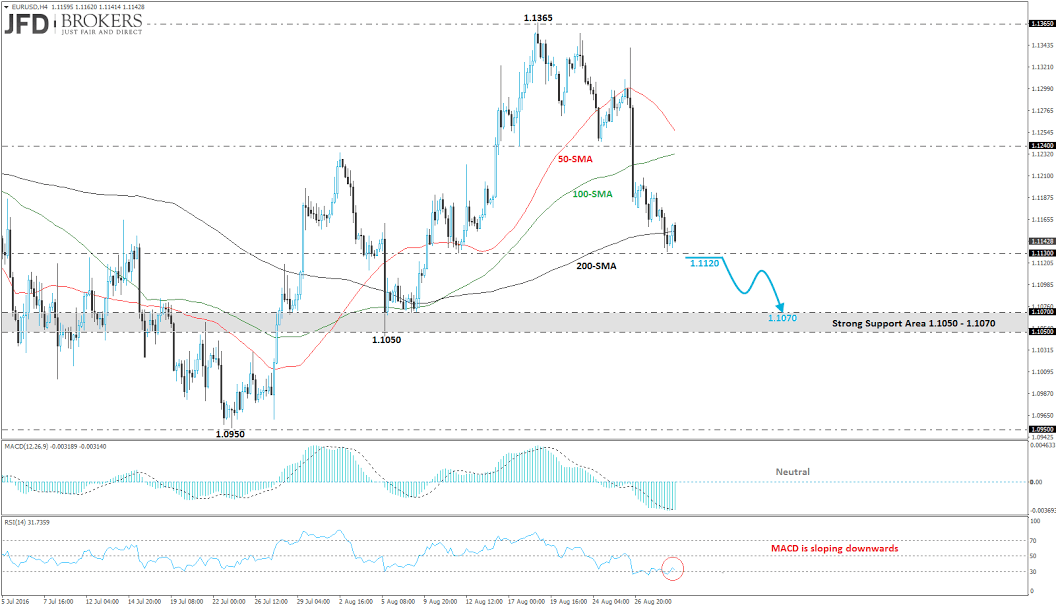
EUR/USD – Technical Outlook
In regards to the world’s largest currency pair – the EUR/USD – the risk is towards the downside, as the price fell more than 1% on Friday. The common currency during yesterday’s session recorded the second consecutive negative candle and met the 50-daily SMA. Early this morning the pair had a rebound on the aforementioned obstacle which coincides with the 1.1130 support level and is currently trading near the 1.1160 price level. Additionally, going to a lower timeframe, the price surpassed above the 200-SMA but now is moving below it. A successful break below the 1.1130 barrier will open the doors for the strong support area at 1.1050 – 1.1070. A possible scenario is a bounce off at 200-daily SMA which is near the 1.1170 price level and then a continuation of the downward movement. The technical indicators on this chart are in negative territory despite the RSI which is now above the 30 level instead of the previous hours. Also, the MACD oscillator had a bullish crossover with its trigger line.
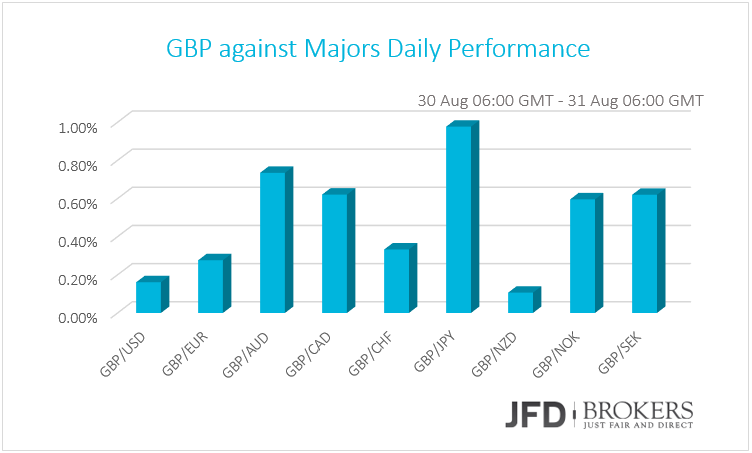
Sterling Was Traded Broadly Higher
The sterling has been in another quiet session and covered some of its earliest losses following the only economic indicator released from U.K. The Gfk consumer confidence released on Tuesday revealed that consumers feel more optimistic that initially estimated. The indicator came out -7 versus -12 before and -8 expected. On Wednesday, the national housing prices index revealed that housing prices picked up 5.6% compared to the year before, and 0.6% compared to last month, above market expectations.
GBP/USD – Technical Outlook
The GBP/USD pair plunged 0.4% over the last two days and created the second red candle in a row. On the daily chart, the pair is currently trading below the 50-SMA which is a very strong resistance for the bulls as the referred level overlaps with the 1.3120 barrier. Today the day started with a positive potential move since on the same chart, technical indicators are moving near its mid-levels whilst the MACD oscillator is rising after the aggressive sell-off during the Britain’s decision leaving the European Union. On a lower timeframe, the price is consolidating between the 100-SMA which is slightly above of the 1.3060 support level and the 200-SMA which coincides with the 1.3120 resistance level. The MACD oscillator holds neutral within the negative territory and the RSI indicator is sloping downwards. The technical structure suggests further short-term sideways action until a penetration above the 1.3120 strong barrier or below the 1.3060 obstacle.
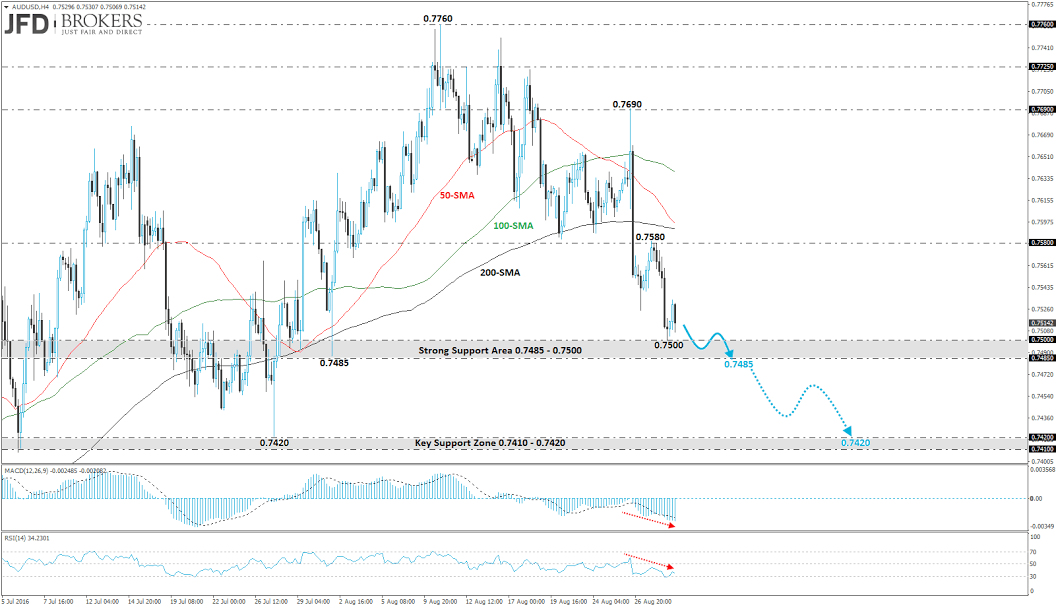
AUD/USD – Technical Outlook
The AUD/USD pair dropped to its lowest level in four weeks and plunged more than 1.6%. Also, the stronger U.S. dollar is also playing a role in the pair’s weakness. Now, the pair is recording the third negative week in a row and is trading near the 0.7520 price level. During yesterday’s session, the commodity pair had a pullback on the 50-daily SMA which overlaps with the strong resistance level at 0.7585. On the 4-hour chart, the MACD oscillator is following a negative path with some strong momentum while the RSI is still above the 30 level but is sloping downwards. Having the above in mind, for the short-term traders, we could experience a move south until the 0.7485 level. If the price will have a successful break below the latter level then will probably expose until the significant support zone at 0.7410 – 0.7420.
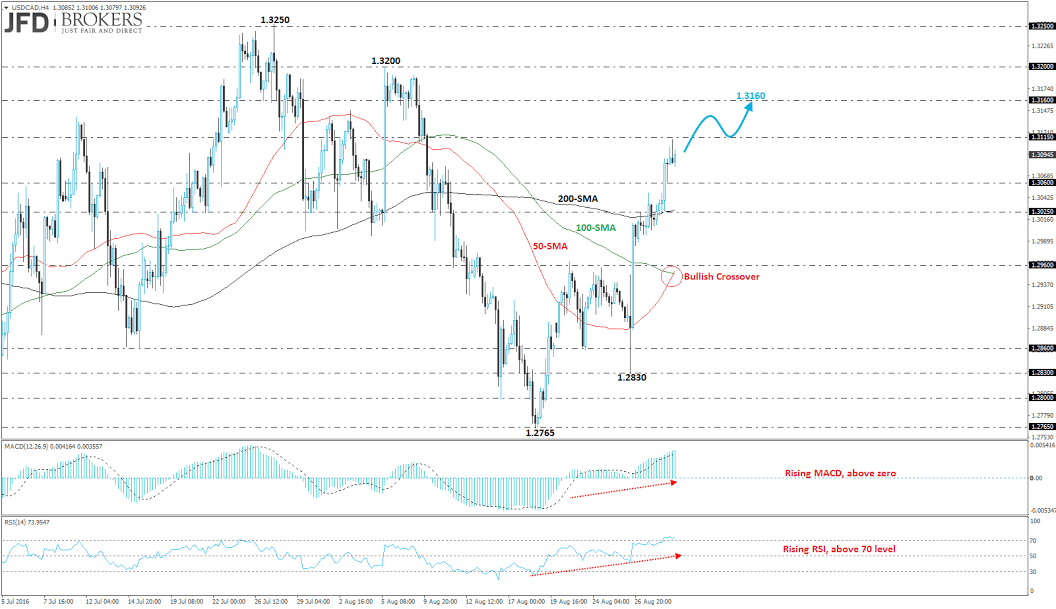
USD/CAD – Technical Outlook
The USD/CAD pair surged more than 1.5% since last week and now is creating the second green week in a row. Over Tuesday’s period, the pair surpassed above the 50-daily SMA and the 200-SMA on the 4-hour chart as it challenged the 1.3115 resistance level. The commodity pair continues to look bullish, as it continues to push towards the 1.3115 barrier. After breaking up the 1.3060 support level during yesterday’s session the pair opened the way for the 1.3160 resistance level. In addition, on the 4-hour chart, shows that the price is now moving well above the three SMAs (50-SMA, 100-SMA, 200-SMA) and the 50-SMA had a bullish crossover with the 100-SMA. Also, technical indicators have corrected extreme overbought readings. The MACD oscillator is moving above both, its zero and trigger lines suggesting a strong momentum while the RSI indicator is sloping upwards above the 70 level.
What to watch today
Today, the German retail sales for July and unemployment rate for August will be released. Afterwards, the attention turns to Eurozone, where the unemployment rate for July and the preliminary consumer price index for August are coming out. The unemployed to people are forecasted to be at 10.0% in July marginally lower of 10.1% have been before. The consumer prices are expected to show a slightly steeper increase than before at 0.3% compared to the year before, versus 0.2% the previous month according to the flash figure. Going to U.S., the ADP Employment Change for August will be closely eyed, two days ahead of the Non-Farm Payrolls report. The monthly change of the non-farm, private employment is estimated to be 165K versus 179K in July. The pending home sales for July will be released as well a couple of hours later.
Author

Efthivoulos Grigoriou joined JFD Brokers in late 2013. He is a leading Strategist and investment specialist applying global micro – macro approach to investing in G10 currencies.


