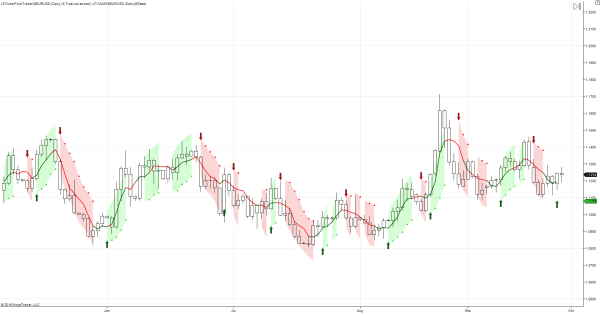
Today I would like to take look at one of my favorite combination plays. Using the VWAP indicator as a tool for front running the turn in Order Flow. This combination play provides high probability entries and increases the the profits available from Order Flow trading.
Tools of The Trade
Volume Weighted Average Price – or VWAP, for short. VWAP is the key to understanding the distribution of volume…VWAP stands for Volume Weighted Average Price and is derived by applying the most well known concept of technical analysis, the moving average, to the theory of volume. It measures the average price weighted by volume, and is mostly commonly used on intraday charts to determine the market direction.
VWAP is calculated by taking the Dollar value of all trading periods and then dividing by the total trading volume for the current day.
The easiest way to measure VWAP is to use it as a simple moving average. Therefore, if price is above the VWAP, price is rising, but if price is below the VWAP, it suggests that price is falling. As we mentioned above, the VWAP can indicate where trends are developing in the market.
It is the ability to define trend development or reversal that make this tool so powerful when combined with simple support and resistance levels.
My preferred setting for the VWAP and Order Flow trader indicators are 5 period length calculated on close.
The Trading Technique
I monitor my time frame of choice seeking potential trade opportunities. I watch the charts looking for support and resistance structures to develop. Once I have these levels marked I then watch for a VWAP signal to enter a trade, with the option to add to my position if I get a corresponding Order Flow Trader confirmation.As you can see from the chart example below the EURUSD was trading in a down trend testing the 1.04/05 level where Order Flow trader flipped bullish as price moved away from that level I mark it on the chart. I watch the price action for a retest of support as this level that may set up a daily double bottom structure. This set up offers a high probability counter trend trading opportunity when confirmed with VWAP and Order Flow trader.
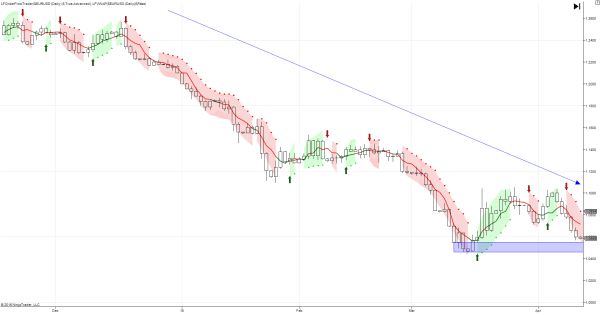
Having marked the potential support structure. I monitor price action for a retest of the bids watching the VWAP indicator to paint green over the candle or candles that test the support zone.
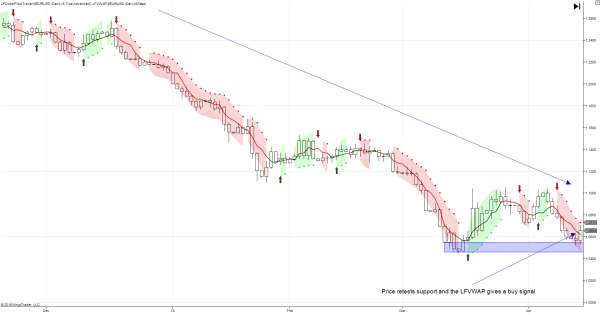
Now I have a retest of support with an VWAP buy signal. I enter Buy stops orders above the high of signal candle and I place protective sell stop orders below lows of the support level. I place an initial target at one multiple of the initial risk of the trade as highlighted in the chart below
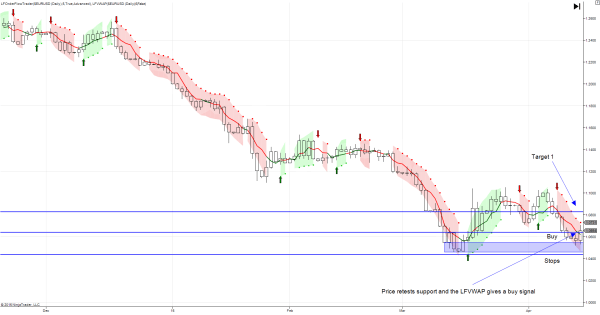
Now I have been triggered into the trade I turn my attention to Order Flow trader watching for a confirmation signal to give me a signal to add to my position and press an already profitable trade.
As you will see from the chart below Order Flow trader confirms the VWAP buy signal. With this additional signal I add to my position entering a buy order above the high of the daily close that produces the signal.
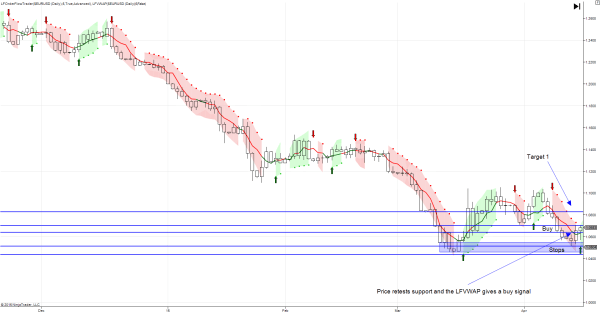
The price action develops favorably for the combined positions and tests the initial target level. At this point I close half my position. After testing the primary profit objective the VWAP flashes a sell signal at which point I move the stops on the remaining position to the original entry level. I now allow the price action to either take out the remainder of the position at break even or extend further in my favour.

Price action comes close to my break even stop but doesn’t trigger an exit. The action then reverses in my favour and breaks higher at which point I begin to monitor upside objectives.
I mark the next upside resistance level. My trading plan suggests I should target a break of resistance, to then act as support. This part of my plan ultimately allows me to trail my stops and secure further profits on the trade. The next resistance level is marked on the chart below.
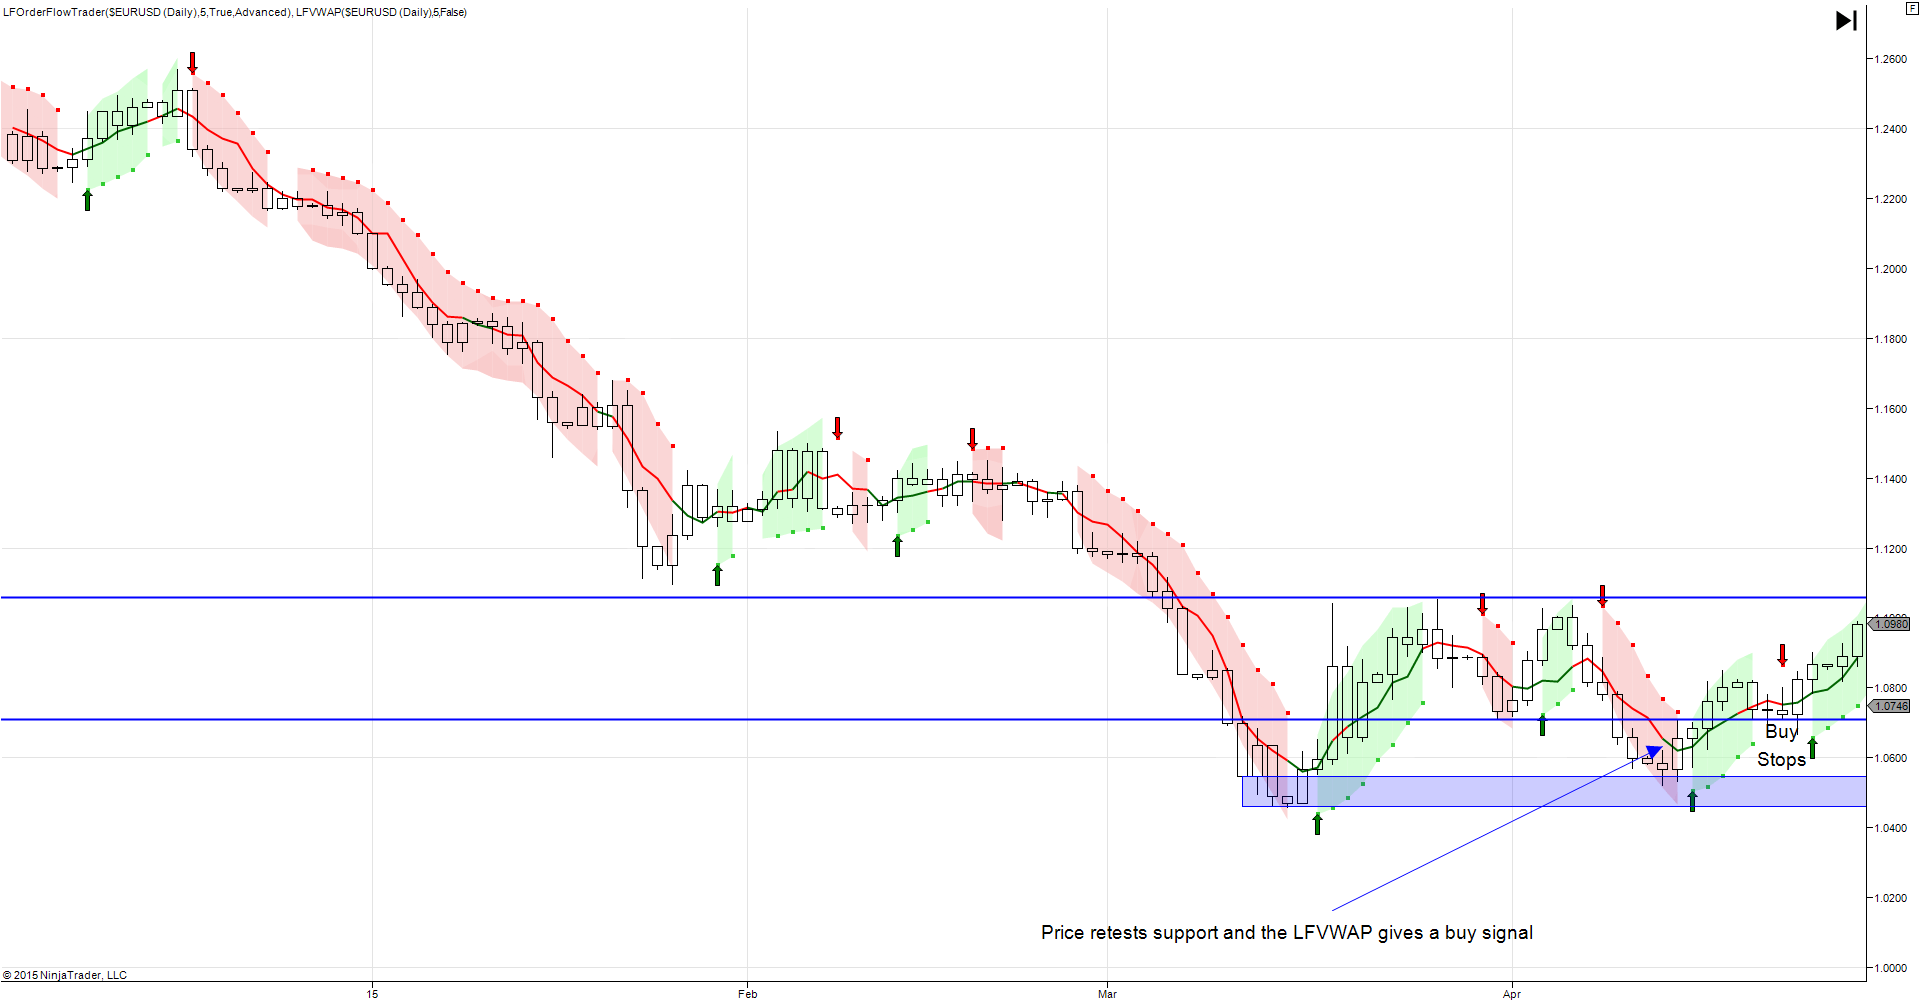
As price tests the resistance level I monitor VWAP and Order Flow trader for reversal signals. Price breaks the resistance zone and pushes higher as such I trail my stops just below the new broken resistance level which should act as support. I then repeat the process highlighting the next upside objective as seen in the chart below.
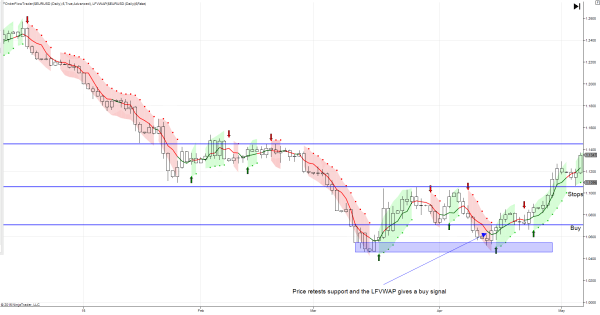
As price tests the next resistance level I once again closely monitor VWAP and Order Flow trader for potential reversal signals. Price tests the resistance level and VWAP flashes a sell signal this is my prompt to trail my stops up to the just below the candle that closes with a sell signals from VWAP.
I use the Order Flow trader trailing stop function to adjust stops giving the trade a chance to breathe but at the same time not giving back too much of the equity I have captured. As I trail my stops the next candle triggers my trailing stops and I exit the remainder of my position.
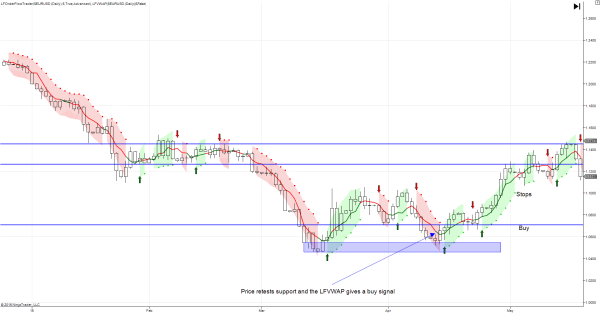
In the trade defined above the combination of the VWAP and Order Flow trader allows me to logically and methodically take advantage of simple support and resistance trading.
This combination strategy allows me to deliver professional risk rewards metrics. Risking 200pips on the initial entry I covered my risk on the trade with the first exit at +200pips the second entry which also had a 200pip risk was exited at a profit of +635pips.
All comments, charts and analysis on this website are purely provided to demonstrate our own personal thoughts and views of the market and should in no way be treated as recommendations or advice. Please do not trade based solely on any information provided within this site, always do your own analysis.
Editors’ Picks

AUD/USD extends the bounce, focus back to 0.7100
AUD/USD adds to Monday’s optimism and approaches the key 0.7100 barrier ahead of the opening bell in Asia. The pair’s positive performance comes as investors keep assessing the hawkish tilt from the RBA Minutes and despite humble gains in the Greenback. Next in Oz will be the Westpac Leading Index and the Wage Price Index.

EUR/USD meets initial support around 1.1800
EUR/USD remains on the back foot, although it has managed to reverse the initial strong pullback toward the 1.1800 region and regain some balance, hovering around the 1.1850 zone as the NA session draws to a close on Tuesday. Moving forward, market participants will now shift their attention to the release of the FOMC Minutes and US hard data on Wednesday.

Gold remains offered below $5,000
Gold stays on the defensive on Tuesday, receding to the sub-$5,000 region per troy ounce on the back of the persistent move higher in the Greenback. The precious metal’s decline is also underpinned by the modest uptick in US Treasury yields across the spectrum.

Ethereum Price Forecast: BitMine extends ETH buying streak, says long-term outlook remains positive
Ethereum (ETH) treasury firm BitMine Immersion continued its weekly purchase of the top altcoin last week after acquiring 45,759 ETH.

UK jobs market weakens, bolstering rate cut hopes
In the UK, the latest jobs report made for difficult reading. Nonetheless, this represents yet another reminder for the Bank of England that they need to act swiftly given the collapse in inflation expected over the coming months.
RECOMMENDED LESSONS
Making money in forex is easy if you know how the bankers trade!
I’m often mystified in my educational forex articles why so many traders struggle to make consistent money out of forex trading. The answer has more to do with what they don’t know than what they do know. After working in investment banks for 20 years many of which were as a Chief trader its second knowledge how to extract cash out of the market.
5 Forex News Events You Need To Know
In the fast moving world of currency markets where huge moves can seemingly come from nowhere, it is extremely important for new traders to learn about the various economic indicators and forex news events and releases that shape the markets. Indeed, quickly getting a handle on which data to look out for, what it means, and how to trade it can see new traders quickly become far more profitable and sets up the road to long term success.
Top 10 Chart Patterns Every Trader Should Know
Chart patterns are one of the most effective trading tools for a trader. They are pure price-action, and form on the basis of underlying buying and selling pressure. Chart patterns have a proven track-record, and traders use them to identify continuation or reversal signals, to open positions and identify price targets.
7 Ways to Avoid Forex Scams
The forex industry is recently seeing more and more scams. Here are 7 ways to avoid losing your money in such scams: Forex scams are becoming frequent. Michael Greenberg reports on luxurious expenses, including a submarine bought from the money taken from forex traders. Here’s another report of a forex fraud. So, how can we avoid falling in such forex scams?
What Are the 10 Fatal Mistakes Traders Make
Trading is exciting. Trading is hard. Trading is extremely hard. Some say that it takes more than 10,000 hours to master. Others believe that trading is the way to quick riches. They might be both wrong. What is important to know that no matter how experienced you are, mistakes will be part of the trading process.
The challenge: Timing the market and trader psychology
Successful trading often comes down to timing – entering and exiting trades at the right moments. Yet timing the market is notoriously difficult, largely because human psychology can derail even the best plans. Two powerful emotions in particular – fear and greed – tend to drive trading decisions off course.

