by Jay Kaeppel
In terms of the total value of all transactions, the forex market has become the largest market in the world. As the economies of countries across the globe become more and more intertwined, the relationship between the currencies of various countries grows in importance. It is this development that continues to drive interest in the forex markets. This article will examine a method to trade forex markets using the Elliott Wave Theory.
The Elliott Wave Theory
The Elliott Wave Theory is a method of analysis developed by Ralph Nelson Elliott (1871-1948) that is based on the theory that, in nature, many things happen in a five-wave pattern. As applied to the financial markets, the assumption is that a given market will advance in a pattern of five waves – three up waves, numbered 1, 3 and 5 - which are separated by two down waves, number 2 and number 4. The theory further holds that each five-wave up-move will be followed by a down-move also consisting of five waves – this time, three down waves, numbered 1, 3 and 5, separated by two up waves numbered two and four.
In addition, the theory holds that each of the countertrend waves – i.e., wave number 2 and number 4 – will unfold in an ABC pattern. In other words, during waves 2 and 4 of a five-wave uptrend, the security in question will retrace part of the wave 1 advance in a pattern consisting of two smaller down waves (labeled A and C) separated by one up wave (labeled B). Likewise, during waves 2 and 4 of a five-wave down-trend, the security in question will retrace part of the wave one decline in a pattern consisting of two smaller up-waves (labeled A and C) separated by one down-wave (labeled B).
In reality, things typically do not unfold in such a neat, clean, and easy to follow five-wave pattern. As a result, many individuals who espouse a belief in Elliott Wave analysis nevertheless end up interpreting the current wave count differently than other adherents. And in fact, it can be argued that the Elliott Wave is as much an art as it is a science, and that various interpretations are to be expected.
As such, one important thing to note is that this article is not so much about how to generate an Elliott Wave count – since so many individuals end up with different interpretations – but rather about how to trade forex markets using the Elliott Wave as the driving force. For the purposes of this article, I will use the Elliott Wave count as generated objectively by ProfitSource source software by Hubb. The software has an automated algorithm for generating and displaying the wave count.
It should be noted that the preferred count can change dramatically from one day to the next based on the built-in algorithm, and that another person or program may arrive at a different interpretation of the wave count and any given point in time. Still the benefit of using this method is that for better or worse, the count is calculated using an objective algorithm and is not open to subjective interpretation.
Laying Out the Steps of a Plan
Before embarking on any trading campaign it is essential to have a plan in place. So let's set up a straightforward plan for using Elliott Wave as a basis for trading forex markets. Here are the steps that we will employ:
- Step 1. Select a method for generating an Elliott Wave count.
This may be based on your own analysis, or via some charting or analysis software. As mentioned, we will use the wave count generated by ProfitSource software by HUBB.
- Step 2. Wait for a wave 5 to begin.
In ProfitSource this occurs when a wave marked as "3" changes to a wave marked as "4" (this actually indicates the end of wave 4 and the start of wave 5). Waiting for this to occur can be the toughest part, for this step can require a great deal of patience. A given single forex market may experience the setup that we are looking for only a few times a year.
- Step 3. Look for confirmation of the trend using another indicator or indicators.
Long Setup Confirmation: Once a wave 3 above the price bar changes to a wave 4 marked below the price bar we will then assess the following indicators to confirm that a long trade should be made:
- 90-day Commodity Channel Index (CCI) is positive (i.e., greater than zero)
- The three-day relative strength index reverses to upside for one day.
These two confirming actions do not have to take place on the day that the wave number changes from 3 to 4. As long as the both occur at some point prior to the wave count being something other than 4, then a confirmation is considered to be in force and we will enter a long trade.
Short Setup Confirmation: Once a wave 3 below the price bar changes to a wave 4 marked above the price bar we will then assess the following indicators to confirm that a short trade should be made:
- 90-day CCI is negative (i.e., greater than zero)
- The three-day RSI reverses to downside for one day
These two confirming actions do not have to take place on the day that the wave number changes from 3 to 4. As long as the both occur at some point prior to the wave count being something other than 4, then a confirmation is considered to be in force and we will enter a short trade.
- Step 4. Identify a reasonable stop-loss point.
For a long setup we will subtract three times the three-day average true range from the low established leading up to the trade as our initial stop-loss point. For a short setup we will add three times the three-day average true range to the high established leading up to the trade, and use this as our initial stop-loss point (See example to follow).
- Step 5. Enter trade and stop-loss order.
We will assume that a trade is entered at the next day's open price. The stop-loss order will also be placed. This order is a trailing stop and we be updated each day that the trade is open.
- Step 6. Consider taking some profits on first good move and trail a stop for the rest of the position.
Trade Exit Plan
1. If stop-loss order is hit then the entire trade is exited.
2. If the three-day RSI reaches 85 or higher for a long trade, or 15 or lower for a short trade, or if the wave count changes from 4 to 5, we will sell half and adjust our trailing stop as follows:
- For a long trade we will use a trailing stop that subtracts one times the three-day average true range from the previous day's low.
- For a short trade we will use a trailing stop that adds one times the three-day average true range to the previous day's high.
3. If the wave count changes to something other than a wave 5, we will simply exit the trade on the next day.
Example Setup and Trade
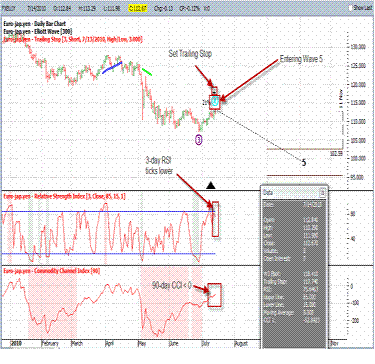
In Figure 1 we see the setup for a short trade. On the most recent trading day, the blue number 4 first appeared above the price bar. Prior to the day, a blue number 3 had appeared below each price bar for the past several days. This suggests that a wave 5 decline may be setting up.
Below the bar chart you can see that the three-day RSI ticked lower on the day and that the 90-day CCI is in negative territory. This confirms the setup and constitutes a sell short signal, so we also calculate our stop-loss price by adding three times the average true range over the last three days to the current day's high price. On the next day the euro/yen cross was sold short at 112.63 and a trailing stop was entered at 117.74.

Figure 1 – A sell short setup for the euro/yen cross is completed.
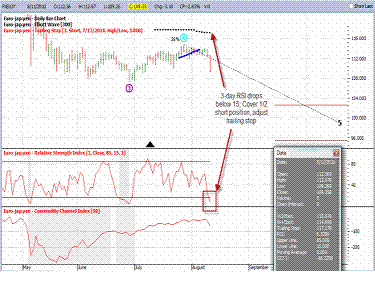
In Figure 2 you can see that roughly a month later the three-day RSI registered a reading below 15. As a result, on the next day we would have bought back half of our position at 109.50 and also adjusted our trailing stop to only one times (rather than three times) the average true range over the past three days added to the current day's high, thus generating a much tighter trailing stop (this tighter stop does not appear until Figure 3).

Figure 2 – Three-day RSI signal profit-taking opportunity; half of short position is covered and trailing stop is tightened.
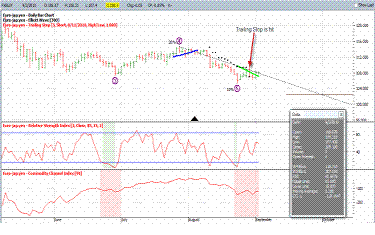
Finally, in Figure 3 you can see that the euro/yen cross worked slightly lower over the next several weeks, but ultimately our trailing stop was hit and the remaining portion of our original short position was closed out at 109.44.

Figure 3 – Trailing top is hit; trade is exited.
Summary
There are many ways to interpret an Elliott Wave count. There are also many methods for entering and exiting trades once a signal is deemed to have occurred. This article serves as an example of just one way to go about performing these tasks. Whatever method one ultimately chooses the keys to successful implementation are to:
- Develop some objective way to interpret the current Elliott Wave count. Consider employing some sort of filter or filters to ensure a valid trading signal.
- Always have a stop-loss point.
- Consider taking profits on the first good move in the expected direction and then letting the rest ride with a trailing stop.
Investopedia does not provide individual or customized legal, tax, or investment services. Since each individual’s situation is unique, a qualified professional should be consulted before making financial decisions. Investopedia makes no guarantees as to the accuracy, thoroughness or quality of the information, which is provided on an “AS-IS” and “AS AVAILABLE” basis at User’s sole risk. The information and investment strategies provided by Investopedia are neither comprehensive nor appropriate for every individual. Some of the information is relevant only in Canada or the U.S., and may not be relevant to or compliant with the laws, regulations or other legal requirements of other countries. It is your responsibility to determine whether, how and to what extent your intended use of the information and services will be technically and legally possible in the areas of the world where you intend to use them. You are advised to verify any information before using it for any personal, financial or business purpose. In addition, the opinions and views expressed in any article on Investopedia are solely those of the author(s) of the article and do not reflect the opinions of Investopedia or its management. The website content and services may be modified at any time by us, without advance notice or reason, and Investopedia shall have no obligation to notify you of any corrections or changes to any website content. All content provided by Investopedia, including articles, charts, data, artwork, logos, graphics, photographs, animation, videos, website design and architecture, audio clips and environments (collectively the "Content"), is the property of Investopedia and is protected by national and international copyright laws. Apart from the licensed rights, website users may not reproduce, publish, translate, merge, sell, distribute, modify or create a derivative work of, the Content, or incorporate the Content in any database or other website, in whole or in part. Copyright © 2010 Investopedia US, a division of ValueClick, Inc. All Rights Reserved
Editors’ Picks

AUD/USD: Further weakness could retest 0.7000
AUD/USD resumes its decline, leaving behind two daily gains in a row and approaching the area of multi-day lows in the 0.7040-0.7030 band ahead of the opening bell in Asia. Moving forward, the Aussie is expected to remain under scrutiny in light of the publication of the jobs report in Australia.

EUR/USD stays well offered below 1.1800
The selling pressure on EUR/USD is picking up pace, with the pair slipping decisively below the key 1.1800 level and sliding to fresh two week lows as Wednesday’s session draws to a close. The move lower comes as the US Dollar finds renewed strength after the latest round of US data and the release of the FOMC Minutes. Next of note on the docket will be the US weekly Initial Jobless Claims.

Gold battle to regain $5,000 continues
Gold is back on the front foot on Wednesday, shaking off part of the early week softness and challenging two-day highs near the $5,000 mark per troy ounce. The move comes ahead of the FOMC Minutes and is unfolding despite an intense rebound in the US Dollar.

Australia unemployment rate set to edge up within overall strong labor market
The Australian monthly employment report is scheduled for release on Thursday at 00:30 GMT, and market participants anticipate a modest increase in jobs in January. The Australian Bureau of Statistics is expected to announce that the country added 20K new jobs in the month, while the Unemployment Rate is forecast at 4.2%, up from the 4.1% posted in December.

Mixed UK inflation data no gamechanger for the Bank of England
Food inflation plunged in January, but service sector price pressure is proving stickier. We continue to expect Bank of England rate cuts in March and June. The latest UK inflation read is a mixed bag for the Bank of England, but we doubt it drastically changes the odds of a March rate cut.
RECOMMENDED LESSONS
Making money in forex is easy if you know how the bankers trade!
I’m often mystified in my educational forex articles why so many traders struggle to make consistent money out of forex trading. The answer has more to do with what they don’t know than what they do know. After working in investment banks for 20 years many of which were as a Chief trader its second knowledge how to extract cash out of the market.
5 Forex News Events You Need To Know
In the fast moving world of currency markets where huge moves can seemingly come from nowhere, it is extremely important for new traders to learn about the various economic indicators and forex news events and releases that shape the markets. Indeed, quickly getting a handle on which data to look out for, what it means, and how to trade it can see new traders quickly become far more profitable and sets up the road to long term success.
Top 10 Chart Patterns Every Trader Should Know
Chart patterns are one of the most effective trading tools for a trader. They are pure price-action, and form on the basis of underlying buying and selling pressure. Chart patterns have a proven track-record, and traders use them to identify continuation or reversal signals, to open positions and identify price targets.
7 Ways to Avoid Forex Scams
The forex industry is recently seeing more and more scams. Here are 7 ways to avoid losing your money in such scams: Forex scams are becoming frequent. Michael Greenberg reports on luxurious expenses, including a submarine bought from the money taken from forex traders. Here’s another report of a forex fraud. So, how can we avoid falling in such forex scams?
What Are the 10 Fatal Mistakes Traders Make
Trading is exciting. Trading is hard. Trading is extremely hard. Some say that it takes more than 10,000 hours to master. Others believe that trading is the way to quick riches. They might be both wrong. What is important to know that no matter how experienced you are, mistakes will be part of the trading process.
The challenge: Timing the market and trader psychology
Successful trading often comes down to timing – entering and exiting trades at the right moments. Yet timing the market is notoriously difficult, largely because human psychology can derail even the best plans. Two powerful emotions in particular – fear and greed – tend to drive trading decisions off course.

