![]() Sam Seiden
Sam Seiden
Independent Analyst
If you are a one timeframe trader, you are standing in front of a tree having no idea what Forest you are in. There are so many things you won’t understand about that tree, where you are at, and what to expect. In trading, one timeframe traders simply can’t compete with those who view and quantify the markets entire supply and demand picture.
Often I hear traders talk about the timeframes they look at when they trade. I hear many different things like “I trade off of a 2 minute chart”, “the daily”, “I like the 466 tick chart”, and so on. When I ask them what other time frames they look at, I can pretty much tell if they are profitable or not and here is how. For those who trade using JUST one time frame, I have yet to see anyone make consistent profits doing that. For those who trade using the smaller time frames and also look at the larger time frames, that is a recipe for profits assuming you do it right.
You may have the best buy setup you have ever seen on a 5 minute chart but if that is anywhere close to supply, that you would only see on a larger time frame, and that buy setup is not likely to work. Conversely, you may have the “picture” of what appears to be a very high probability sell setup on the 30 minute chart but if that is anywhere near demand, that you would only see on a larger time frame, and that trade is not likely to work.
There is another reason to focus on more than just a one time frame or two, trends. Trends begin and end at fresh demand and supply levels. I look at weekly and daily charts each week to identify larger time frame demand and supply level for three reasons:
-
To know where existing trends are likely to end and new ones begin
1.We want to be first in line, at the right time, when the risk/reward is ideal
-
To know what side of the market carries the greatest odds
-
To identify and enter positions, before everyone else does
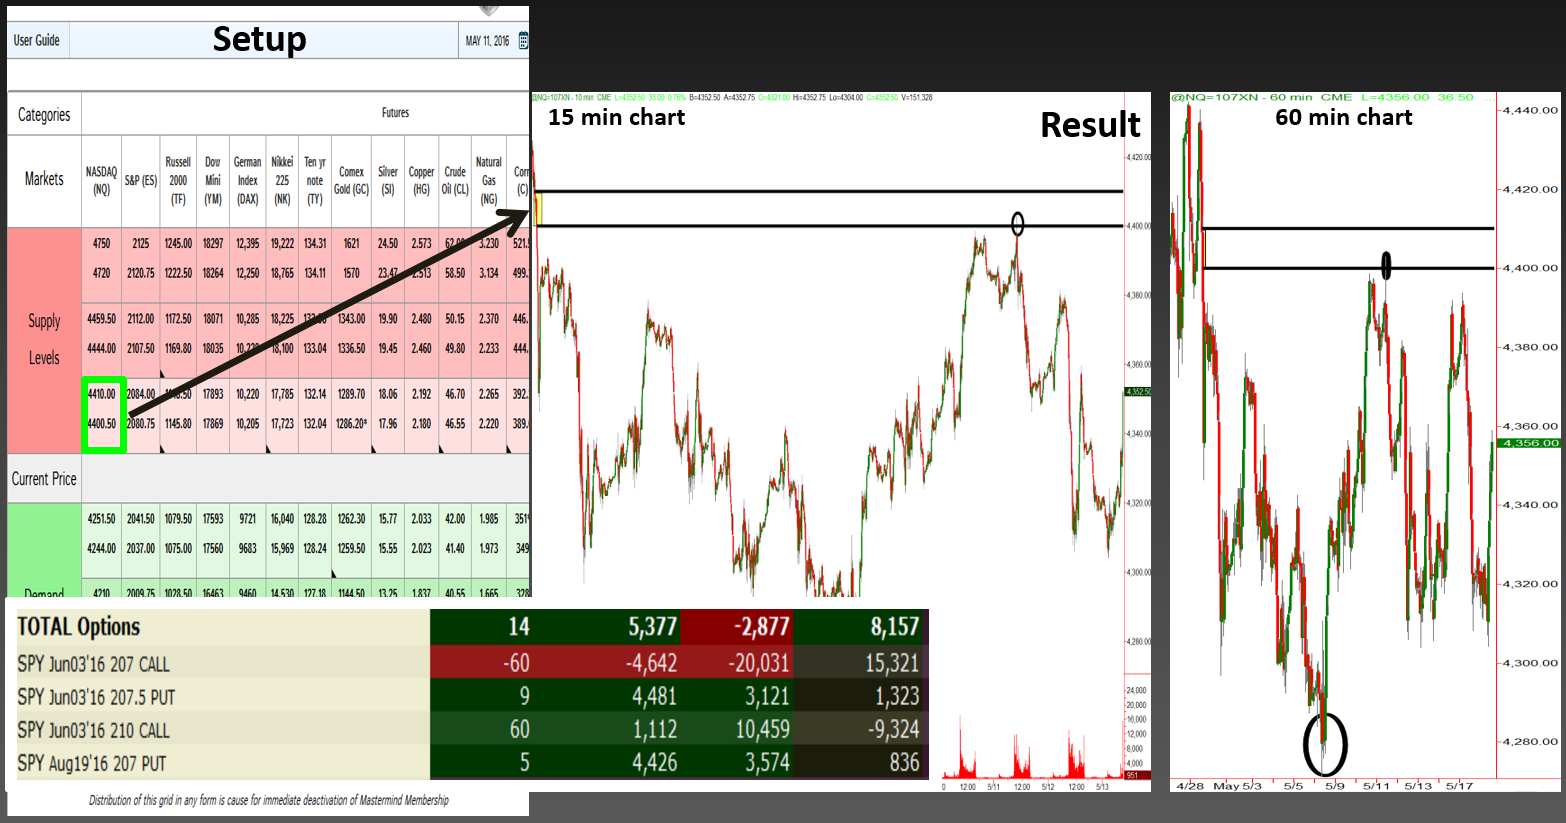
Point number three above has four key words in it that you must understand: before everyone else does. Let’s take a look at a trading opportunity recently identified in the Mastermind Community that used the combination of a large time frame opportunity and small time frame analysis to limit risk and maximize reward. May 11th on the Mastermind Community supply / demand grid, we identified a supply level (bearish opportunity) for our students in the NASDAQ Futures at the 4400.50 – 4410.50 level.
The Opportunity
Let’s look at the daily 60 Min chart of the NASDAQ on the right. The black horizontal lines represent the supply level in the NASDAQ, meaning banks were selling that market in a big way at that level. Next, look at the circle at the bottom of that chart. The fact that price went that low prior to the bearish opportunity means significant demand can’t be above that level. With that information, we know that supply or retail prices are just above and demand or wholesale prices are far below, meaning a decline is coming. Around the time of the move in price back into that level, which is where I put on a bearish position, I heard in newsletters, on TV, in trading rooms and more that the NASDAQ was likely to breakout above those highs, setting the stage for a big rally. The more it became clear to me that everyone was focused on buying, and knowing what a big mistake that was according to the chart, the more I focused on finding a low risk, high reward and high probability entry to make sure we (OTA traders) could sell into this market, well before everyone else did. A bearish position, like the one below, that I took with options at our supply level combined with the precise entry found on the 15 minute chart offered a very low risk entry to bet on the downside and a key opportunity to enter into the market well before the group of retail traders and investors.
Supply/Demand Grid Passive Income Trade: May 11, 2016
The key to making this happen was properly combining larger time and smaller time frame supply and demand analysis to accomplish these two important goals, entering a bearish position before everyone else did and doing it with a very low risk entry. Furthermore, notice the trade was taken using SPY options. Along with using multiple times frames to gain a significant edge in the markets, I also utilize multiple asset classes. With this opportunity, I liked the prices I was getting in the SPY more than the QQQ. For this trade, I combined Futures, ETF’s and Options, along with multiple time frames. While this may seem complicated, it actually makes things much easier. What is very hard to do is accomplish consistent results using one time frame and one market. Make sure you know what forest you’re in, it will make your experience with the trees much better…
Hope this was helpful, have a good day…

Note: All information on this page is subject to change. The use of this website constitutes acceptance of our user agreement. Please read our privacy policy and legal disclaimer. Opinions expressed at FXstreet.com are those of the individual authors and do not necessarily represent the opinion of FXstreet.com or its management. Risk Disclosure: Trading foreign exchange on margin carries a high level of risk, and may not be suitable for all investors. The high degree of leverage can work against you as well as for you. Before deciding to invest in foreign exchange you should carefully consider your investment objectives, level of experience, and risk appetite. The possibility exists that you could sustain a loss of some or all of your initial investment and therefore you should not invest money that you cannot afford to lose. You should be aware of all the risks associated with foreign exchange trading, and seek advice from an independent financial advisor if you have any doubts.
Editors’ Picks

EUR/USD trims losses, flirts with the 1.1850 zone
EUR/USD is back on the back foot on Wednesday, slipping below the 1.1850 area as the US Dollar picks up some modest traction. The move comes as traders position ahead of a busy run of US data and the release of the FOMC Minutes. Adding to the pullback are reports that the ECB’s Lagarde may step down before completing her term.

GBP/USD flirts with daily highs near 1.3580
GBP/USD manages to set aside two consecutive daily declines and trades with slight gains in the 1.3580 zone on Wednesday. Cable’s uptick comes despite acceptable gains in the Greenback and easing UK inflation figures, which seem to have reinforced the case for a BoE rate cut in March.

USD/JPY price continues to hold key support level around 152.00
The USD/JPY pair trades 0.27% higher to near 153.70 during the European trading session on Wednesday. The pair gains as the Japanese Yen underperforms its major peers on expectations that Japan’s Prime Minister Sanae Takaichi will announce big spending plans in the fiscal budget to boost economic growth. Theoretically, a higher fiscal deficit weakens the appeal of the domestic currency.
Editors’ Picks
EUR/USD trims losses, flirts with the 1.1850 zone
EUR/USD is back on the back foot on Wednesday, slipping below the 1.1850 area as the US Dollar picks up some modest traction. The move comes as traders position ahead of a busy run of US data and the release of the FOMC Minutes. Adding to the pullback are reports that the ECB’s Lagarde may step down before completing her term.
GBP/USD flirts with daily highs near 1.3580
GBP/USD manages to set aside two consecutive daily declines and trades with slight gains in the 1.3580 zone on Wednesday. Cable’s uptick comes despite acceptable gains in the Greenback and easing UK inflation figures, which seem to have reinforced the case for a BoE rate cut in March.

Gold regains some shine, retargets $5,000 ahead of FOMC Minutes
Gold gathers fresh upside traction on Wednesday, leaving part of the weakness seen at the beginning of the week and refocusing its attention to the key $5,000 mark per troy ounce, all ahead of the release of the FOMC Minutes and despite the modest uptick in the US Dollar.

Pi Network rally defies market pressure ahead of its first anniversary
Pi Network is trading above $0.1900 at press time on Wednesday, extending the weekly gains by nearly 8% so far. The steady recovery is supported by a short-term pause in mainnet migration, which reduces pressure on the PI token supply for Centralized Exchanges. The technical outlook focuses on the $0.1919 resistance as bullish momentum increases.

Mixed UK inflation data no gamechanger for the Bank of England
Food inflation plunged in January, but service sector price pressure is proving stickier. We continue to expect Bank of England rate cuts in March and June. The latest UK inflation read is a mixed bag for the Bank of England, but we doubt it drastically changes the odds of a March rate cut.
RECOMMENDED LESSONS
Making money in forex is easy if you know how the bankers trade!
I’m often mystified in my educational forex articles why so many traders struggle to make consistent money out of forex trading. The answer has more to do with what they don’t know than what they do know. After working in investment banks for 20 years many of which were as a Chief trader its second knowledge how to extract cash out of the market.
5 Forex News Events You Need To Know
In the fast moving world of currency markets where huge moves can seemingly come from nowhere, it is extremely important for new traders to learn about the various economic indicators and forex news events and releases that shape the markets. Indeed, quickly getting a handle on which data to look out for, what it means, and how to trade it can see new traders quickly become far more profitable and sets up the road to long term success.
Top 10 Chart Patterns Every Trader Should Know
Chart patterns are one of the most effective trading tools for a trader. They are pure price-action, and form on the basis of underlying buying and selling pressure. Chart patterns have a proven track-record, and traders use them to identify continuation or reversal signals, to open positions and identify price targets.
7 Ways to Avoid Forex Scams
The forex industry is recently seeing more and more scams. Here are 7 ways to avoid losing your money in such scams: Forex scams are becoming frequent. Michael Greenberg reports on luxurious expenses, including a submarine bought from the money taken from forex traders. Here’s another report of a forex fraud. So, how can we avoid falling in such forex scams?
What Are the 10 Fatal Mistakes Traders Make
Trading is exciting. Trading is hard. Trading is extremely hard. Some say that it takes more than 10,000 hours to master. Others believe that trading is the way to quick riches. They might be both wrong. What is important to know that no matter how experienced you are, mistakes will be part of the trading process.
The challenge: Timing the market and trader psychology
Successful trading often comes down to timing – entering and exiting trades at the right moments. Yet timing the market is notoriously difficult, largely because human psychology can derail even the best plans. Two powerful emotions in particular – fear and greed – tend to drive trading decisions off course.