![]() Sam Seiden
Sam Seiden
Independent Analyst
Before starting my career at the Chicago Mercantile Exchange, I did two things and really two things only. I played ice hockey and went to school where the focus of my studies was Biology and Genetics. I know what you’re thinking, how boring… Well, I actually was and am still fascinated with the study of life so I really enjoyed those days. Around every corner of Biology, Chemistry, Genetics and so on is another mathematical equation. After diving into this field, I quickly realized that though there were so many equations, the underlying goal of most of these equations were to quantify the forces of “change”, “action” or “energy”. So, one could argue that all these equations were really different variations of the same thing. For my simple mind, everything came down to Newton’s simple concept of “motion into mass”. Whether I was figuring out the concept of splitting a cell or how an earthquake happens, the underlying equation was quantifying motion into mass.
Knowing absolutely nothing about trading and economics when I started on the floor of the Chicago Mercantile Exchange, my first thought was that I now had to learn a whole new subject because my prior schooling and experience had nothing to do with trading and economics. How wrong I was! Within a few weeks of working on the exchange floor, facilitating institutional order flow, all I saw was “motion into mass”, everywhere. The only difference was that quantifying it in the markets was easier than what I had learned in the science books. In the trading markets, the “Mass” is the buy and sell orders, or what I prefer to call Demand and Supply. At price levels where demand exceeded supply, price rises. At price levels where supply exceeded demand, price declines. “Motion” of price is in between the supply and demand levels. We enter and exit positions at these levels and get paid in between. My “edge” in trading is that I learned to see this on a price chart long before I ever heard anything about conventional “technical analysis”. The focus of today’s piece is to share a recent trade with you and illustrate this concept of simple motion into mass. The goal is that this nugget of information can help you whether you are a short term income trader or longer term investor.
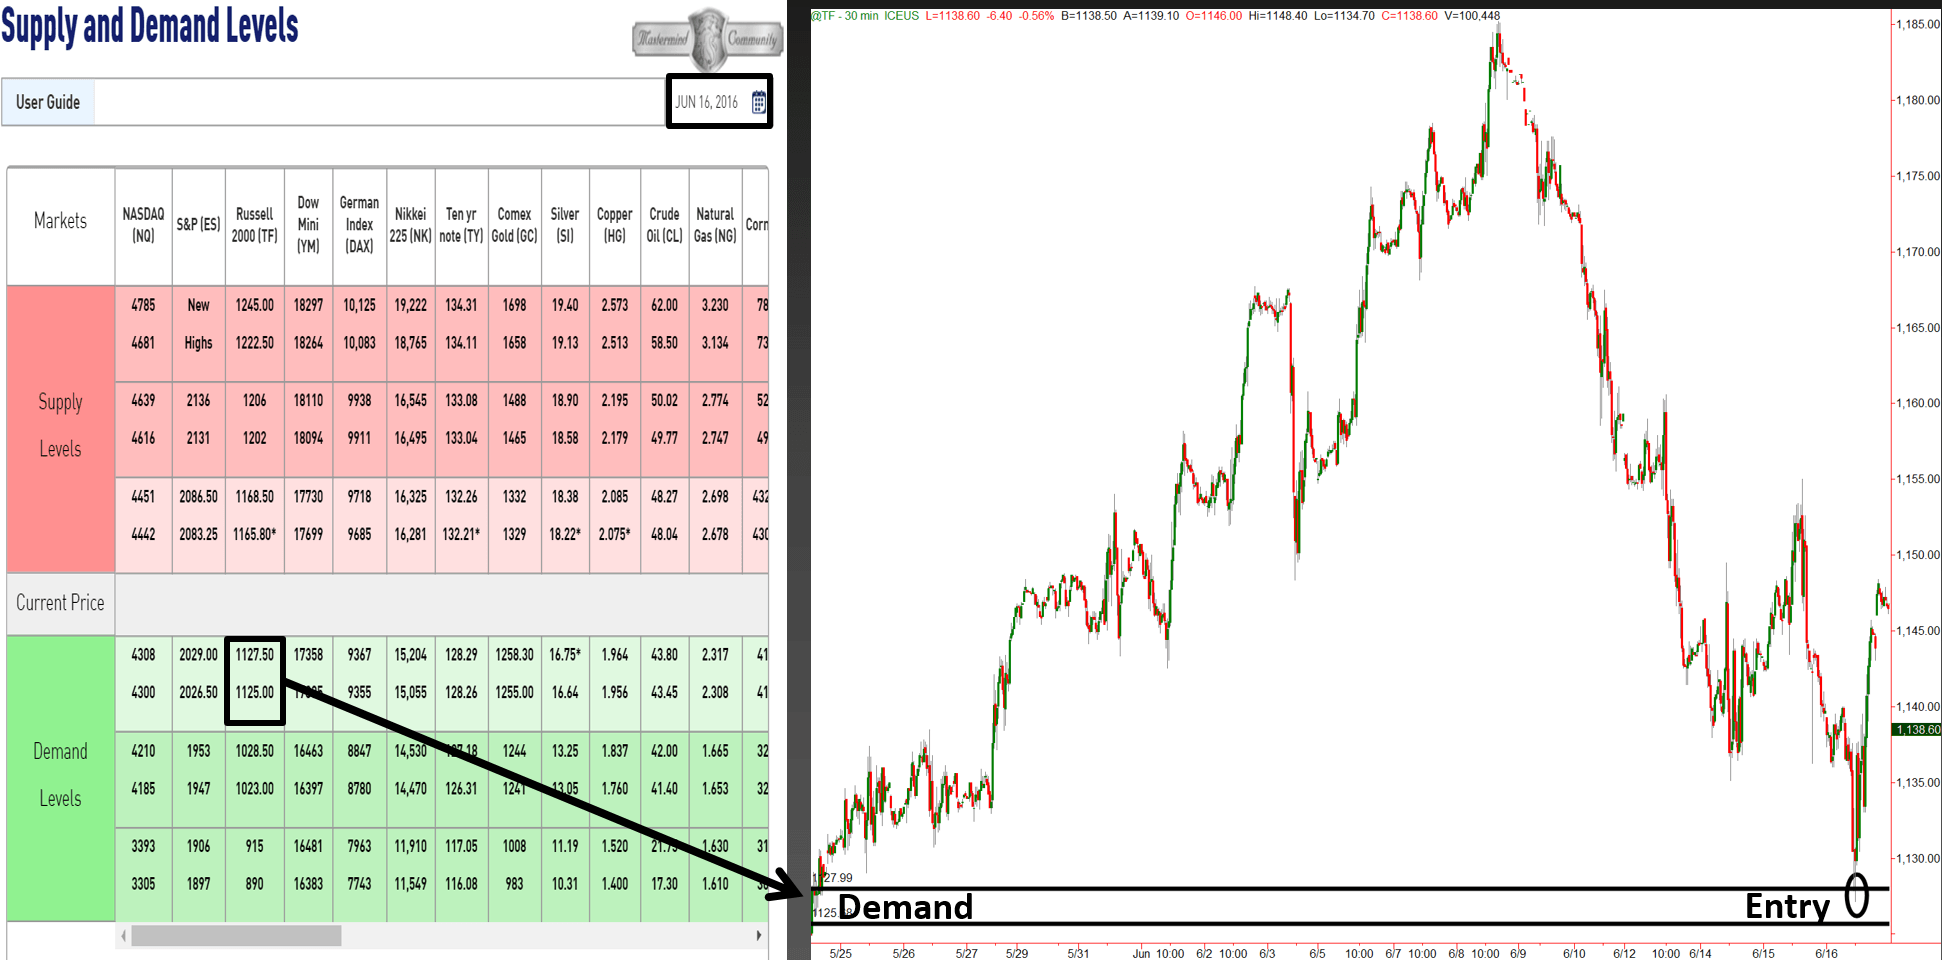
Well before the Stock Market opened (last week), we suggested on our Supply Demand Grid that the market was near demand and likely to rally a bit that day. The opportunity was to buy the Russell Futures in the demand zone provided (1125 – 1127.50) for an active income trade. The day of the trade last week was a very volatile day with some news. The key to profitable trading that day or any day was to focus on where the real demand and supply was in the market. In the morning, the Russell fell quickly as you can see from the chart above. The drop in price and news invited many in to sell. That forced price down to a level where there was enough demand to match the amount of supply that was coming into the market which is why price stopped falling. The demand zone is over the lower left portion of the chart. The opportunity was to buy when price declined back to that level because it was low risk, high reward and very high probability. Price turned at our demand zone and the rally continued that day until it reached a price level where supply exceeded demand, as that is what always happens in a market. Note that the demand level is best seen on a smaller time frame than I am showing here.
The most important piece of information you can take from this is to understand that there are two ways to think trading and markets.You can focus on the news and conventional trend analysis and sell near the low and buy near the high. Or, you can focus on the reality of how you make money buying and selling anything. You see, if I were to call demand “wholesale” and supply “retail”, I’m sure you would start to think different because we all want to buy at wholesale prices and sell at retail prices in every other part of our life. That is actually 100% how you need to think about the trading markets because the truth is, there is no difference between the proper buying and selling action you take when trading vs. the proper buying and selling action you take when buying and selling anything in life. The trading industry guides people to think there is a big difference and leads people down the thinking path of conventional fundamental and conventional technical analysis, but that is a big trap.
The information in this piece may seem a bit repetitious but the purpose of that is to help you understand how the markets work and one way of attaining low risk, high reward, and high probability profits when speculating in markets.
Hope this was helpful, have a great day.
Note: All information on this page is subject to change. The use of this website constitutes acceptance of our user agreement. Please read our privacy policy and legal disclaimer. Opinions expressed at FXstreet.com are those of the individual authors and do not necessarily represent the opinion of FXstreet.com or its management. Risk Disclosure: Trading foreign exchange on margin carries a high level of risk, and may not be suitable for all investors. The high degree of leverage can work against you as well as for you. Before deciding to invest in foreign exchange you should carefully consider your investment objectives, level of experience, and risk appetite. The possibility exists that you could sustain a loss of some or all of your initial investment and therefore you should not invest money that you cannot afford to lose. You should be aware of all the risks associated with foreign exchange trading, and seek advice from an independent financial advisor if you have any doubts.
Editors’ Picks

EUR/USD ticks higher to near 1.1800 ahead of German inflation data
EUR/USD trades marginally higher to near 1.1800 in the European session on Friday, helped by renewed US Dollar weakness. Attention now turns toward the release of the preliminary inflation data for February from Germany and its major states during the day.

GBP/USD struggles near 1.3500 amid UK political drama, BoE easing bias
GBP/USD struggles to build on the overnight modest bounce from the weekly low and oscillates in a narrow band near 1.3500 in European trading on Friday. The Gorton and Denton by-election, held on February 26, has become a focal point of political drama in the UK, along with the Bank of England (BoE) easing expectations, acts as a headwind for the British Pound and the GBP/USD pair.

USD/JPY falls back below 156.00 as Tokyo CPI backs BoJ's hawkish outlook
USD/JPY attracts fresh sellers for the second straight day following the release of Tokyo CPI, which grew slightly more than expected in February. This comes on top of hawkish comments by BoJ officials and backs the case for further policy tightening, providing a modest lift to the Japanese Yen. Apart from this, sustained safe-haven buying, amid trade-related uncertainties and geopolitical tensions, benefits the JPY's safe-haven status. However, reduced Fed rate cut bets underpin the US Dollar and could help limit losses for the currency pair.
Editors’ Picks
EUR/USD ticks higher to near 1.1800 ahead of German inflation data
EUR/USD trades marginally higher to near 1.1800 in the European session on Friday, helped by renewed US Dollar weakness. Attention now turns toward the release of the preliminary inflation data for February from Germany and its major states during the day.
GBP/USD struggles near 1.3500 amid UK political drama, BoE easing bias
GBP/USD struggles to build on the overnight modest bounce from the weekly low and oscillates in a narrow band near 1.3500 in European trading on Friday. The Gorton and Denton by-election, held on February 26, has become a focal point of political drama in the UK, along with the Bank of England (BoE) easing expectations, acts as a headwind for the British Pound and the GBP/USD pair.

Gold sticks to positive bias as safe-haven demand persists; $5,200 holds the key for bulls
Gold trades with positive bias for the third straight day on Friday, with bulls still awaiting sustained strength and acceptance above the $5,200 mark before positioning for any further gains. Geopolitical risks remain in play amid a large US naval and air power buildup in the Middle East.

Bitcoin, Ethereum and Ripple consolidate with short-term cautious bullish bias
Bitcoin, Ethereum and Ripple are consolidating near key technical areas on Friday, showing mild signs of stabilization after recent volatility. BTC holds above $67,000 despite mild losses so far this week, while ETH hovers around $2,000 after a rejection near its upper consolidation boundary.

Changing the game: International implications of recent tariff developments
The Supreme Court ruling on International Emergency Economic Powers Act (IEEPA) tariffs provides limited relief for the rest of the world, with weighted average tariff rates modestly lower.
RECOMMENDED LESSONS
Making money in forex is easy if you know how the bankers trade!
I’m often mystified in my educational forex articles why so many traders struggle to make consistent money out of forex trading. The answer has more to do with what they don’t know than what they do know. After working in investment banks for 20 years many of which were as a Chief trader its second knowledge how to extract cash out of the market.
5 Forex News Events You Need To Know
In the fast moving world of currency markets where huge moves can seemingly come from nowhere, it is extremely important for new traders to learn about the various economic indicators and forex news events and releases that shape the markets. Indeed, quickly getting a handle on which data to look out for, what it means, and how to trade it can see new traders quickly become far more profitable and sets up the road to long term success.
Top 10 Chart Patterns Every Trader Should Know
Chart patterns are one of the most effective trading tools for a trader. They are pure price-action, and form on the basis of underlying buying and selling pressure. Chart patterns have a proven track-record, and traders use them to identify continuation or reversal signals, to open positions and identify price targets.
7 Ways to Avoid Forex Scams
The forex industry is recently seeing more and more scams. Here are 7 ways to avoid losing your money in such scams: Forex scams are becoming frequent. Michael Greenberg reports on luxurious expenses, including a submarine bought from the money taken from forex traders. Here’s another report of a forex fraud. So, how can we avoid falling in such forex scams?
What Are the 10 Fatal Mistakes Traders Make
Trading is exciting. Trading is hard. Trading is extremely hard. Some say that it takes more than 10,000 hours to master. Others believe that trading is the way to quick riches. They might be both wrong. What is important to know that no matter how experienced you are, mistakes will be part of the trading process.
The challenge: Timing the market and trader psychology
Successful trading often comes down to timing – entering and exiting trades at the right moments. Yet timing the market is notoriously difficult, largely because human psychology can derail even the best plans. Two powerful emotions in particular – fear and greed – tend to drive trading decisions off course.