For a lot of new traders the big focus is often the question of “where do I enter the market?” and whilst it’s true that getting in at the right time is key, it is not the be-all and end-all of trading. Any experienced trader will tell you that knowing where to put your stops and how to set your profit targets is just as important, if not more so, than knowing when to enter.
Many times traders will find themselves entering a position expecting a certain move to occur, only for price to move against them and stop them out before reversing and moving in their favour. Similarly many traders will have experienced price coming tantalisingly close to their profit target, only to reverse and move all the back against them.
Now this is not to say that experienced traders don’t still suffer these occurrences from time to time, but they key thing is making your trade execution and management so that these occurrences are rare events rather than regular features in your trading career.
Below we take a look at some of the best stop loss methods and profit targets.
Stop loss methods
1 – Using 20 day ATR.
The average true range of a currency pair is a vital bit of information to have to hand when trading, but something that a lot of traders can overlook, especially those trading lower timeframes. If I am entering a short position at 1.1050 in EURUSD and i place my stop arbitrarily above at say 1.1080 because 30 pips is nice low risk and it won’t affect my balance too much if I lose, well that’s all fine, but then considering that the 20 day ATR is 150 pips how likely is it that my 30 pip stop gets hit? very likely! So that “low risk” trade taken over and over again presents a high risk situation because the probability of getting stopped is so high.
Using the 20 day ATR gives me the average true range of the currency pair over the last 20 days and a 20 year test has shown that price stays within the 20 day ATR 80% of the time, so I know that if my stop is at least the 20 day ATR I am pretty safe.
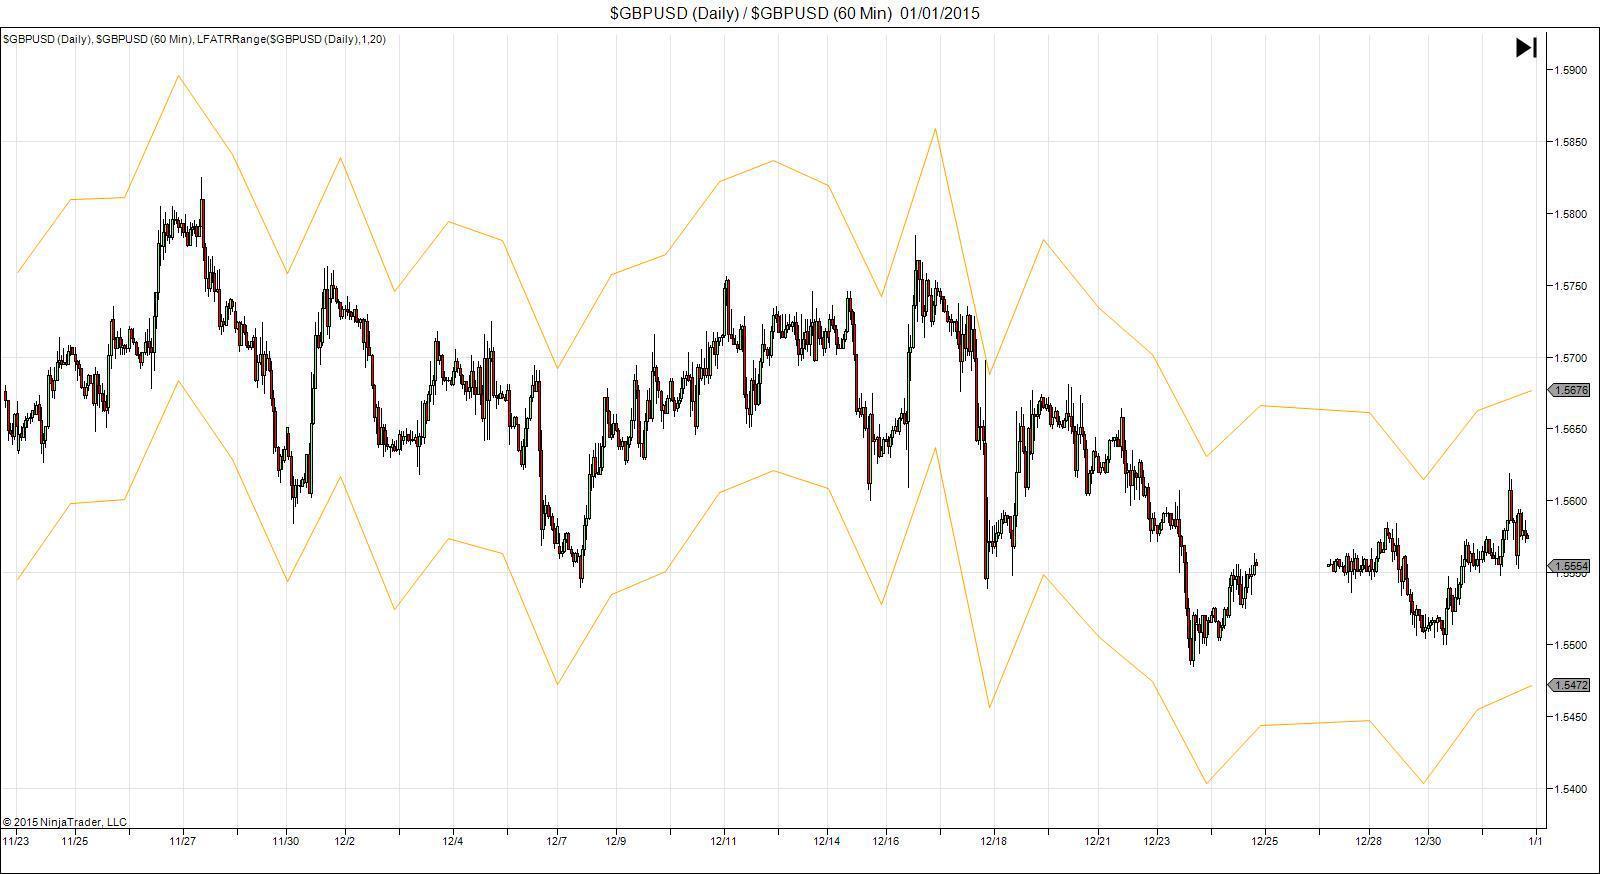
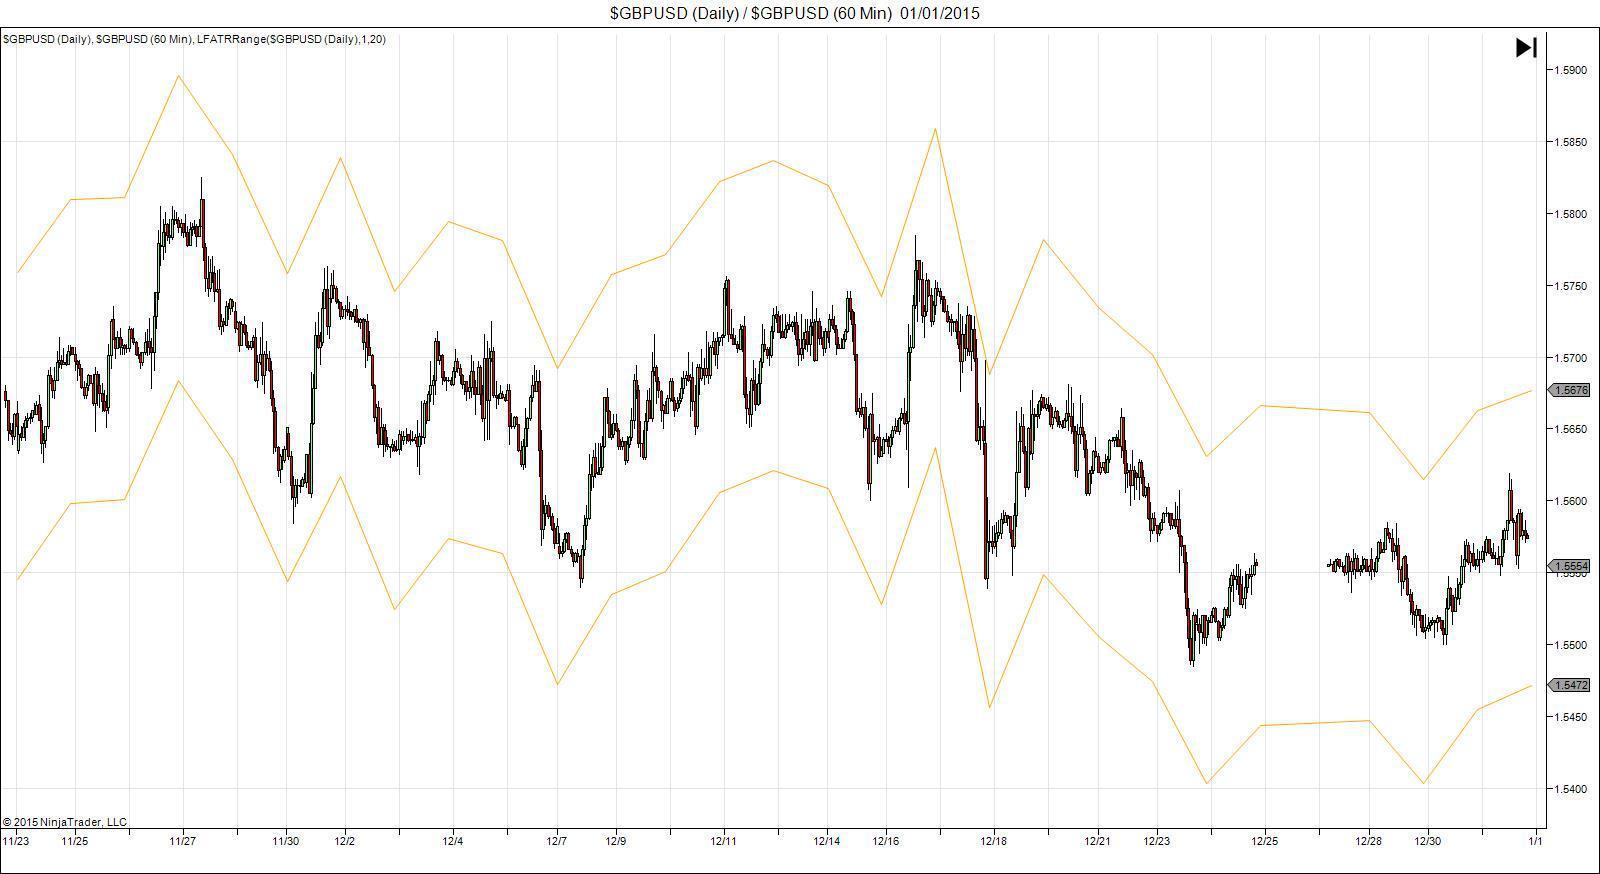
To make it even easier to use the ATR in your trading we’ve developed a tool called ATR Boundaries which actually plots the ATR on your chart with an upper and lower band making it even simpler to use as a reference for stop placement. See the image below which shows GBPUSD 60 minute price with 20 day ATR Boundaries plotted on.
2 – Using volume profile
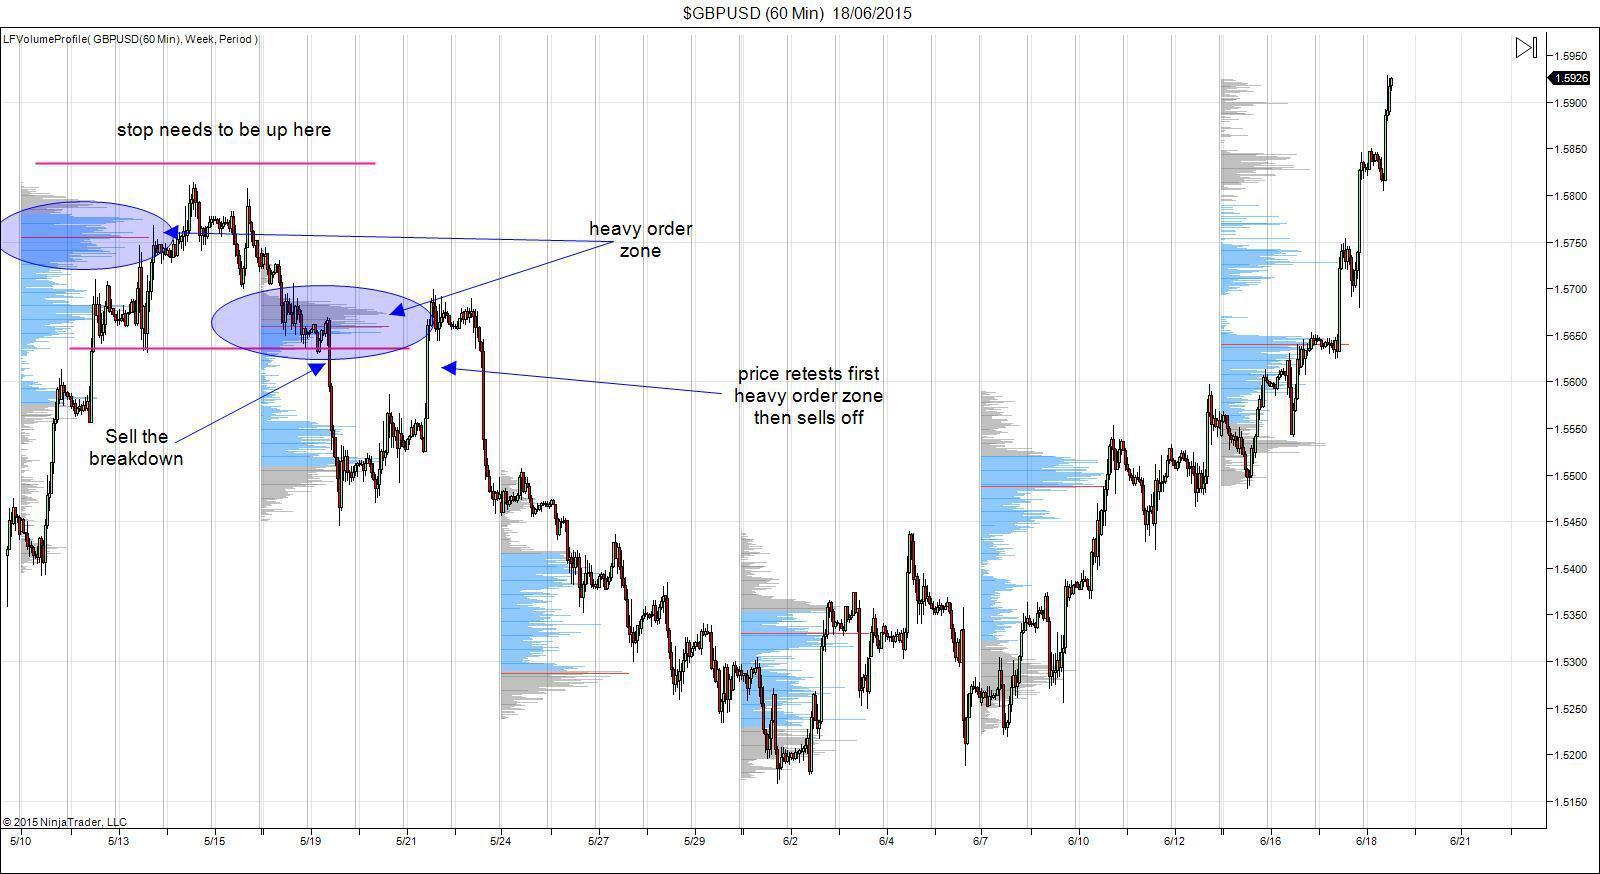
One of the cruellest fates to suffer as a trader is that of being stopped out before price moves in your anticipated direction and goes on to hit what would have been your profit target. This is because your stop is too tight. We say this a lot – “stops are too tight!” but what does this actually mean? Well, the ATR example above is one way in which stops can be too tight, another is too tight relative to the local orders in the markets. Orders are after all what drive the markets and move the price on our screens so knowing where the key orders are in the market is powerful information to have and that is where Volume Profile comes in. Volume Profile plots the profile of orders in the market for that session showing you where the most orders are (red line), where 70% of volume traded (blue area) and where low volume areas are (grey areas) and is an incredibly useful tool to include in your stop loss analysis.
We want to always make sure that our stop loss levels are safely behind the local heavy order zones as we know price is likely to be drawn to these levels, even if our trade direction is correct, price can move against us, re-testing order zones before moving in our direction. See the example below.
3 – Using market structure
Structure based stops are a great way to set stop losses and teach traders to really learn how to assess the market technically. One of the key things a trader should consider when setting stop losses is where the important local levels are in the market. This ties in with the Volume Profile method above and can essentially be combined as the two will often be in sync. It’s incredibly important to take structure into account as key support and resistance levels are one of the big areas where traders get caught out.
In the example below we see a great bullish pin bar at a triple bottom (3rd test of key support level) and so we go ahead and buy as price trades higher from the pin bar with our stop just below the bar. Price moves nicely in our favour initially then rips back against us and drops down below the level, taking our stop before reversing and trading much, much higher.
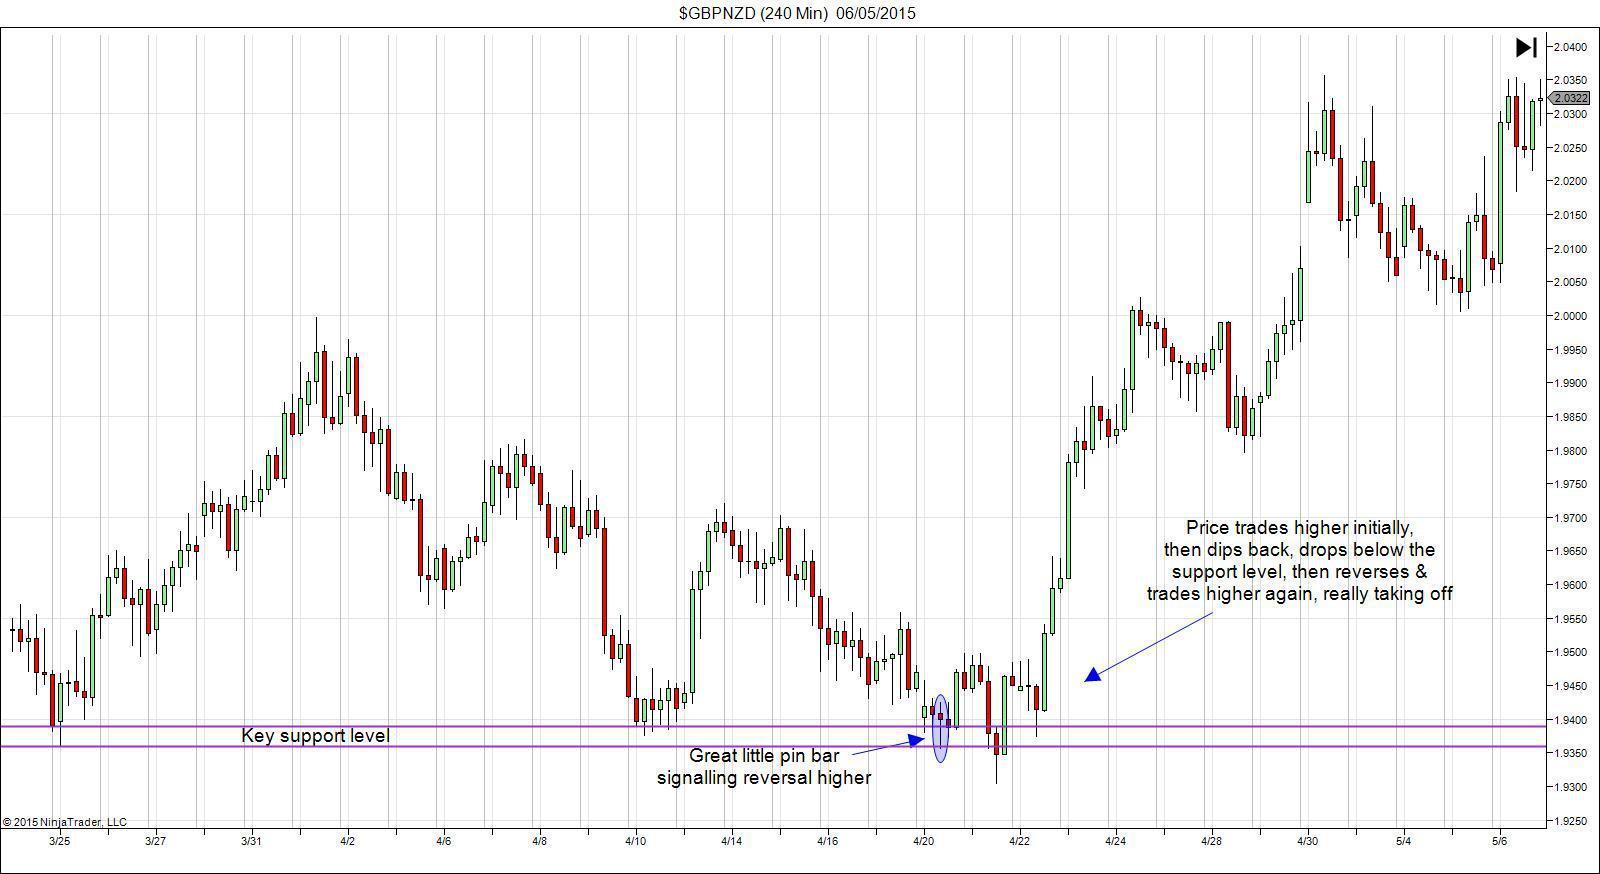
So what happened? key support levels like this generate a lot of order flow and interest and big players know that anyone buying that area will likely have a stop very close below (retail traders generally have tight stops because they don’t like the idea of “wide stops”) and so they push price down into all that liquidity just below the level. So the key thing here is not just to have your stop placed at the structure level but to have some room between the level and your stop to allow for this type of action and ensure you aren’t one of the many having your “stops hunted”.
Profit targets
1 – Using 20 day ATR
Knowing the average true range of a currency pair doesn’t just help us place stops, it is also a fantastic way of placing profit targets, or knowing when is a good time to exit a winning trade. This is more appropriate for lower timeframe trades as we are focusing on Daily price movements. We also need to use the ATR slightly differently as a profit target tool. If we know that price stays within the 20 day ATR 80% of the time then we don’t want to set our target directly at the 20 day level, we want to set it inside the level so we know there is still a good chance of it being hit. Another way to use it, is slightly more dynamic and that is to use the ATR as a reference for judging current price action.
If I am in a long trade which is up 90 pips and the 20 day ATR is 125 pips then I know I’m coming into the top end of what can be reasonably expected for price to achieve to the upside that day, and I know that a reversal is likely, so if i see RSI diverging in this area, I can exit, or if I see price form a pin bar counter to my trade, I can exit. This is a great way of securing winners which otherwise might reverse on you and is a really great tool to have in use. Again our ATR Boundaries tool makes it even easier to use the ATR as a guide for profit targets
2 – Using volume profile
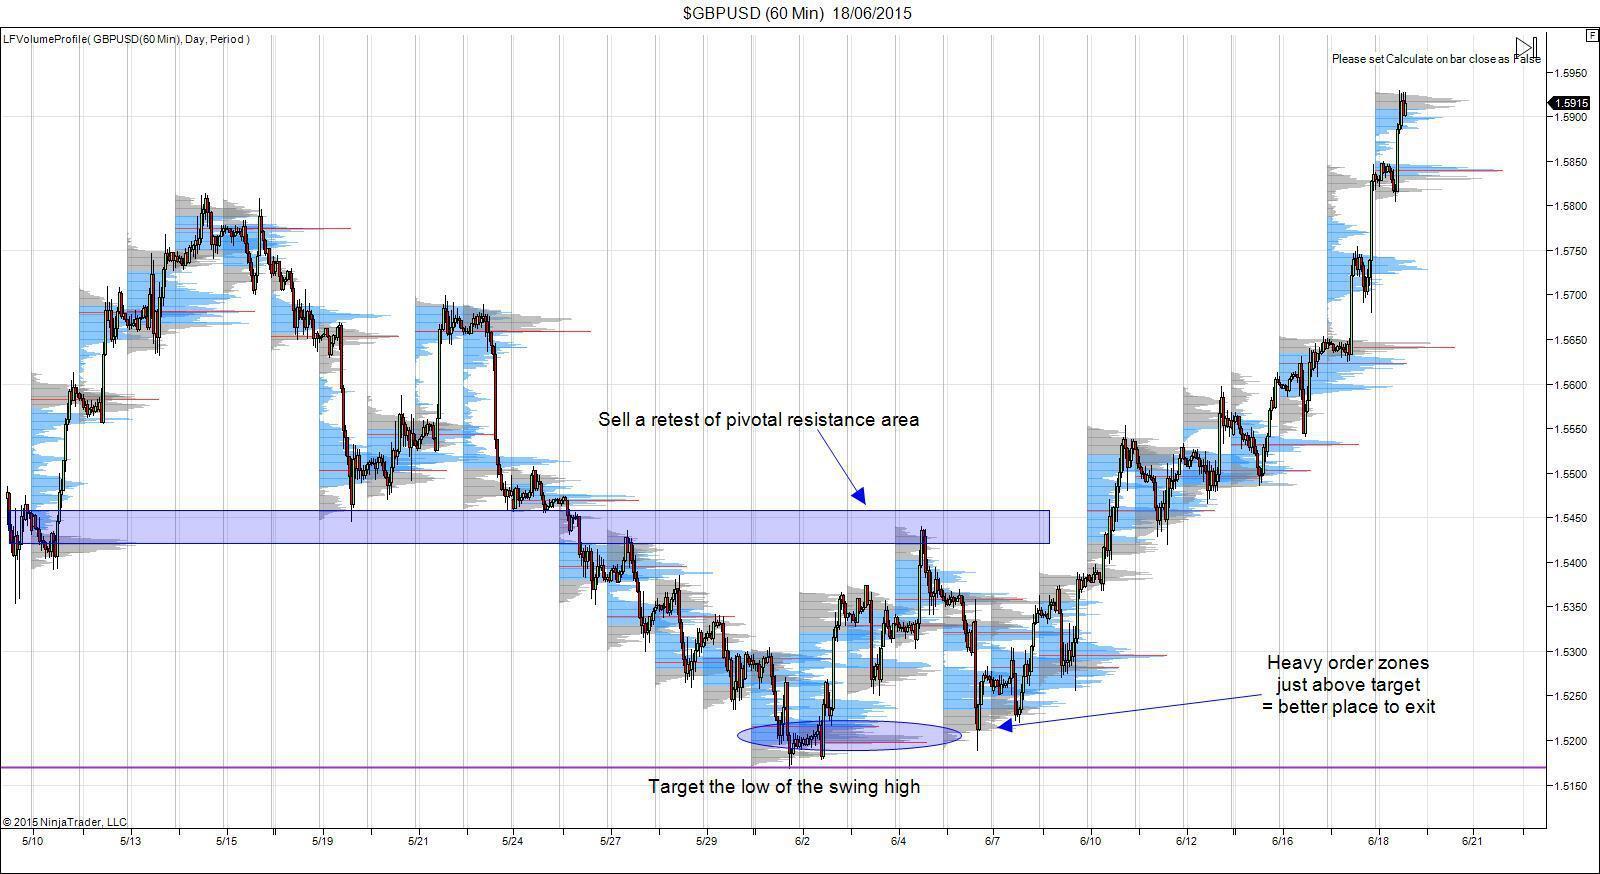
As with ATR, Volume Profile isn’t just useful as a guide for stop loss placement it is also incredibly effective at helping us judge where to take profit. One of the most irritating things that can happen whilst trading is to see price near your profit target only for it to reverse against you and go all the way back to break-even or worse.
Reading Volume Profile charts can help guard against this issue by showing you the areas where price is likely to reverse. Now this isn’t to say that price won’t run through these zones and hit structural targets but just that over a long run period, price will reverse from these key order areas more than enough times to justify their use as a profit target.
In the example below we can see that we had heavy orders just ahead of our profit target and so as price stalled there we knew it was better to exit there then hold for the full target as price is likely to reverse from these key order areas.
3 – Using order flow signals
Instead of structural targets, as we highlighted above why these aren’t always the best method to use for placing targets, I thought I’d show you just how useful Order Flow Trader can be in taking profit.
Order Flow Trader maps the flow and volume of Banks & Institutions in the markets and gives some brilliant trading signals based on their activity. Now you can take these signals as a stand alone system and you’ll do really well but even if you look to incorporate the signals into a method you already use they can be incredibly useful for highlighting shifting activity in the markets and giving you a heads-up when a move in price is likely to end and indeed reverse.
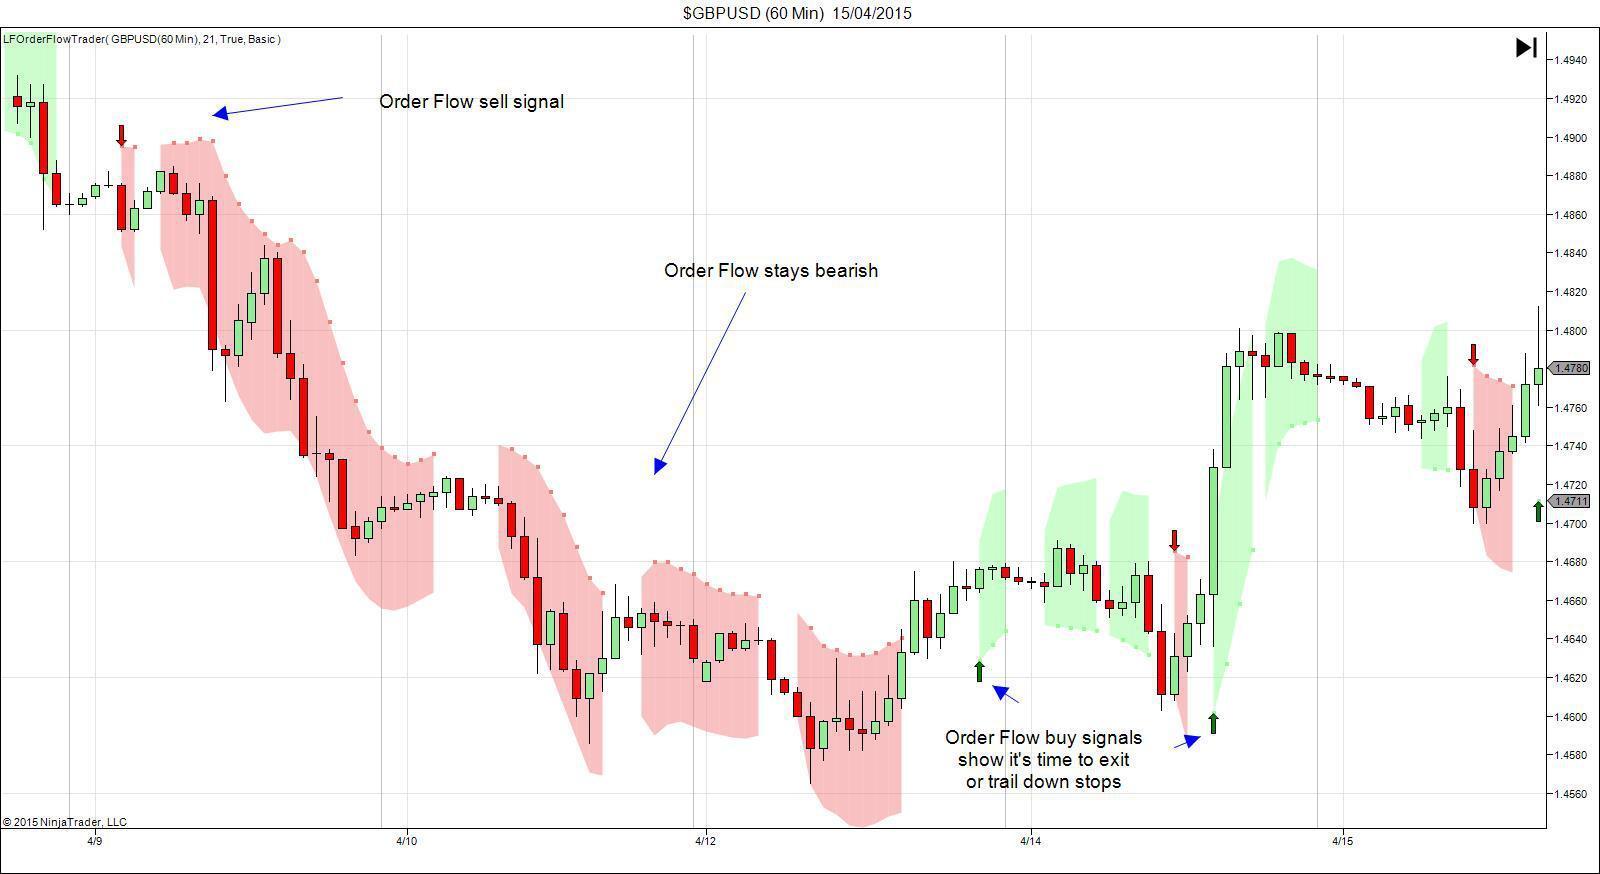
In the example below we can see that after a nice bearish move, price starts to range at lows and then we see Order Flow Trader buy signals flagging a likely reversal in price.At this point it is prudent to exit our short trade or at least trail our stop down to lock in majority of profits.
What is a trailing stop?
A trailing stop is a method used to protect profits on profitable positions from a retracement. So in the image above, if we are short from the sell signal at highs, as price sells off in our favour, we would simply lower our stop as the market moves to lock in more profit should price reverse against us.
This market forecast is for general information only. It is not an investment advice or a solution to buy or sell securities.
Authors' opinions do not represent the ones of Orbex and its associates. Terms and Conditions and the Privacy Policy apply.
Trading foreign exchange on margin carries a high level of risk, and may not be suitable for all investors. Before deciding to trade foreign exchange, you should carefully consider your investment objectives, level of experience, and risk appetite. There is a possibility that you may sustain a loss of some or all of your investment and therefore you should not invest money that you cannot afford to lose. You should be aware of all the risks associated with foreign exchange trading, and seek advice from an independent financial advisor if you have any doubts.
Editors’ Picks

NZD/USD slides toward 0.6000; RBNZ Breman's presser eyed
NZD/USD is meeting fresh supply and closes in on 0.6000 early Wednesday, in an initial reacton to the Reserve Bank of New Zealand's (RBNZ) expected interest rate on hold decision. The RBNZ kept the OCR unchanged at 2.25%. The focus is on Gowernor Breman's debut at press conference.

AUD/USD consolidates below 0.7100 as traders await FOMC Minutes
AUD/USD struggles to capitalize on the previous day's bounce from over a one-week low, trading under 0.7100 in Wednesday's Asian session. Traders await more cues about the US Fed's rate-cut path before placing fresh directional bets. Hence, the focus will be on the FOMC Minutes, due for release later today, which will drive the US Dollar and the currency pair. In the meantime, the RBA's hawkish stance and a generally positive risk tone might continue to cap the Aussie's downside amid hopes for additional stimulus from China.

Gold bounces back toward $4,900, looks to FOMC Minutes
Gold is attempting a bounce from the $4,850 level, having touched a one-week low on Tuesday. Signs of progress in US–Iran talks dented demand for the traditional safe-haven bullion, weighing on Gold in early trades. However, rising bets for more Fed rate cuts keep the US Dollar bulls on the defensive and act as a tailwind for the non-yielding yellow metal. Traders now seem reluctant ahead of the FOMC Minutes, which would offer cues about the Fed's rate-cut path and provide some meaningful impetus.

DeFi could lift crypto market from current bear phase: Bitwise
Bitwise Chief Investment Officer Matt Hougan hinted that the decentralized finance sector could lead the crypto market out of the current bear phase, citing Aave Labs’ latest community proposal as a potential signal of good things to come.

UK jobs market weakens, bolstering rate cut hopes
In the UK, the latest jobs report made for difficult reading. Nonetheless, this represents yet another reminder for the Bank of England that they need to act swiftly given the collapse in inflation expected over the coming months.
RECOMMENDED LESSONS
Making money in forex is easy if you know how the bankers trade!
I’m often mystified in my educational forex articles why so many traders struggle to make consistent money out of forex trading. The answer has more to do with what they don’t know than what they do know. After working in investment banks for 20 years many of which were as a Chief trader its second knowledge how to extract cash out of the market.
5 Forex News Events You Need To Know
In the fast moving world of currency markets where huge moves can seemingly come from nowhere, it is extremely important for new traders to learn about the various economic indicators and forex news events and releases that shape the markets. Indeed, quickly getting a handle on which data to look out for, what it means, and how to trade it can see new traders quickly become far more profitable and sets up the road to long term success.
Top 10 Chart Patterns Every Trader Should Know
Chart patterns are one of the most effective trading tools for a trader. They are pure price-action, and form on the basis of underlying buying and selling pressure. Chart patterns have a proven track-record, and traders use them to identify continuation or reversal signals, to open positions and identify price targets.
7 Ways to Avoid Forex Scams
The forex industry is recently seeing more and more scams. Here are 7 ways to avoid losing your money in such scams: Forex scams are becoming frequent. Michael Greenberg reports on luxurious expenses, including a submarine bought from the money taken from forex traders. Here’s another report of a forex fraud. So, how can we avoid falling in such forex scams?
What Are the 10 Fatal Mistakes Traders Make
Trading is exciting. Trading is hard. Trading is extremely hard. Some say that it takes more than 10,000 hours to master. Others believe that trading is the way to quick riches. They might be both wrong. What is important to know that no matter how experienced you are, mistakes will be part of the trading process.
The challenge: Timing the market and trader psychology
Successful trading often comes down to timing – entering and exiting trades at the right moments. Yet timing the market is notoriously difficult, largely because human psychology can derail even the best plans. Two powerful emotions in particular – fear and greed – tend to drive trading decisions off course.
