In the last three articles in this series, Part 1, Part 2 and Part 3, I’ve been discussing probabilities as applied to option trading. Last time I mentioned there are software tools that do the heavy lifting of these calculations for us. Below is an example of one of these, the Volatility Cone.
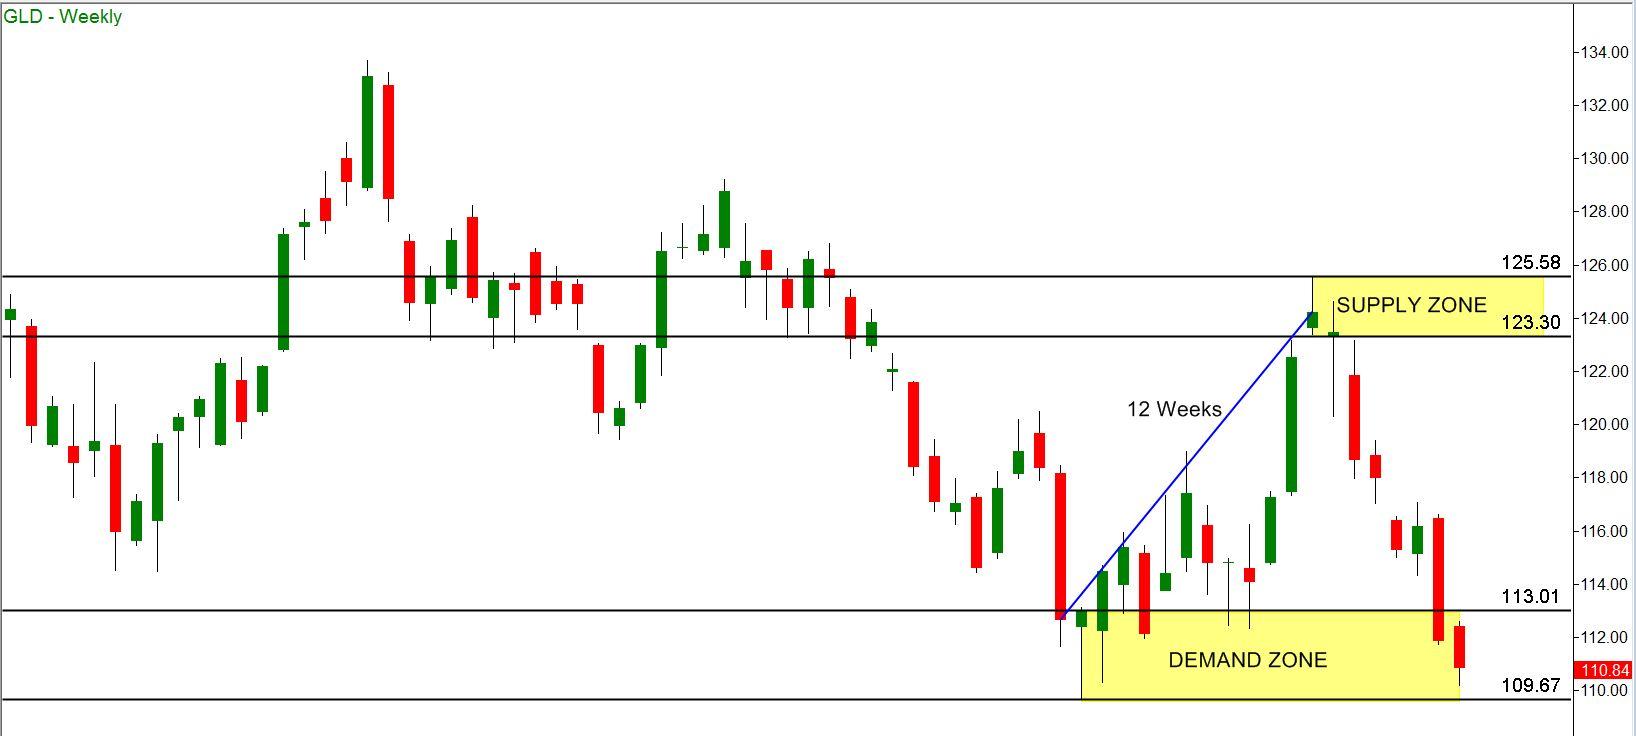
First, look at this price chart for GLD, the exchange-traded fund that tracks the price of gold. As of March 13 that chart looked like this:
The current price was in a demand zone in the $110-113 area. This zone had originated in early 2010, not shown on the chart. There was a supply zone overhead in the $123-125 area.
In this example I’m ignoring the nearby supply area around $116, which of course we couldn’t do in real life. The point here is to illustrate the tools available to us.
Let’s say that wearing our rose-gold-tinted glasses, we believed that gold had a good chance to make a stand here and climb up to the $123 area. Now we have to decide which options to use.
Free WorkshopFirst we need to decide on which expiration date to select. There are many dates to choose from, from one week to almost two years. Using options that are too far out will cost a lot of money – the farther out the expiration the more expensive the option. Therefore, going too far out will be a poor allocation of capital. Using options that expire too soon won’t work either. If our options expire before GLD makes its move we will lose.
So, we need to estimate how long this move up to the $123 target could take. We note that the last time that trip was made, between October 2014 and January 2015, it took about twelve weeks. This could be our working estimate of how long that rally could take this time.
Now we need to cross-check against probability. The question now is this: given the recent volatility of GLD, is it reasonable to expect a movement up to $123 in twelve weeks? And if not, how long should we allow?
To answer this we can use a tool called the Volatility Cone, or Vol Cone. This tool is provided in slightly different forms by several software vendors. The one we’re using here is part of the OptionStation Pro package from TradeStation.
To start, we do what is called creating a theoretical option position by selecting an option from the chain. For this purpose we’re just going to use an option whose strike price is close to the current stock price and whose expiration is later than our working estimate of twelve weeks. Although our reasonability check is for our twelve-week estimate, we want to add an extra two months to that since we would plan to sell any options that we might purchase when they still have at least two months of life left. That way we avoid owning options in the death-spiral portion of their lives, when time value declines rapidly.
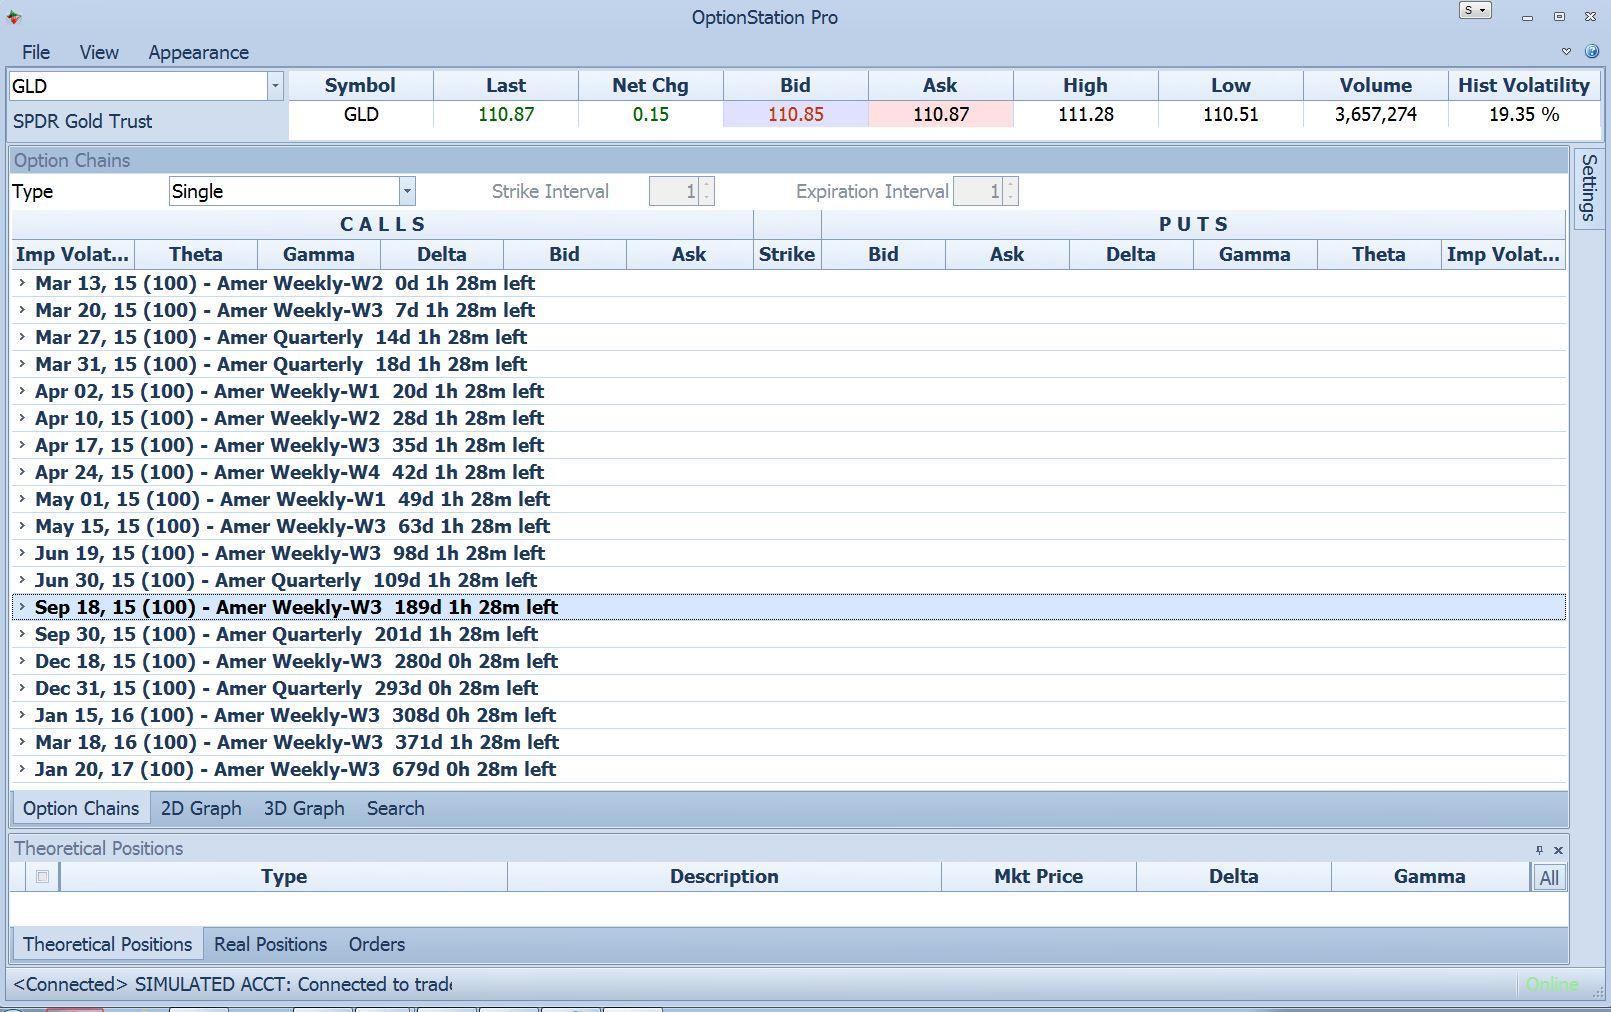
Here is the collapsed option chain for GLD as of March 13, 2015:
Note the highlighted row for the options that expire in 189 days, on September 18, 2015. This is the next available expiration date that is farther out than twelve-weeks-plus-two-months-extra.
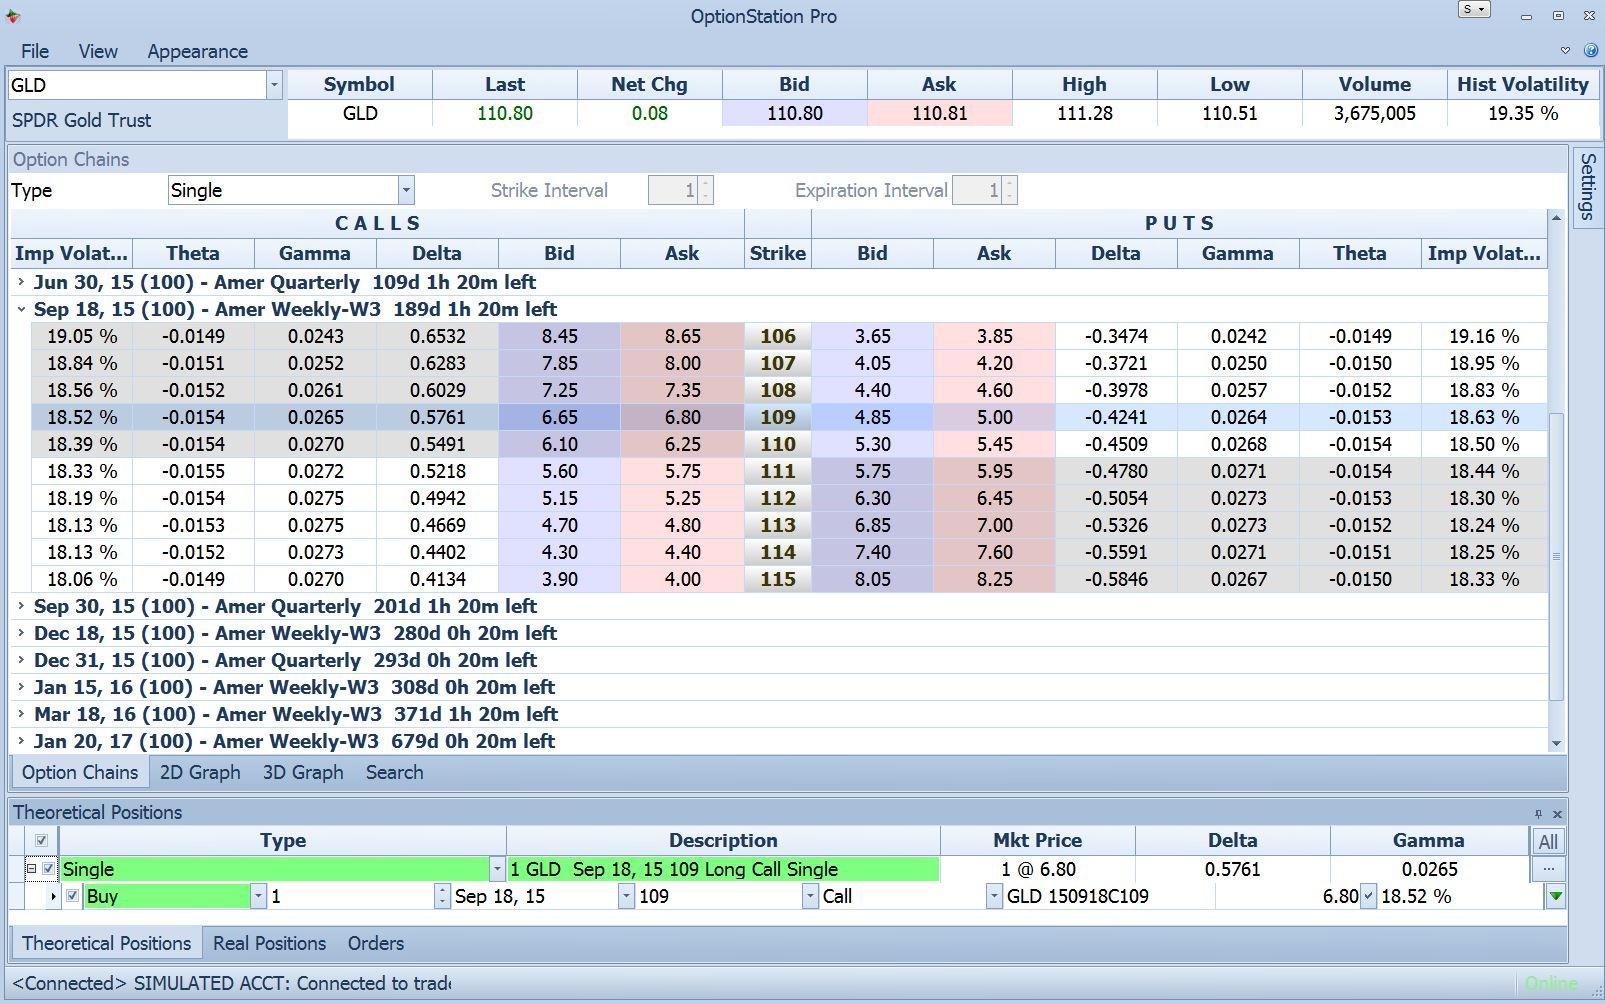
Expanding the September option chain, we see:
To create a theoretical position we select an option to be used. In this case I selected the call option at the $109 strike. This results in the green-highlighted position at the bottom of the OptionStation Pro display above.
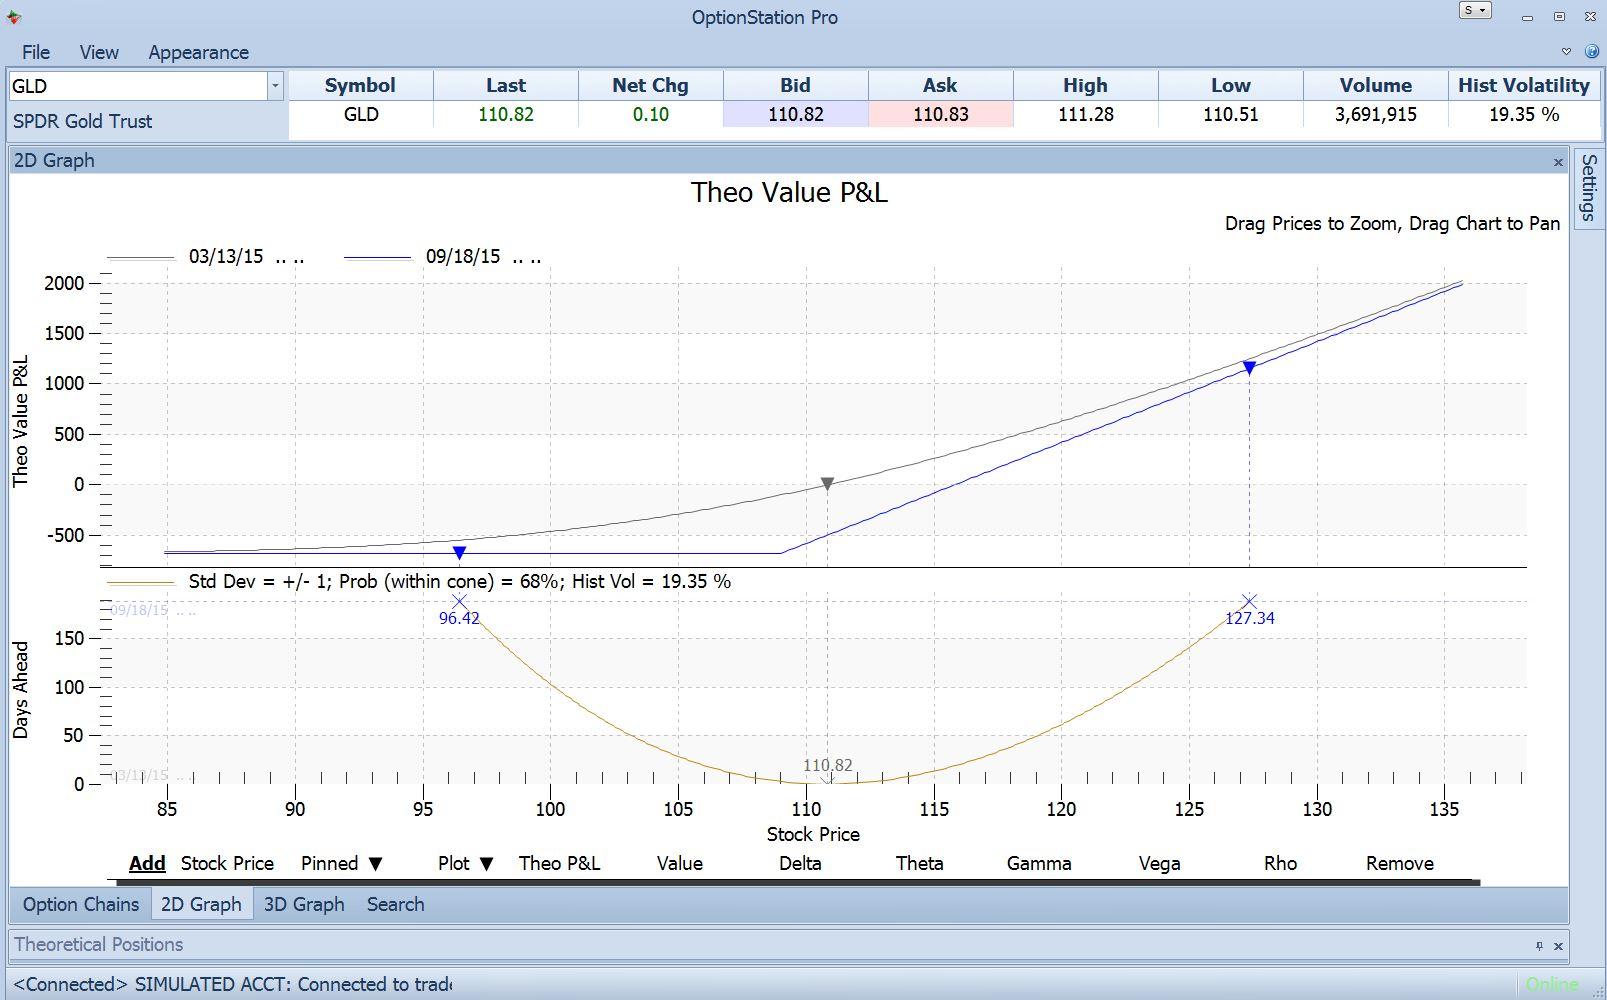
Next, we display a two-dimensional graph of the position by selecting the 2D Graph tab at the bottom of the option chain. This is the result:
The top half of the above chart is the familiar option payoff graph which has been discussed in several past articles.
The bottom half is the Volatility Cone. It shows the price range that falls within one standard deviation away from the current price. This is the price range that, given current volatility, has about a 68% chance of containing the actual price at a given future date. It takes into account GLD’s Historical Volatility, given as 19.35% at the top of the chart, and then calculates the price that is one standard deviation away as of each date in the future. The vertical axis of the vol cone is “Days Ahead,” the more days ahead, the wider the probable range. At the top of the vol cone is the 68%-probable range as of the options’ expiration date, 189 days in the future.
The blue labels show that as of the expiration date of 9/18/15, the boundaries of that 68%-probability range are $96.42 on the down side and $127.34 on the up side.
Interesting, but not exactly what we want to know. What we want to know is: is our $123 target probable, i.e. within one standard deviation for a twelve-week time frame?
To determine this we can read down the gold line of the vol curve until we get to the $123 target price, and then read over from this point to the left axis and read off the number of days. This is a little hard with the fairly compressed scale on the left side of the chart but it crosses on June 25, about 20 days further out then we estimated. We’ll need to allow a little more time for our trade to work.
That is all the space we have for now. Next time we’ll continue to describe how to use this ingenious tool.
This content is intended to provide educational information only. This information should not be construed as individual or customized legal, tax, financial or investment services. As each individual's situation is unique, a qualified professional should be consulted before making legal, tax, financial and investment decisions. The educational information provided in this article does not comprise any course or a part of any course that may be used as an educational credit for any certification purpose and will not prepare any User to be accredited for any licenses in any industry and will not prepare any User to get a job. Reproduced by permission from OTAcademy.com click here for Terms of Use: https://www.otacademy.com/about/terms
Editors’ Picks
EUR/USD rises toward 1.0700 after Germany and EU PMI data

EUR/USD gains traction and rises toward 1.0700 in the European session on Monday. HCOB Composite PMI data from Germany and the Eurozone came in better than expected, providing a boost to the Euro. Focus shifts US PMI readings.
GBP/USD regains 1.2350 ahead of UK PMIs

GBP/USD is recovering ground above 1.2350 in the European session, as the US Dollar comes under fresh selling pressure on improving risk sentiment. The further upside in the pair could be capped, as traders await the UK PMI reports for fresh trading impetus.
Gold price flirts with $2,300 amid receding safe-haven demand, reduced Fed rate cut bets

Gold price (XAU/USD) remains under heavy selling pressure for the second straight day on Tuesday and languishes near its lowest level in over two weeks, around the $2,300 mark heading into the European session.
PENDLE price soars 10% after Arthur Hayes’ optimism on Pendle derivative exchange

Pendle is among the top performers in the cryptocurrency market today, posting double-digit gains. Its peers in the altcoin space are not as forthcoming even as the market enjoys bullish sentiment inspired by Bitcoin price.
US S&P Global PMIs Preview: Economic expansion set to keep momentum in April

S&P Global Manufacturing PMI and Services PMI are both expected to come in at 52 in April’s flash estimate, highlighting an ongoing expansion in the private sector’s economic activity.
RECOMMENDED LESSONS
Making money in forex is easy if you know how the bankers trade!
Discover how to make money in forex is easy if you know how the bankers trade!
5 Forex News Events You Need To Know
In the fast moving world of currency markets, it is extremely important for new traders to know the list of important forex news...
Top 10 Chart Patterns Every Trader Should Know
Chart patterns are one of the most effective trading tools for a trader. They are pure price-action, and form on the basis of underlying buying and...
7 Ways to Avoid Forex Scams
The forex industry is recently seeing more and more scams. Here are 7 ways to avoid losing your money in such scams: Forex scams are becoming frequent. Michael Greenberg reports on luxurious expenses, including a submarine bought from the money taken from forex traders. Here’s another report of a forex fraud. So, how can we avoid falling in such forex scams?
What Are the 10 Fatal Mistakes Traders Make
Trading is exciting. Trading is hard. Trading is extremely hard. Some say that it takes more than 10,000 hours to master. Others believe that trading is the way to quick riches. They might be both wrong. What is important to know that no matter how experienced you are, mistakes will be part of the trading process.


