I love options for the tremendous variety of strategies they offer. One of the more creative ones is the Double Vertical spread. This strategy is appropriate when you have a strong bullish or bearish opinion on a stock or ETF; you want a limited-risk trade; and you want a trade that will not be affected too much by changes in volatility.
There are other strategies that could be used in this same situation, such as a directional butterfly. But I like the double vertical when I believe that there is a lot of potential for movement in my direction. Here is an example:
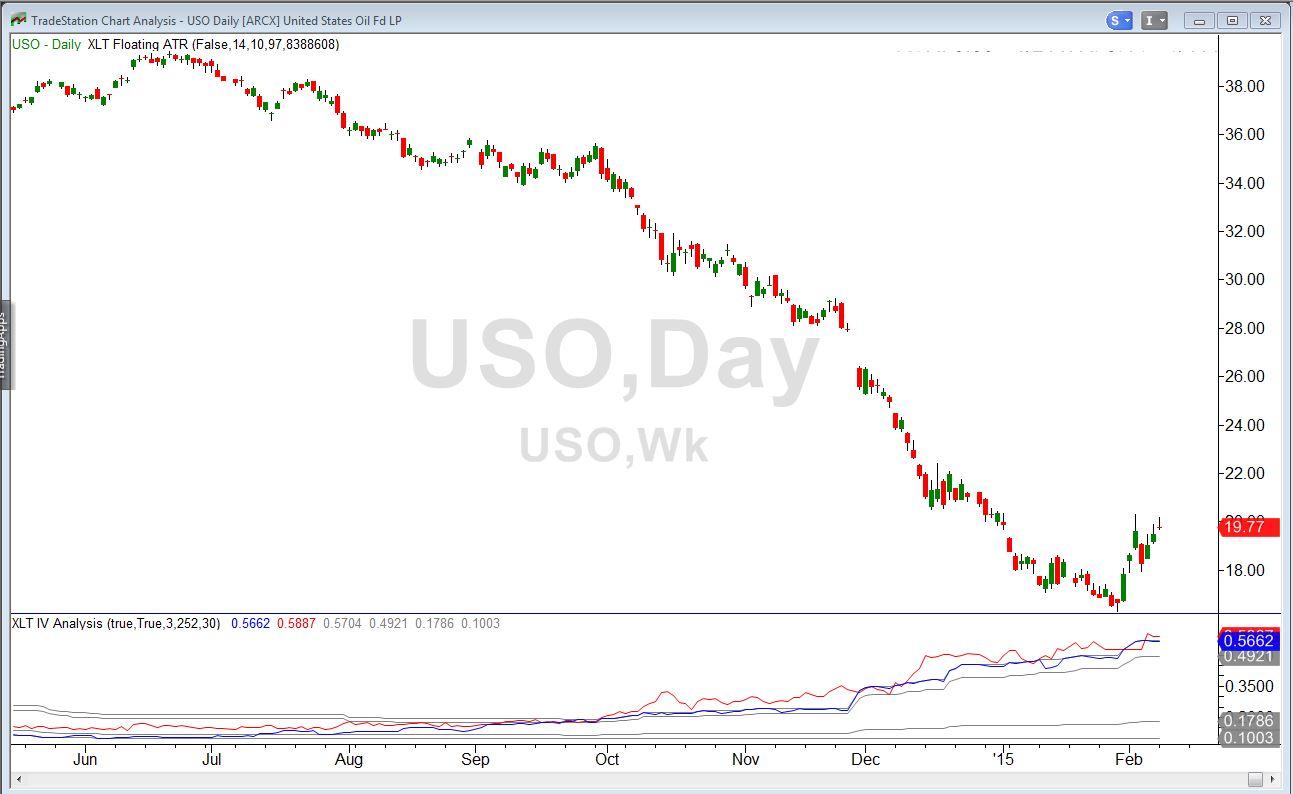
On February 9, USO, the exchange-traded fund that tracks the price of crude oil, was at $19.64. It’s chart appeared like this:
It looked as though the downtrend might have been broken. Prices had a very long way to go on the upside, even to get back to the $28 mark from where the big December breakdown occurred. Implied volatility, at over 56% was very high, meaning that options were expensive.
A double vertical includes two separate bullish vertical spreads. A Bull Put spread is put on at strike prices below the current price. This will generate a credit since the higher strike put will bring in more than the lower strike put costs. As long as the stock remains above the strike prices this credit will be ours to keep.
In this case, the May 18/15 bull put spread, consisting of a short put at the 18 strike and a long put at the 15 strike, could be sold for a net credit of $77 per contract (selling the 18 put for $1.19 and buying the 15 put at $.42). If USO closed on the May 15 expiration date at any price above $18 per share, both of these puts would be worthless and this $77 would be clear profit.
The second part of a double vertical spread is a bull call spread at higher strike prices. These strikes are selected so that the cost of this spread is less than the credit received for the bull put spread while still being within a price range that the stock might exceed.
Here, the May 22/25 bull call spread could be purchased for $62 per contract (paying $1.09 for the 22 calls and receiving $.47 for the 25 calls). This part of the trade could only make money if USO climbed considerably above the $22 long call strike. But it could be worth as much as three dollars per share ($25 – $22), which would be $300 per contract if USO did make it as high as $25. This seemed well within the realm of possibility. And if that bull call spread did payoff, that would also mean the bull put spread, at the lower strikes, was a winner.
The bull call spread consumed $62 of the $77 credit received for the bull put spread. Thus the net cost of the whole trade was a credit (money taken in) of $77 – $62 = $15.
Our best case was a total profit of $315. This included the $300 maximum value of the bull call spread plus the $15 net credit for the entire trade. This maximum profit could also be calculated in a different way by figuring the maximum profit of the two spreads as standalone trades. The maximum profit on the bull put spread was the $77 credit received for it. The maximum profit (not value) on the bull call spread was its $300 maximum value, less its original cost of $62, or $238 net. $238 plus $77 is also $315.
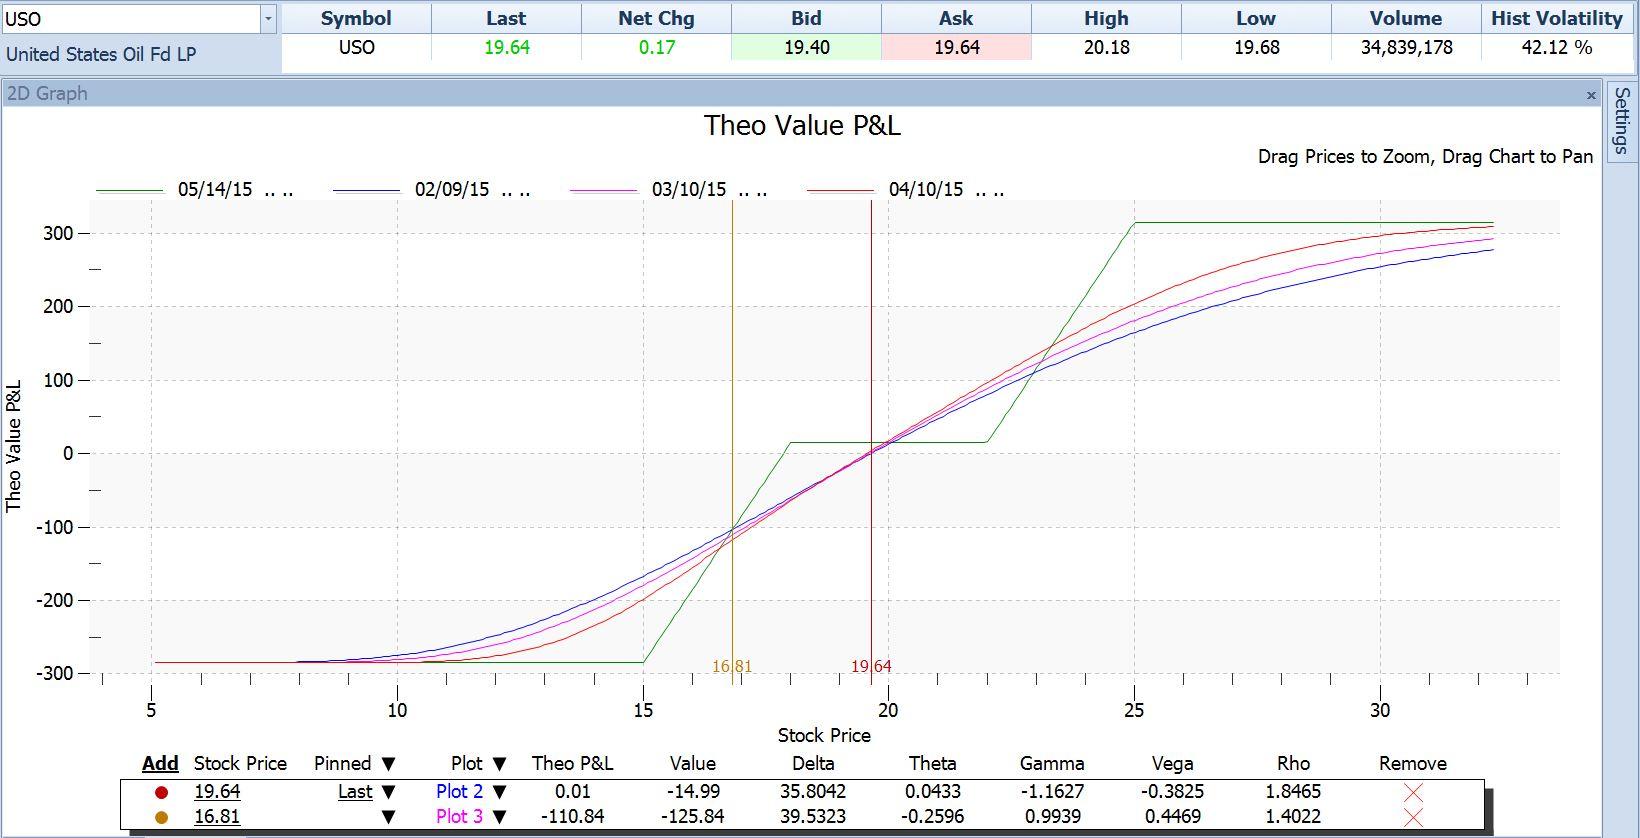
Below is the option payoff chart for this trade. Notice its unusual shape. The green line, representing P/L if held until expiration, has a rising segment between stock prices of $15 and $18, which are the two strikes in our bull put spread. It then flattens out (with a profit of $15) up to a stock price of $22. From there it rises again until finally flattening out at a stock price of $25. The $22 and $25 levels are the strike prices in our bull call spread.
The three curved lines represent the profit or loss on this trade at different dates before expiration: today (blue), one month out (magenta) and two months out (red). The close grouping of the curved lines shows that the trade is not affected much by the passage of time up until two months out.
The two vertical lines are at the current price of $19.64 and a stop-loss price at $16.81, described below.
Once this trade was in place we would put in a stop-loss order to unwind it (close out all parts of it) if USO dropped below $16.81, which was the top of a demand zone representing the all-time lows made in January. Our loss at that price would be about $110.84, as shown in the second line of the table above. So our reward-to-risk ratio was $315.00 / $110.84, or a little less than three to one.
Our break-even price on this trade would be the $18.00 short put strike less the $.15 per share credit received, or $17.85. At any price above that at expiration we would have a profit.
Even though the trade originally generated a credit of $.15 per share or $15 per contract, it still required us to consume buying power (margin), as credit trades always do. When a trade generates a credit it is always possible that unfavorable price movement of the stock will cause us to have to give back all of that credit plus more. In this case, if USO dropped below the $15.00 strike price and stayed there until expiration and we did nothing but watch it, the bull put spread would cost $300 to exit. The $18 put would be assigned so we would have to buy 100 shares of USO for $1800. We would then exercise our $15.00 put and push that stock right out again in exchange for $1500 for a net outlay of $300. And in that case, with USO below $15 per share it would, of course, also be below the $22 strike price of our long call, so the 22/25 bull call spread would be worthless.
That $300 maximum outlay less the $15 net credit originally received is a net of $285 maximum loss on the entire trade. This would be the buying power needed. We don’t get any reduction of our buying power requirement by putting in the stop-loss order, even though that should limit our loss to about $110. This is because it is possible that USO could simply close one night above $16.81 and then open the next day below $15 and we could let it sit until expiration. Not likely, but possible.
So it comes down to this:
- If USO remains at any price above our stop-loss of $16.81, we’d stay with this trade; otherwise we’d bail out as soon as our stop was violated.
- If USO is between $16.81 and our break-even of $17.85 at expiration, we will have a small loss somewhere between zero and $110.84.
- If USO is anywhere between $18 and $22 and we hold until expiration, our profit would be the $15 net credit received. If we exit earlier it will be higher.
- If USO rises above $22, then our profit will increase beyond the $15.00 net credit.
Next week we’ll check in on this trade and talk more about how to manage it in its last month.
This content is intended to provide educational information only. This information should not be construed as individual or customized legal, tax, financial or investment services. As each individual's situation is unique, a qualified professional should be consulted before making legal, tax, financial and investment decisions. The educational information provided in this article does not comprise any course or a part of any course that may be used as an educational credit for any certification purpose and will not prepare any User to be accredited for any licenses in any industry and will not prepare any User to get a job. Reproduced by permission from OTAcademy.com click here for Terms of Use: https://www.otacademy.com/about/terms
Editors’ Picks
AUD/USD jumps above 0.6500 after hot Australian CPI data

AUD/USD extended gains and recaptured 0.6500 in Asian trading, following the release of hotter-than-expected Australian inflation data. The Australian CPI rose 1% in QoQ in Q1 against 0.8% forecast, providing extra legs to the Australian Dollar upside.
USD/JPY hangs near 34-year high at 154.88 as intervention risks loom

USD/JPY is sitting at a multi-decade high of 154.88 reached on Tuesday. Traders refrain from placing fresh bets on the pair as Japan's FX intervention risks loom. Broad US Dollar weakness also caps the upside in the major. US Durable Goods data are next on tap.
Gold price cautious despite weaker US Dollar and falling US yields

Gold retreats modestly after failing to sustain gains despite fall in US Treasury yields, weaker US Dollar. XAU/USD struggles to capitalize following release of weaker-than-expected S&P Global PMIs, fueling speculation about potential Fed rate cuts.
Crypto community reacts as BRICS considers launching stablecoin for international trade settlement

BRICS is intensifying efforts to reduce its reliance on the US dollar after plans for its stablecoin effort surfaced online on Tuesday. Most people expect the stablecoin to be backed by gold, considering BRICS nations have been accumulating large holdings of the commodity.
US versus the Eurozone: Inflation divergence causes monetary desynchronization

Historically there is a very close correlation between changes in US Treasury yields and German Bund yields. This is relevant at the current juncture, considering that the recent hawkish twist in the tone of the Fed might continue to push US long-term interest rates higher and put upward pressure on bond yields in the Eurozone.
RECOMMENDED LESSONS
Making money in forex is easy if you know how the bankers trade!
Discover how to make money in forex is easy if you know how the bankers trade!
5 Forex News Events You Need To Know
In the fast moving world of currency markets, it is extremely important for new traders to know the list of important forex news...
Top 10 Chart Patterns Every Trader Should Know
Chart patterns are one of the most effective trading tools for a trader. They are pure price-action, and form on the basis of underlying buying and...
7 Ways to Avoid Forex Scams
The forex industry is recently seeing more and more scams. Here are 7 ways to avoid losing your money in such scams: Forex scams are becoming frequent. Michael Greenberg reports on luxurious expenses, including a submarine bought from the money taken from forex traders. Here’s another report of a forex fraud. So, how can we avoid falling in such forex scams?
What Are the 10 Fatal Mistakes Traders Make
Trading is exciting. Trading is hard. Trading is extremely hard. Some say that it takes more than 10,000 hours to master. Others believe that trading is the way to quick riches. They might be both wrong. What is important to know that no matter how experienced you are, mistakes will be part of the trading process.


