![]() EzTrader Market Analysis Team
EzTrader Market Analysis Team
EzTrader
Expectations are the forces that drive financial markets. Investors build their positions and strategies based on expectations, projections and views. For anyone who wants to know what the general consensus of the market, finding would have been extremely difficult in the absence of financial instruments, such as derivatives.
Current asset price reflects the momentary equilibrium (i.e., the price where the supply meets the demand and vice versa). However, if we want to know the expectations with regards to the medium/long-term future, we need to turn to the derivatives market.
The derivatives market is used by different market participants to express views (or to hedge) future exposures (as discussed in our last article “Not What You Have Been Taught: Why Capital Market is Not a Zero Sum Game”). For that reason, if one wants to assess the general consensus regarding a certain asset, in most cases the answer will be found in the price.
The derivatives market can be divided into three main instrument types:
1. Futures/Forwards – the Futures/Forwards reflect the future price of assets, taking into account the cost of carry (interest rate differentials/dividends/storage costs for commodities)
2. Swaps – Mostly used for interest rate yield curve. Reflects the market expectations regarding the monetary policy (rate hike probability), inflation path and credit risk (the risk of companies’ default)
3. Options – Options’ prices reflect both the expected volatility of the underlying asset and the spot distribution density for the specific maturity (for example 3-month time)
In our view, Options are, by far, the most interesting instruments for analysis of the market expectations, as they are widely available for the liquid assets and provide a reliable gauge.
Let’s review the following example:
GBP/USD Spot = 1.33
3-month implied volatility = 10%
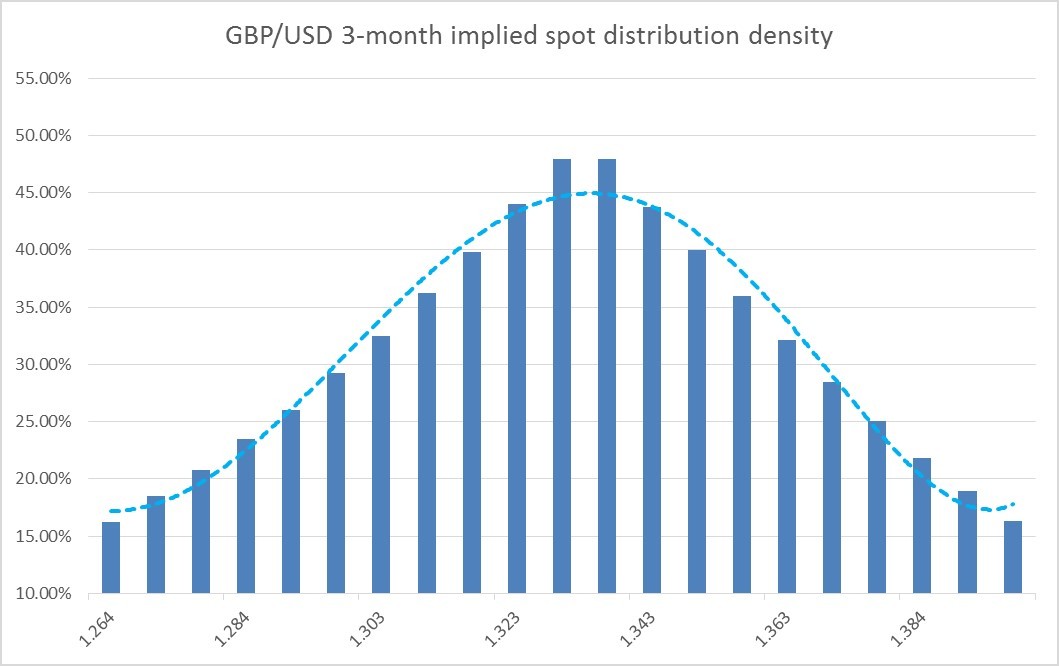
As we can see in the chart above, the market expectation, based on the option market pricing, is that the GBP/USD will stay within the 1.3030-1.3630 range for the next 3-months (that range equals to 1 standard deviation around the current forward price).
Once the market participants digest new development, that expectation can change and is subjected to the supply/demand of the different participants. Some investors might look to hedge themselves of the large move of the GBP/USD (or to speculate that it will move), and therefore will go and buy options to express that view. The demand for options will cause the options price to rise, and therefore imply a wider distribution density. If investors think that the upcoming period is going to exhibit low volatility (i.e. calmer price action), they will express their view by selling options, and therefore the implied distribution will become narrower.
As we can see, there is ongoing feedback between the market expectations and the derivatives prices. This is why the derivatives market is where analysts, investors and policy makers would be able to read into the market expectations. Even though policy makers (Central Bankers) will not relay their decision on the market expectations (meaning that they will not try to meet the market expectation), they use it to assess their communication with the market (and to assess how their forward guidance is perceived by investors).
How to capitalize the knowledge of the implied market expectations:
1. Once we establish our views (or expectations), we can analyze whether our views meet the market expectations
2. If our views deviate significantly from the market expectations, we can use derivatives (options, futures) to leverage our views and put a position which expresses our views for a relatively cheap price (as our views are perceived as views that have a low probability of ending “in-the-money”)
3. We should try and “leg in” into a position and not allocate our full investment all at once. As we usually place contrarian positions to what the market expects, it is possible that the divergence between our view and the market’s view can grow further before it reverts
Good Luck.
1. Introduction This risk disclosure and warning notice is provided to you (our Client and prospective Client) in compliance to the Provision of Investment Services, the Exercise of Investment Activities, the Operation of Regulated Markets and Other Related Matters Law 144(I)/2007, as subsequently amended from time to time (“the Law”), which is applicable in WGM Services Limited (“the Company”). All Clients and prospective Clients should read carefully the following risk disclosure and warnings contained in this document, before applying to the Company for a trading account and before they begin to trade with the Company. However, it is noted that this document cannot and does not disclose or explain all of the risks and other significant aspects involved in dealing in Binary Options. The notice was designed to explain in general terms the nature of the risks involved when dealing in Binary Options on a fair and non-misleading basis.
2. Risks 2.1. Trading in Binary Options is VERY SPECULATIVE AND HIGHLY RISKY and is not suitable for all members of the general public but only for those investors who: (a) understand and are willing to assume the economic, legal and other risks involved. (b) taking into account their personal financial circumstances, financial resources, life style and obligations are financially able to assume the loss of their entire investment. (c) have the knowledge to understand Binary Options trading and the underlying assets and markets. 2.2. The Company will not provide the Client with any advice relating to Binary Options, the underlying assets and markets or make investment recommendations of any kind. So, if the Client does not understand the risks involved he should seek advice and consultation from an independent financial advisor. If the Client still does not understand the risks involved in trading in Binary Options, he should not trade at all. 2.3. Binary Option are derivative financial instruments deriving their value from the prices of the underlying assets/markets in which they refer to (for example currency, equity indices, stocks, metals, indices futures, forwards etc.). Although the prices at which the Company trades are set by an algorithm developed by the Company, the prices are derived from the underlying assets /market. It is important therefore that the Client understands the risks associated with trading in the relevant underlying asset/ market because fluctuations in the price of the underlying asset/ market will affect the profitability of his trade.
Editors’ Picks

EUR/USD: Breakdown below trading range support near 1.1770 comes into play
The EUR/USD pair opens with a bearish gap at the start of a new week as the US-Iran war-led global flight to safety boosts the US Dollar. Spot prices, however, lack follow-through selling and manage to hold above mid-1.1700s during the Asian session.

GBP/USD declines below 1.3450 on Middle East tensions, UK political uncertainty
The GBP/USD pair attracts some sellers to around 1.3420 during the early Asian session on Monday. The US Dollar edges higher against the Cable amid escalating tensions in the Middle East after recent US-Israeli strikes on Iran over the weekend.

USD/JPY: Japanese Yen fights for control amid US-Iran war-led intense flight to safety
The Japanese Yen is trying hard to regain control against the US Dollar in a fight to emerge as the traditional safety bet as the war between the United States, Israel and Iran enters its third day. The USD/JPY pair is holding modest gains, divided between broad USD strength and increased safe-haven flows into the JPY, as markets run for cover in times of escalating Middle East conflict.
Editors’ Picks

WTI jumps above $70.50 on fears of Iran supply disruption
West Texas Intermediate, the US crude oil benchmark, is trading around $70.65 during the early European trading hours on Friday. The WTI jumps to its highest since June 2025 after joint military strikes by the US and Israel against Iran over the weekend. Traders brace for the release of the American Petroleum Institute report, which will be released later on Tuesday.

Gold jumps over 2% toward $5,400 after US, Israel attack Iran
Gold is on fire at the start of the week, a widely expected move, as investors seek harbor in the traditional store of value, following the continued US and Israel attacks on Iran. The bright metal opened with a bullish gap of about $17 and rallied toward the $5,400 level as Asian traders hit their desks and reacted negatively to the weekend news of the Middle East conflict, rushing for cover in Gold.

AUD/USD pares recent losses despite Middle-East conflict
AUD/USD recovers after opening at a gap down, trading around 0.7070 during the Asian hours on Monday. The risk-sensitive pair plunged as risk aversion heightened after the United States and Israel carried out coordinated strikes on Iran over the weekend.

Iran escalation: Quick thoughts on markets
Markets are likely to open the week with risk-off, with declines led by airlines, cyclicals and trade-exposed names, while energy, defense and “strategic” sectors may be relatively steadier.

Crisis in the Middle East: The market reaction
A primer on how markets will open on Monday, and why geopolitical risk may not be easily absorbed by financial markets this time around. Geopolitics and events between Iran, the US and the wider Middle East will dominate financial markets on Monday. The situation has continued to escalate as we move through Sunday.
RECOMMENDED LESSONS
Making money in forex is easy if you know how the bankers trade!
I’m often mystified in my educational forex articles why so many traders struggle to make consistent money out of forex trading. The answer has more to do with what they don’t know than what they do know. After working in investment banks for 20 years many of which were as a Chief trader its second knowledge how to extract cash out of the market.
5 Forex News Events You Need To Know
In the fast moving world of currency markets where huge moves can seemingly come from nowhere, it is extremely important for new traders to learn about the various economic indicators and forex news events and releases that shape the markets. Indeed, quickly getting a handle on which data to look out for, what it means, and how to trade it can see new traders quickly become far more profitable and sets up the road to long term success.
Top 10 Chart Patterns Every Trader Should Know
Chart patterns are one of the most effective trading tools for a trader. They are pure price-action, and form on the basis of underlying buying and selling pressure. Chart patterns have a proven track-record, and traders use them to identify continuation or reversal signals, to open positions and identify price targets.
7 Ways to Avoid Forex Scams
The forex industry is recently seeing more and more scams. Here are 7 ways to avoid losing your money in such scams: Forex scams are becoming frequent. Michael Greenberg reports on luxurious expenses, including a submarine bought from the money taken from forex traders. Here’s another report of a forex fraud. So, how can we avoid falling in such forex scams?
What Are the 10 Fatal Mistakes Traders Make
Trading is exciting. Trading is hard. Trading is extremely hard. Some say that it takes more than 10,000 hours to master. Others believe that trading is the way to quick riches. They might be both wrong. What is important to know that no matter how experienced you are, mistakes will be part of the trading process.
The challenge: Timing the market and trader psychology
Successful trading often comes down to timing – entering and exiting trades at the right moments. Yet timing the market is notoriously difficult, largely because human psychology can derail even the best plans. Two powerful emotions in particular – fear and greed – tend to drive trading decisions off course.