![]() EzTrader Market Analysis Team
EzTrader Market Analysis Team
EzTrader
Are the following dates meaningful for you: Aug 24th 2015, Oct 15th 2014, and May 6th 2010? If not, don’t sweat it… these dates are mostly remembered by traders in financial markets, as these dates mark dates of the infamously events known as “Flash Crash”. A Flash Crash is an event that comes, out of the blue, and drives the market insane for a short period of time (mostly in a form of market’s sudden collapse). But once it ends, the market returns to (relatively) normal form. These events cannot be predicted, and cannot be explained using the conventional probability theory, and are often known as “Black Swans”.
“Black Swan” takes its meaning from the ancient saying that presumed black swans do not exist (which was later found out to be incorrect, as these existed in the wild). Nassim Taleb refers to the “Black Swan Theory” as a theory that holds three main characteristics:
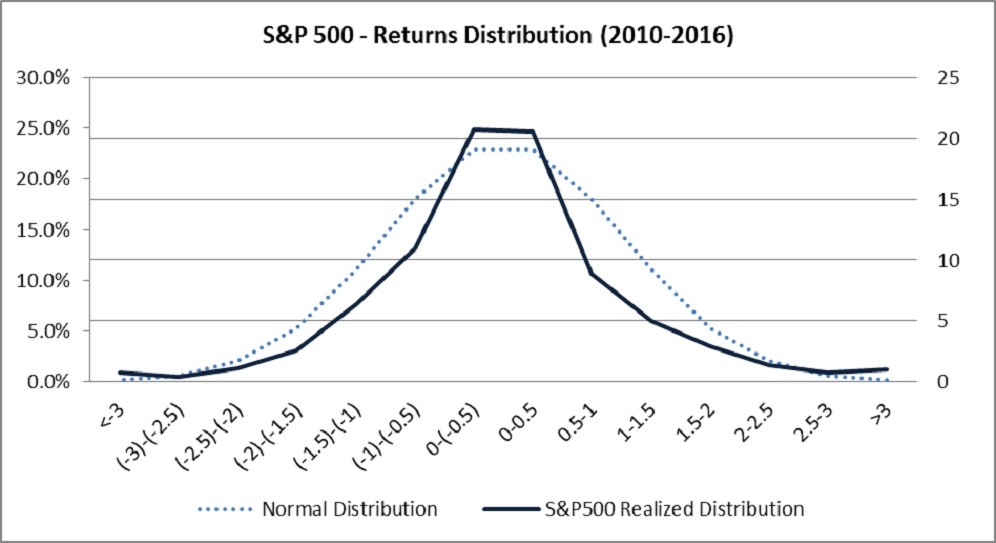
⦁ The probability of the events is non-computable, as the normal distribution assumes these can never happen (beyond +/-3 Standard Deviation).
⦁ These events are impossible to predict, and their effects are disproportional to the probability they assumed to have.
⦁ The magnitude of these events is usually high and these events play a dominant role in history.
Is the financial market really normally distributed?
Endless numbers of papers were written about financial markets and the probability theory. All of them concluded that financial markets are definitely, not distributed normally. Financial Markets’ distribution holds “Fat” Tails and “Skewed” Returns. These two characteristics help us explain how events, that the probability theory assumed would never happen in our lifetime, happen over and over again.
Let’s look at a few examples from the recent history:
May 6th 2010 – US equity market collapsed 10% in a matter of 6-minutes, before rebounding (ending the day “only” 3.5% down”). This event is a 6 Standard Deviation event. In other words, this event should happen once every 1 million years.
Oct 15th 2014 – On a normal Friday morning in the US market, a 10-year Treasury Bond yield collapsed 0.3% in a matter of 10-minutes. To put that in context, this move is equivalent to 16% move in equity market, a 7 Standard Deviation event in the US Treasury Market. Likelihood of witnessing such a move again should not exist (this event happens once every 2.5 million years). Guess what, it just happened last month…
Aug 24th 2015 - Soon after the US equity market opened, the trading day major indices collapsed 5%, and recovered some of the loss, ending the day 3.6% down. Dollar rallied at the same period about 2%, but retraced back. This event is 5.5 Standard Deviations, so the chance of seeing such events exists only if you will live to the age of 1.7 million years...
You can obviously see where this is going… Although the mathematics and probability theory tells us that there is absolutely no chance of these events occurring, they keep on happening. In fact, over the last 6 years, the S&P 500 had 34 days where it gained/lost more than +/-3%, which is above/below +/- 3 Standard Deviations.
Why these events keep on happening over and over again?
Few major developments over the last couple of years have increased the rate of these occurrences:
⦁ Technology Developments – the rise of algorithmic trading (High Frequency Trading) and sophisticated machines have caused a very sensitive market. In the blink of an eye, algorithms send millions of trading orders. This development added a significant risk to the market (just google “Knight Capital” to see what happens when algorithmic trading goes wrong…). Faulty algorithms and HFT market manipulations have been the primary causes of these events.
⦁ Drying Liquidity – After the 2008 financial crisis, several banks and investment firms (namely big hedge funds) pulled out of different markets, causing drying liquidity. In illiquid markets, every small trade can cause enormous waves. Even the most liquid markets (US Treasury, US Equities, or G10 currencies) are less liquid than before, which makes the shallow liquidity to act as a fertile ground for massive moves.
⦁ Banks’ Risk Limits and Regulation – Since 2008, increasing regulation and extremely tight risk limits have caused banks to be quite risk-averse. Despite their role of providing liquidity to the market (to the clients, the market-takers), and to warehouse the risk, they were forced to cut their risk limits to avoid experiencing the 2008 crisis all over again. Trading floors nowadays have a very strict and cautious risk profiles, which means that in case of large moves, they will eventually stop-out on their positions, and effectively intensify the ripple effect.
⦁ Global Interconnection – The “Chaos Theory” claims that “something as small as the flutter of a butterfly’s wing can ultimately cause a typhoon halfway around the world”. This is very much true in financial markets. The recent years brought the world a whole lot closer, and investment managers nowadays hold huge portfolios, with holdings all the way from China to the US, from currencies to commodities. When things hit the fan, the risk of massive capitulation increases dramatically, and no asset is safe. A very famous example of this is Procter and Gamble (P&G), a blue-chip company, which fell on May 6th 2010 as much as 37% at one point.
How can we take advantage of these Black Swans?
There is an old and famous joke about a very religious guy that lived by the bible, prayed every day, and never did harm to anyone. When he died and went to heaven, he asked God: “Every day I prayed, asking for only one thing… to win the lottery. Why didn’t you fulfil my prayer?” God answered: “if only you would have bought a lottery ticket…”
It is obvious that to have the chance of “hitting the jackpot” we need to be in the game… paying for cheap lottery tickets in financial markets is always a wise thing to do (but make sure that they are really cheap…). Buying small options for cheap, putting trades where their risk/reward is extreme will both keep you in the game, and will act as protection for any event even as rare as being hit by an asteroid.
1. Introduction This risk disclosure and warning notice is provided to you (our Client and prospective Client) in compliance to the Provision of Investment Services, the Exercise of Investment Activities, the Operation of Regulated Markets and Other Related Matters Law 144(I)/2007, as subsequently amended from time to time (“the Law”), which is applicable in WGM Services Limited (“the Company”). All Clients and prospective Clients should read carefully the following risk disclosure and warnings contained in this document, before applying to the Company for a trading account and before they begin to trade with the Company. However, it is noted that this document cannot and does not disclose or explain all of the risks and other significant aspects involved in dealing in Binary Options. The notice was designed to explain in general terms the nature of the risks involved when dealing in Binary Options on a fair and non-misleading basis.
2. Risks 2.1. Trading in Binary Options is VERY SPECULATIVE AND HIGHLY RISKY and is not suitable for all members of the general public but only for those investors who: (a) understand and are willing to assume the economic, legal and other risks involved. (b) taking into account their personal financial circumstances, financial resources, life style and obligations are financially able to assume the loss of their entire investment. (c) have the knowledge to understand Binary Options trading and the underlying assets and markets. 2.2. The Company will not provide the Client with any advice relating to Binary Options, the underlying assets and markets or make investment recommendations of any kind. So, if the Client does not understand the risks involved he should seek advice and consultation from an independent financial advisor. If the Client still does not understand the risks involved in trading in Binary Options, he should not trade at all. 2.3. Binary Option are derivative financial instruments deriving their value from the prices of the underlying assets/markets in which they refer to (for example currency, equity indices, stocks, metals, indices futures, forwards etc.). Although the prices at which the Company trades are set by an algorithm developed by the Company, the prices are derived from the underlying assets /market. It is important therefore that the Client understands the risks associated with trading in the relevant underlying asset/ market because fluctuations in the price of the underlying asset/ market will affect the profitability of his trade.
Editors’ Picks
EUR/USD nears 1.0800 on broad US Dollar weakness

Optimism continues to undermine demand for the American currency ahead of the weekly close. EUR/USD hovers around weekly highs just ahead of the 1.0900 figure.
GBP/USD reconquers 1.2500 with upbeat UK GDP

Following BOE-inspired slump on Thursday, the British Pound changed course and trades around 1.2530. Better-than-anticipated UK GDP and a weaker USD behind the advance.
USD/JPY moves above 155.50 due to the firmer US Dollar

USD/JPY gained ground due to the recovery in the US Dollar on Friday. Japan’s Current Account Surplus was lower than market expectations, weakening the Japanese Yen. US Initial Jobless Claims rose to an eight-month high of 231K, surpassing estimates of 210K.
Editors’ Picks
EUR/USD nears 1.0800 on broad US Dollar weakness
Optimism continues to undermine demand for the American currency ahead of the weekly close. EUR/USD hovers around weekly highs just ahead of the 1.0900 figure.
GBP/USD reconquers 1.2500 with upbeat UK GDP
Following BOE-inspired slump on Thursday, the British Pound changed course and trades around 1.2530. Better-than-anticipated UK GDP and a weaker USD behind the advance.
Gold resumes advance and trades above $2,370

XAU/USD accelerated its recovery on Friday, as investors drop the USD. Dismal US employment-related figures revived hopes for a soon-to-come rate cut from the Fed.
XRP tests support at $0.50 as Ripple joins alliance to work on blockchain recovery

XRP trades around $0.5174 early on Friday, wiping out gains from earlier in the week, as Ripple announced it has joined an alliance to support digital asset recovery alongside Hedera and the Algorand Foundation.
Euro area annual inflation is expected to be 2.4% in April 2024
Euro area annual inflation is expected to be 2.4% in April 2024, stable compared to March. Looking at the main components of euro area inflation, services is expected to have the highest annual rate in April.
RECOMMENDED LESSONS
Making money in forex is easy if you know how the bankers trade!
Discover how to make money in forex is easy if you know how the bankers trade!
5 Forex News Events You Need To Know
In the fast moving world of currency markets, it is extremely important for new traders to know the list of important forex news...
Top 10 Chart Patterns Every Trader Should Know
Chart patterns are one of the most effective trading tools for a trader. They are pure price-action, and form on the basis of underlying buying and...
7 Ways to Avoid Forex Scams
The forex industry is recently seeing more and more scams. Here are 7 ways to avoid losing your money in such scams: Forex scams are becoming frequent. Michael Greenberg reports on luxurious expenses, including a submarine bought from the money taken from forex traders. Here’s another report of a forex fraud. So, how can we avoid falling in such forex scams?
What Are the 10 Fatal Mistakes Traders Make
Trading is exciting. Trading is hard. Trading is extremely hard. Some say that it takes more than 10,000 hours to master. Others believe that trading is the way to quick riches. They might be both wrong. What is important to know that no matter how experienced you are, mistakes will be part of the trading process.