crypto technical
Crypto trading strategies with Bollinger Bands
30 min Beginners Intermediate
One of the most actively used technical indicators among crypto traders are Bollinger Bands, which are used to measure volatility and look for entry and exit points. In this article, we’re going to review how they are calculated and how they can help you to spot trading opportunities.

Related content
The Bollinger Bands
Bollinger bands are named after John Bollinger, an American asset manager, and technical analyst. He became an independent trader in 1980 and then joined the Financial News Network that was then acquired by NBC. He provided commentary to CNBC and founded his investment firm, Bollinger Capital Management.
He also served on the board for the Market Technicians Association (MTA) and also on the Federation of Technical Analysts (FTA). He based his Bollinger Bands on Keltner Bands and similar to Donchian channels and focused on volatility standard deviation to make his bands more adaptive. The name Bollinger Bands was coined by chance on one of the programs on FNN.
What Are Bollinger Bands
Created in the 1980’s by John Bollinger, an American asset manager, and technical analyst, the Bollinger Bands are defined as a set of three lines plotted over the asset prices:
- The middle line is a Simple Moving Average (SMA) of N periods.
- The upper band is the value of the middle line plus k times the standard deviation (SD) of the price.
- The lower band is the value of the middle line minus K times the standard deviation (SD) of the price.
Therefore, mathematically, the upper and lower bands can be calculated as:
SMA ± k x SD
By default, Bollinger bands parameters are typically set to N=20 and k=2 in most of the platforms but, of course, you can modify them and experiment with different values. By the way, k doesn’t have to be necessarily an integer or greater than 1, and the simple moving average can be replaced by an exponential one. When it comes to trading, don’t forget to be creative.
By using the formula above, you can plot an “envelope” or “channel” around the price as you can see in the following BTCUSD 1-hour chart:
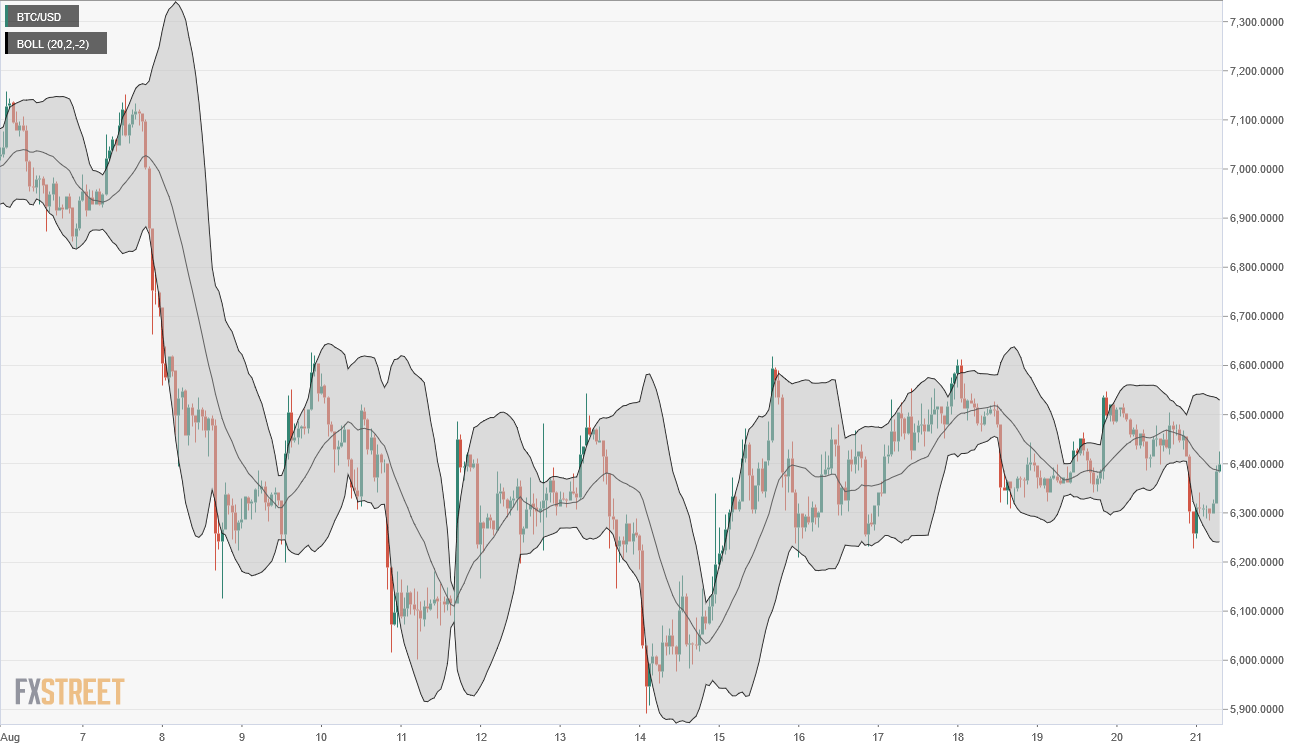
From the chart above, you can easily see that the bandwidth, (that is, the difference between the upper and the lower band) widens and narrows depending on volatility. The wider you see the bands, the more volatility there was at that time; conversely, when you see narrower bands, it means less volatility in the market.
High and low volatility periods are quickly spotted by examining the bands' behavior. In fact, when bands are contracting, there is a high chance of sharp price changes as volatility increases.
Another interesting feature of Bollinger bands is that they provide a way to detect, under certain conditions, oversold and overbought areas in relation to the moving average. In particular, when new highs and lows are made outside the bands followed by highs and lows made inside the bands, there’s a high probability that a trend reversal is about to happen.
Finally, Bollinger bands do not always signal a trend reversal but they can detect a trend continuation pattern: if the price surpasses the upper band or falls below the lower band, then we have a strong signal of continuation of the current trend. This is a very important rule to bear in mind though many novice traders forget that and always try to look for tops and bottoms around the bands.
Now that we have a clear understanding of how to calculate and interpret Bollinger bands, let’s review some strategies based on them in the next section.
BEST CRYPTO BROKERS/EXCHANGES
How To Use Bollinger Bands in Your Trading
As we said above, Bollinger bands can provide reversal as well as continuation signals. The following strategies take advantage of this bands feature.
1) Bollinger Bounce
This is, by far, the most simple strategy to trade cryptocurrencies using Bollinger bands. Considering that the lower band provides oversold levels and the upper band overbought ones, just buy when the market is near the lower band, or below it, and sell when the market price is near or above the upper bands. Easy, huh?
Not so fast! Before trading the Bollinger bounce you have to identify the current market conditions. Is the price moving sideways or is it trending? In the first case, this strategy will work like a charm, but in the second one, be prepared to lose a lot of money.
Fortunately, Bollinger bands provide a criterion to say when the market is in a trendless mode: if the bands are almost flat, then it’s time to trade the Bollinger bounce strategy.
Let’s go through an example: look at the following LTCUSD 4-hours chart. The green circles signal potential buy opportunities while the red circles are the right place to sell.
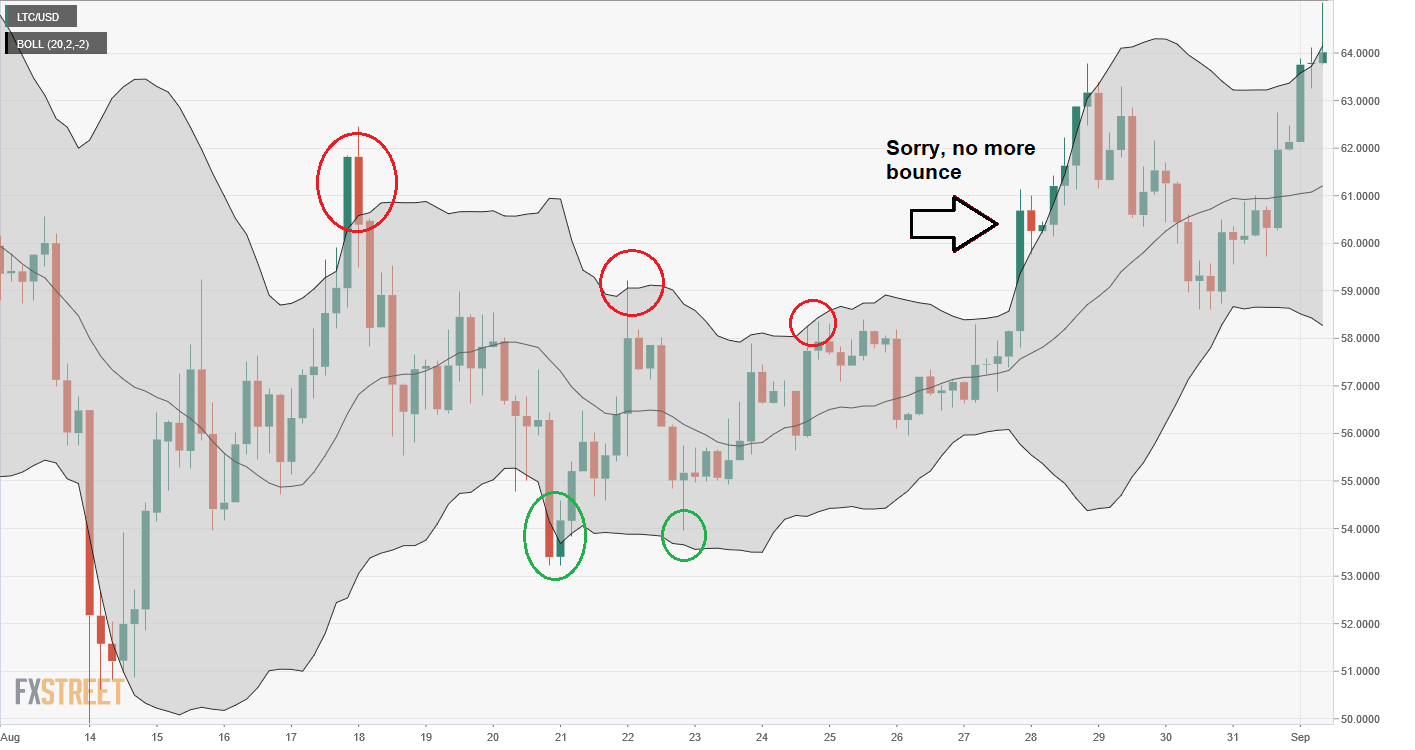
While the Bollinger bands slope is flat, the bounce strategy works nicely but, what happens when the price breaks above the upper band and doesn’t come back? Then it’s time to stop trading the Bollinger bounce. Of course, when trading this strategy it’s important to set stop loss levels not very far from our entry point.
2) Bollinger Squeeze
Bollinger bands also provide a way to detect the start of new trends. Just look for an extended low volatility period, with narrowing bands, and wait for a candle closing above or below the bands as they start to expand. Once you identify this pattern, just trade in the direction of the breakout.
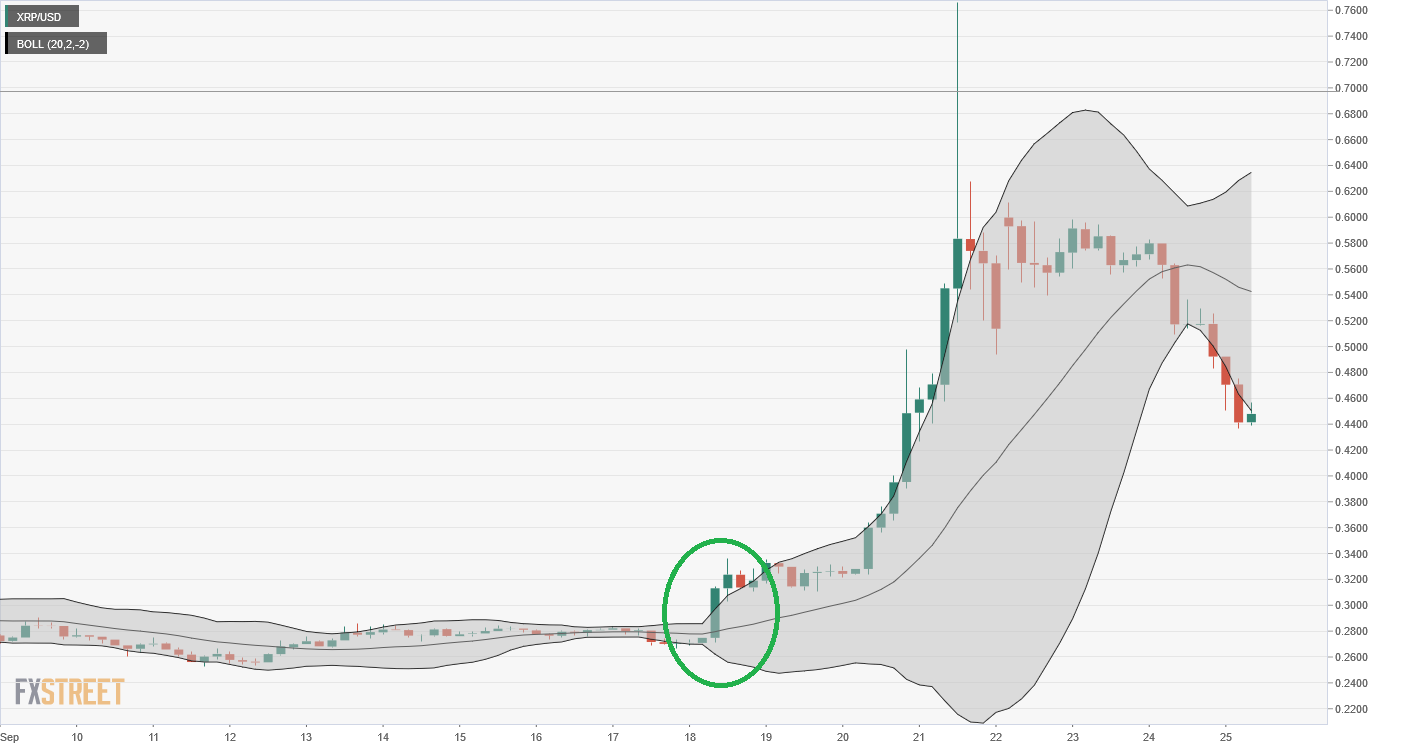
A clear example of a Bollinger squeeze can be found in the following Ripple 4 hours chart: after several days of low volatility market, there’s a strong bullish candle breaking above the upper band (green circle). After the breakout, the XRPUSD initiated an explosive upward movement, gaining more than 100%, showing several new highs above the upper band.
Conclusion
Bollinger bands are a great tool to understand how market volatility fluctuates and find excellent trading opportunities. However, it is important not to forget that the interpretation of Bollinger bands is different depending on the current volatility regime. Therefore, never use them only as an overbought/oversold oscillator.
It is also advisable not to rely exclusively on a single indicator. It is better to combine Bollinger bands with other indicators such as RSI or ADX to identify entry and exit points. By doing this, you will be increasing your probability of success in trading.
The information provided by FXStreet does not constitute investment or trading advice and should be just treated for informational purposes. Our content may also include affiliate links or advertising from other websites, however we are not responsible or liable for any actions of other websites. Investing in Cryptocurrencies involves a great deal of risk, including the loss of all your investment, as well as emotional distress.