What to watch this week
Summary
- Technical Outlook: Medium Term Bullish, Short Term Bearish
- Fundamental Outlook 1: Three big likely market drivers this week the top calendar events to monitor
- Fundamental Outlook 2: Top calendar events to watch
Health issues keep this week’s post short.
Technical Picture: Medium Term Bullish, Short Term BearishWe look at the technical picture first for a number of reasons, including:
Chart Don’t Lie: Dramatic headlines and dominant news themes don’t necessarily move markets. Price action is critical for understanding what events and developments are and are not actually driving markets. There’s nothing like flat or trendless price action to tell you to discount seemingly dramatic headlines – or to get you thinking about why a given risk is not being priced in
Charts Also Move Markets: Support, resistance, and momentum indicators also move markets, especially in the absence of surprises from top tier news and economic reports. For example, the stronger a given support or resistance level, the more likely a trend is to pause at that point. Similarly, a confirmed break above key resistance makes traders much more receptive to positive news that provides an excuse to trade in that direction.
Indexes Are Good Overall Barometers. Their usual positive correlation with other risk assets, and negative correlation with safe haven assets, makes them good overall barometers of what different asset classes are doing.
Overall Risk Appetite Medium Term Per Weekly Charts Of Leading Global Stock Indexes
Weekly Charts Of Large Cap Global Indexes May 26 2013 – Present: With 10 Week/200 Day EMA In Red: LEFT COLUMN TOP TO BOTTOM: S&P 500, DJ 30, FTSE 100, MIDDLE: CAC 40, DJ EUR 50, DAX 30, RIGHT: HANG SENG, MSCI TAIWAN, NIKKEI 225
Key For S&P 500, DJ EUR 50, Nikkei 225 Weekly Chart: 10 Week EMA Dark Blue, 20 WEEK EMA Yellow, 50 WEEK EMA Red, 100 WEEK EMA Light Blue, 200 WEEK EMA Violet, DOUBLE BOLLINGER BANDS: Normal 2 Standard Deviations Green, 1 Standard Deviation Orange.
Source: MetaQuotes Software Corp, www.fxempire.com, www.thesensibleguidetoforex.com
01 Sep. 14 10.45
Key Points
US Indexes: Last week’s minor pullback brings them to the lower end of their double Bollinger® band buy zones, meaning they’re at the brink of losing medium term upward momentum. Uptrends are obviously still quite solid, so at this point there’s nothing more than a normal correction within a longer term uptrend. Though as we note below with the daily charts, short term deterioration puts the odds in favor of further downside next week, from a purely technical perspective. That said, with so many top tier events that could move markets, the coming weeks’ direction for indexes in general is mostly dependent on the outcomes from these events.
European Indexes: Last week’s pullback put them back into their double Bollinger® band neutral zone, suggesting flat trading ranges in the weeks ahead. Otherwise, the same comments apply.
Asian Indexes: A mixed bag, mostly following the US and EU lower. There were a few exceptions based on local market conditions. Japan’s Nikkei was up on Yen weakness (due to USD strength) which is seen as supportive of this exporter-heavy index. So too was Shanghai, which rose as low inflation figures raised stimulus hopes.
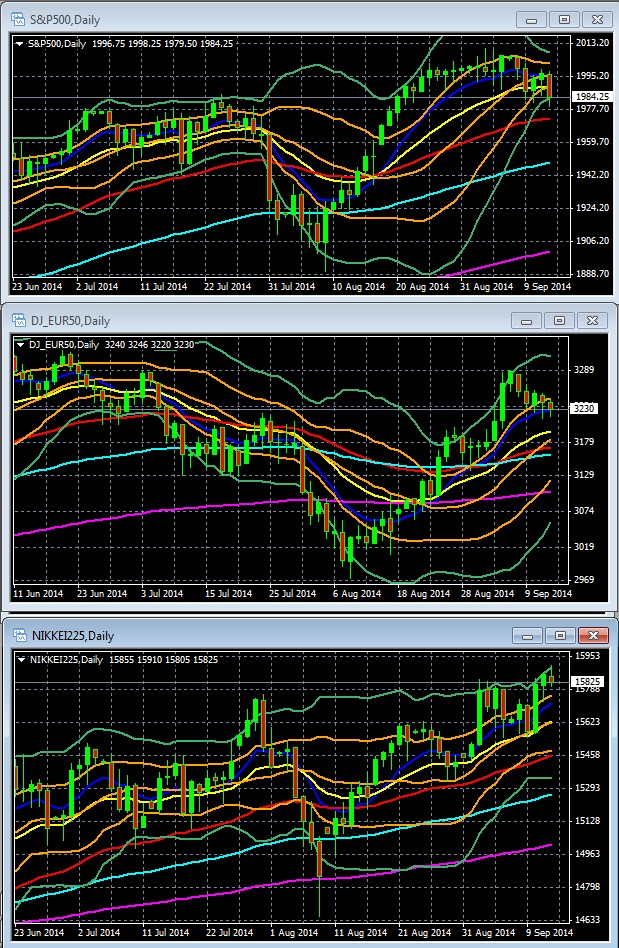
Overall Risk Appetite Short Term Per Daily Charts Of Leading Global Stock Indexes
Recommended Content
Editors’ Picks

EUR/USD consolidates weekly gains above 1.1150
EUR/USD moves up and down in a narrow channel slightly above 1.1150 on Friday. In the absence of high-tier macroeconomic data releases, comments from central bank officials and the risk mood could drive the pair's action heading into the weekend.

GBP/USD stabilizes near 1.3300, looks to post strong weekly gains
GBP/USD trades modestly higher on the day near 1.3300, supported by the upbeat UK Retail Sales data for August. The pair remains on track to end the week, which featured Fed and BoE policy decisions, with strong gains.

Gold extends rally to new record-high above $2,610
Gold (XAU/USD) preserves its bullish momentum and trades at a new all-time high above $2,610 on Friday. Heightened expectations that global central banks will follow the Fed in easing policy and slashing rates lift XAU/USD.

Week ahead – SNB to cut again, RBA to stand pat, PCE inflation also on tap
SNB is expected to ease for third time; might cut by 50bps. RBA to hold rates but could turn less hawkish as CPI falls. After inaugural Fed cut, attention turns to PCE inflation.

Bank of Japan set to keep rates on hold after July’s hike shocked markets
The Bank of Japan is expected to keep its short-term interest rate target between 0.15% and 0.25% on Friday, following the conclusion of its two-day monetary policy review. The decision is set to be announced during the early Asian session.

Moneta Markets review 2024: All you need to know
VERIFIED In this review, the FXStreet team provides an independent and thorough analysis based on direct testing and real experiences with Moneta Markets – an excellent broker for novice to intermediate forex traders who want to broaden their knowledge base.

