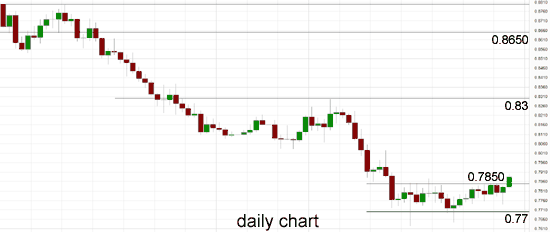
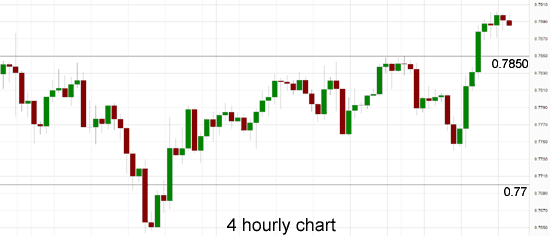
In the last couple of days the Australian dollar has sprung to life and moved through the resistance at 0.7850 to reach a new four week high around 0.7900. For the last few weeks the Australian dollar has steadied well and traded in a narrow range between support at 0.77 and 0.78, although to finish out last week it rallied higher to a two week high near 0.7850. To start this new week it has slowly eased back a little from resistance at 0.7850 however it is finally made its way through there. It has enjoyed receiving solid support from the 0.77 level throughout this time. A couple of weeks ago it rallied a little higher again back towards 0.78 however it then eased back to receive more support from 0.77. A few weeks ago the Australian dollar was on a roller-coaster ride dropping sharply to a new multi-year low below 0.7630 before rallying strongly and moving back up above the 0.77 level and more recently 0.78. In the second half of January, the Australian dollar fell very sharply and break lower from the trading range that had been established roughly between 0.8050 and 0.8200.
About a month ago it made numerous attempts at the resistance level at 0.82 only to be sent back often before finally finishing that week moving through this key level. In doing so it was able to reach a one month high near 0.83 before being sold back down again towards 0.82 as the resistance and selling activity above this level kicked in. Over the Christmas / New Year period, the Australian dollar seemed to have been content with trading in a narrow range below the resistance at 0.82, which continues to remain a key level as it is presently provides resistance. The Australian dollar experienced a disappointing November and December moving from resistance around 0.88 down to the new lows recently. For a couple of months from September through to November, the Australian dollar did well to stop the bleeding and trade within a range between 0.8650 and 0.88 after experiencing a sharp decline throughout September which saw it move from close to 0.94 down to below 0.8650.
Back at the beginning of September the Australian dollar showed some positive signs as it surged higher again bouncing off support below 0.93 and reaching a new four week high around 0.94 however that all now seems a distant memory. It seems a long way away now but the Australian dollar reached a three week high just shy of 0.9480 at the end of July after it enjoyed a solid period which saw it surge higher through the resistance level at 0.9425 to the three week around 0.9480, before easing back towards that level. The Australian dollar enjoyed a solid surge higher reaching a new eight month high above 0.95 at the end of June, only to return most of its gains in very quick time to finish out that week. Since the middle of June the Australian dollar has made repeated attempts to break through the resistance level around 0.9425, however despite its best efforts it was rejected every time as the key level continued to stand tall, even though it has allowed the small excursion to above 0.95.
The Reserve Bank of Australia’s (RBA) claim that the Australian dollar is overvalued is not only wrong, it’s disingenuous, according to new research by National Australia Bank. “We’re taking issue with the contention that the RBA continues to repeat that the Australian dollar remains fundamentally overvalued, in particular with relation to the weakness in commodity prices,” Ray Attrill, co-head of FX Strategy at National Australia Bank (NAB), told CNBC. In the RBA’s recent monthly policy statements, the central bank frequently stated that the currency “remains above estimates of its fundamental value, given the significant declines in key commodity prices,” particularly Brent crude’s 40 percent decline over the past six months and a decline in iron ore prices to a six-year low. Fair value, according to RBA governor Glenn Stevens, is 75 U.S. cents – a 4 percent decrease from current levels.
(Daily chart / 4 hourly chart below)
AUD/USD February 25 at 21:50 GMT 0.7886 H: 0.7901 L: 0.7824
AUD/USD Technical

During the early hours of the Asian trading session on Thursday, the AUD/USD is easing back a little under 0.7900 after moving to a four week high around 0.7900 in the last 24 hours. Current range: trading right below 0.7900 around 0.7890.
Further levels in both directions:
- Below: 0.7700.
- Above: 0.7900, 0.8200, and 0.8650.
Recommended Content
Editors’ Picks
EUR/USD holds below 1.0750 ahead of key US data

EUR/USD trades in a tight range below 1.0750 in the European session on Friday. The US Dollar struggles to gather strength ahead of key PCE Price Index data, the Fed's preferred gauge of inflation, and helps the pair hold its ground.
USD/JPY stays firm above 156.00 after BoJ Governor Ueda's comments

USD/JPY stays firm above 156.00 after surging above this level on the Bank of Japan's decision to leave the policy settings unchanged. BoJ Governor said weak Yen was not impacting prices but added that they will watch FX developments closely.
Gold price oscillates in a range as the focus remains glued to the US PCE Price Index

Gold price struggles to attract any meaningful buyers amid the emergence of fresh USD buying. Bets that the Fed will keep rates higher for longer amid sticky inflation help revive the USD demand.
Bitcoin Weekly Forecast: BTC’s next breakout could propel it to $80,000 Premium

Bitcoin’s recent price consolidation could be nearing its end as technical indicators and on-chain metrics suggest a potential upward breakout. However, this move would not be straightforward and could punish impatient investors.
US core PCE inflation set to signal firm price pressures as markets delay Federal Reserve rate cut bets

The core PCE Price Index, which excludes volatile food and energy prices, is seen as the more influential measure of inflation in terms of Fed positioning. The index is forecast to rise 0.3% on a monthly basis in March, matching February’s increase.

