![]() Matthew Ashley
Matthew Ashley
Blackwell Global Investments Limited
The EUR has been struggling to keep a grip on its recent gains on the GBP as the UK begins to post some heartening economic results. As a result, there is now scope to see the EURGBP take a modest tumble after it makes a corrective movement back to the upside of the bearish channel. Additionally, EMA indicators are signalling that the Bullish trend that has dominated the chart recently could be taking a breather.
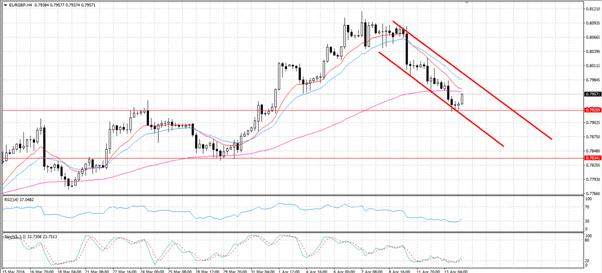
Firstly, the H4 chart shows the pair has been bouncing along the downside constraint since the beginning of the week. However, the pair has now found support at the 161.8% Fibonacci retracement around the 0.7925 mark. Consequently, the EURGBP has begun making its move back to the centre of the bearish channel and is potentially even having a go at the upside constraint. Furthermore, both stochastic and RSI oscillators are currently reading as oversold which will help supply some pressure to move the pair back within the channel.
Whilst the corrective move away from the lower constraint of the channel may temporarily push the pair higher, in the long term, there is potential to see the EUR cede more ground to the Pound. Specifically, the EMA’s on the H4 chart paint a fairly compelling picture as to why the pair might have an appreciable fall in the near future. As shown, the 20 Period EMA is still signalling the pair is in a downtrend as it is well above the 12 period EMA. Additionally and potentially more importantly, the two shorter EMA’s are on the verge of having a crossover with the 100 period EMA. This intersection could very well signal that the EUR is about to take a tumble against the GBP.
Additionally, after the EMA’s have converged, the 100 period EMA will cease to act as dynamic support and will become a new dynamic resistance for the pair. Consequently, the EURGBP should then follow the 12, 20, and 100 period EMA’s downwards until finding a strong support at 0.7848. This level represents another Fibonacci retracement for the pair and has been tested before.
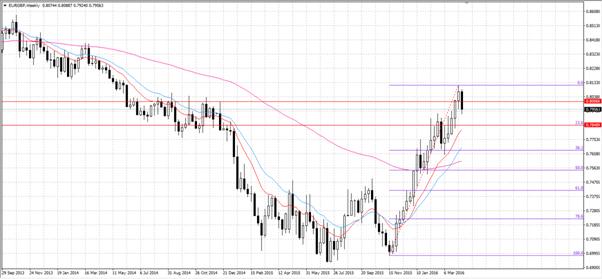
Furthermore, by looking at a weekly chart it is evident that the pair has recently encountered long-term resistance around the 0.8006 level. Therefore, the pair should be moving back to a long-term support zone. As shown on the weekly chart, the 0.7848 zone of support coincides with the 23.6% Fibonacci retracement level and is likely to be the next strong support for the pair. Collectively, the evidence seems to indicate that the pair could go lower, provided the UK can maintain some positive fundamental results in the coming weeks.
Ultimately, the current downturn could simply be a corrective movement within the greater bullish trend. However, appreciable improvements in UK economic indicators could finally be beginning to stack up and end the long-running Euro gains. If this is indeed the case, EUR bears might finally have something to look forward to. However, it is important to note that the potential for this to be a corrective movement remains high which could see a strong reversal if the pair hits the 0.7848 support.
Forex and CFDs are leveraged financial instruments. Trading on such leveraged products carries a high level of risk and may not be suitable for all investors. Please ensure that you read and fully understand the Risk Disclosure Policy before entering any transaction with Blackwell Global Investments Limited.
Recommended Content
Editors’ Picks
EUR/USD holds below 1.0750 ahead of key US data

EUR/USD trades in a tight range below 1.0750 in the European session on Friday. The US Dollar struggles to gather strength ahead of key PCE Price Index data, the Fed's preferred gauge of inflation, and helps the pair hold its ground.
USD/JPY stays firm above 156.00 after BoJ Governor Ueda's comments

USD/JPY stays firm above 156.00 after surging above this level on the Bank of Japan's decision to leave the policy settings unchanged. BoJ Governor said weak Yen was not impacting prices but added that they will watch FX developments closely.
Gold price oscillates in a range as the focus remains glued to the US PCE Price Index

Gold price struggles to attract any meaningful buyers amid the emergence of fresh USD buying. Bets that the Fed will keep rates higher for longer amid sticky inflation help revive the USD demand.
Bitcoin Weekly Forecast: BTC’s next breakout could propel it to $80,000 Premium

Bitcoin’s recent price consolidation could be nearing its end as technical indicators and on-chain metrics suggest a potential upward breakout. However, this move would not be straightforward and could punish impatient investors.
US core PCE inflation set to signal firm price pressures as markets delay Federal Reserve rate cut bets

The core PCE Price Index, which excludes volatile food and energy prices, is seen as the more influential measure of inflation in terms of Fed positioning. The index is forecast to rise 0.3% on a monthly basis in March, matching February’s increase.