![]()
Undoubtedly, a growing number of people – myself included – are no longer expecting the current oil market imbalance to correct itself as fast as it had appeared to be the case up until a week ago. Several things have changed in recent days, not least for example the International Energy Agency’s (IEA) latest outlook with the oil forecaster no longer envisaging strong demand growth in 2016. The IEA also expects global supply to remain excessive throughout next year due to the anticipated arrival of Iranian oil flooding the market. Indeed, judging by the latest macro data from the world’s largest oil consumers, the EIA’s demand forecasts do not look to be too bearish after all. Speculators are acknowledging the fact that the Chinese economy is slowing down while growth in the US appears to have weakened, hence the heightened expectations of more central bank support in China and reduced probabilities of a Federal Reserve rate increase in 2015.
In addition, news of the renewed sharp builds in US crude inventories is also chipping away at bullish expectations. After a 7.1 million barrel increase over the previous couple of weeks, the market was anticipating to see a more subdued build of 2.2 million this time in the weekly crude stocks data from the US Energy Information Administration (EIA). However, as it turned out, US crude inventories actually increased by a surprisingly large 7.6 million barrels last week. This was a much bigger build than expected but was nevertheless lower than the 9.4 million-barrel-increase that was reported by the American Petroleum Institute (API) on Tuesday evening. Consequently WTI initially extended its falls before recovering slightly.
While the crude stocks build can be blamed on seasonal factors as refineries process less oil because of maintenance work after the summer driving season, the fact that inventories increased this sharply suggests output still growing more strongly than expected. Still, with the rig counts showing consistent falls in recent weeks, oil production should continue to fall back and eventually the surplus should be reduced by a meaningful margin to cause prices to bounce back. So it is difficult to say why oil prices should fall significantly further than they already have.
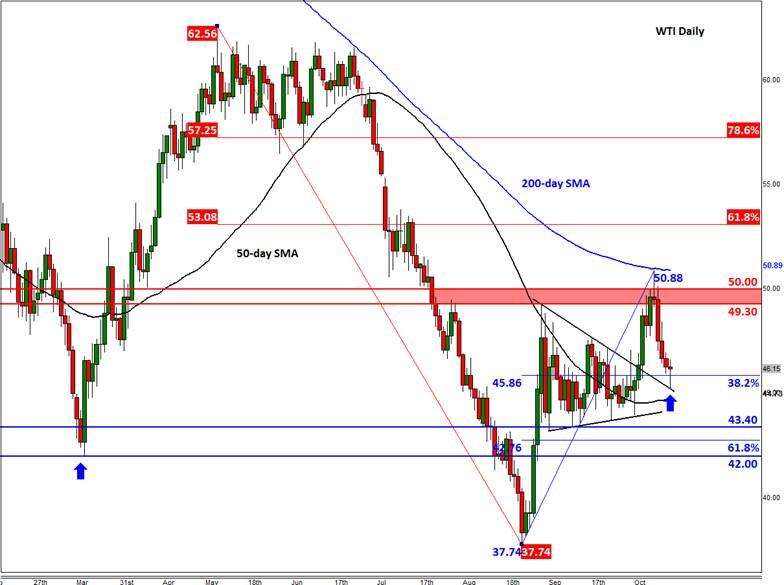
Indeed, the technical reversal signal that we saw at the end of August i.e. the false break below $42, which suggests crude may have bottomed out, has not been entirely invalidated yet. While the 5-day sell-off was not what the bulls would have expected to see following the latest breakout from a triangle consolidation pattern, the fact that WTI has now managed to bounce off the backside of the triangle’s broken resistance trend can be an encouraging sign for the bulls. So, it is possible that another upward move could start from here. Even if WTI retraces a little further, the bulls would still remain optimistic that the next big move would be to the upside. However an eventual closing break below that pivotal $42 handle would be a bearish outcome and if we see that then I wouldn’t be surprised if oil goes down to $35 or who knows even $30 a barrel next.
Trading leveraged products such as FX, CFDs and Spread Bets carry a high level of risk which means you could lose your capital and is therefore not suitable for all investors. All of this website’s contents and information provided by Fawad Razaqzada elsewhere, such as on telegram and other social channels, including news, opinions, market analyses, trade ideas, trade signals or other information are solely provided as general market commentary and do not constitute a recommendation or investment advice. Please ensure you fully understand the risks involved by reading our disclaimer, terms and policies.
Recommended Content
Editors’ Picks
EUR/USD holds below 1.0750 ahead of key US data

EUR/USD trades in a tight range below 1.0750 in the European session on Friday. The US Dollar struggles to gather strength ahead of key PCE Price Index data, the Fed's preferred gauge of inflation, and helps the pair hold its ground.
GBP/USD consolidates above 1.2500, eyes on US PCE data

GBP/USD fluctuates at around 1.2500 in the European session on Friday following the three-day rebound. The PCE inflation data for March will be watched closely by market participants later in the day.
Gold clings to modest daily gains at around $2,350

Gold stays in positive territory at around $2,350 after closing in positive territory on Thursday. The benchmark 10-year US Treasury bond yield edges lower ahead of US PCE Price Index data, allowing XAU/USD to stretch higher.
Bitcoin Weekly Forecast: BTC’s next breakout could propel it to $80,000 Premium

Bitcoin’s recent price consolidation could be nearing its end as technical indicators and on-chain metrics suggest a potential upward breakout. However, this move would not be straightforward and could punish impatient investors.
US core PCE inflation set to signal firm price pressures as markets delay Federal Reserve rate cut bets

The core PCE Price Index, which excludes volatile food and energy prices, is seen as the more influential measure of inflation in terms of Fed positioning. The index is forecast to rise 0.3% on a monthly basis in March, matching February’s increase.
