S&P 500 (cash) near term outlook:
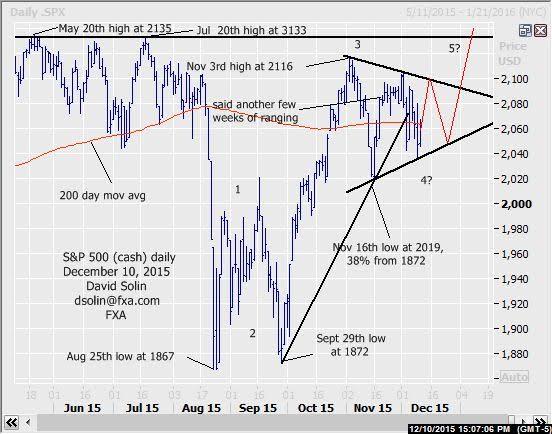
Back in the Nov 19th email, said there was scope for at least another few weeks of ranging before resuming the upmove above that Nov 3rd high at 2116. The market has indeed chopped since, seen forming a triangle/pennant over that time. These are viewed as continuation patterns (wave 4 in the rally from the Aug 25th low at 1867), and with an eventual resumption of the gains above that 2116 high after (within wave 5, see "ideal" scenario in red on daily chart below). A couple of notes, these patterns generally resolve sharply, but occur before the final leg in a larger trend (higher in this case). So this upside resolution and even break above those July/May highs at 2135 (if it does indeed occur), may be more of a relatively short-lived spike (last gasp higher) before completing a top (and potentially more major top, see longer term below). However, a downside resolution would argue that the market remains within that larger 1867/2135 that has been in place since May, and with at least another few months of wide ranging likely ahead. Nearby support is seen at the bullish trendline/base of the triangle/pennant (currently at 2034/37), resistance is seen at the ceiling (currently at 2100/03). Bottom line : upside resolution of triangle/pennant since Nov 3rd favored, but may be more of a short-lived, "last gasp" higher.
Strategy/position:
With an eventual upside resolution of the triangle/pennant favored, would buy here (currently at 2065) and initially stopping on a close 5 pts below the base of the pattern. However, with an upside resolution potentially more of a short-lived spike, will want to get much more aggressive on such a move higher (to reflect that risk to the position).
Long term outlook:
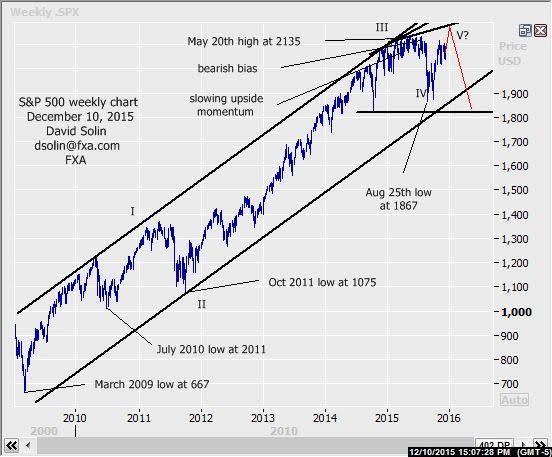
As discussed above, an upside resolution of the triangle since Nov is favored with gains above that May high at 2035. However, such a move may be limited and part of a much longer term topping (see in red on weekly chart/2nd chart below). Note that in addition to being the final upleg in the rally from the Aug 1867 low, the market is also seen within the final upleg in the whole rally from the July 2010 low at 2011 (wave V). Additionally, the slew of previously discussed, longer term negatives remain and include slowing upside momentum over the last year, a long term overbought market after the last few years of sharp gains and fewer and fewer stocks responsible for the upside in the broader averages. This is a common occurrence at major peaks as more and more money flows into fewer and fewer of the higher quality shares, pushing these capitalization weighted indices higher and higher, while the broader market deteriorates (as has been occurring for quite some time). Eventually these broader indices rollover and "catch up", and we may be finally getting closer to that point. Further long term resistance is just above those 2135 highs at the rising trendline from last March (currently at 2175/85) and would be an "ideal" area to form such a peak (see in red on weekly chart/2nd chart below). Bottom line: major topping, but with scope for further period of ranging/topping and even temp gains above the 2130/35 highs as part of the process.
Long term strategy/position:
With an important topping and any further, big picture upside seen limited, would stay with the bearish bias that was put in place on July 16th at 2122.
Recommended Content
Editors’ Picks
EUR/USD edges lower toward 1.0700 post-US PCE

EUR/USD stays under modest bearish pressure but manages to hold above 1.0700 in the American session on Friday. The US Dollar (USD) gathers strength against its rivals after the stronger-than-forecast PCE inflation data, not allowing the pair to gain traction.
GBP/USD retreats to 1.2500 on renewed USD strength

GBP/USD lost its traction and turned negative on the day near 1.2500. Following the stronger-than-expected PCE inflation readings from the US, the USD stays resilient and makes it difficult for the pair to gather recovery momentum.
Gold struggles to hold above $2,350 following US inflation

Gold turned south and declined toward $2,340, erasing a large portion of its daily gains, as the USD benefited from PCE inflation data. The benchmark 10-year US yield, however, stays in negative territory and helps XAU/USD limit its losses.
Bitcoin Weekly Forecast: BTC’s next breakout could propel it to $80,000 Premium

Bitcoin’s recent price consolidation could be nearing its end as technical indicators and on-chain metrics suggest a potential upward breakout. However, this move would not be straightforward and could punish impatient investors.
Week ahead – Hawkish risk as Fed and NFP on tap, Eurozone data eyed too

Fed meets on Wednesday as US inflation stays elevated. Will Friday’s jobs report bring relief or more angst for the markets? Eurozone flash GDP and CPI numbers in focus for the Euro.

