S&P 500 (cash) near term outlook:
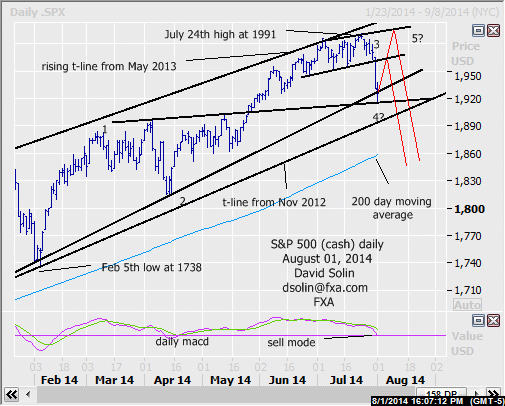
In the July 16 email, warned of the rising risks of top but that there was still no confirmation of a peak. The market pushed to a marginal new high at 1991 on July 24th but has reversed sharply lower since. In the big picture, the market is seen in process of a topping and potentially more major topping (see longer term below). Note that those bigger picture negatives remains and include bearish technicals (see sell mode on the daily macd at bottom of daily chart below), slowing upside momentum over the last number of months, the previously discussed "Bradley" model which peaked near mid July (and tumbles through late Nov) and lots of very long term negatives (see longer term below). However, the upside pattern from the Feb low at 1738 may not be "complete" (currently fall seen as wave 4), there is still no confirmation of a more important top "pattern-wise", and many have quickly jumped on the pullback/correction bandwagon (contrary indicator), with all suggesting at least a near term bounce as part of this larger topping (see in red on daily chart below). Note too that a close back above the earlier broken bullish trendline from Feb (currently at 1920/25) would add to this near term potential (bullish false break). Further support below there is seen at the earlier 1916 low and the bullish trendline from Nov 2012 (currently at 1890/95, would expect this area to provide at good sized bounce if not from the support above). Nearby resistance is seen at the broken bull trendline from late June (currently at 1960/63) and the 1991 high. Bottom line : important topping, but still favor another few weeks of a broader ranging, before a more major move lower is seen.
Near term strategy/position:
Though there is potential for another upleg back toward the highs, no confirmation so far while such a move would be part of a larger topping. So just not seen as a good risk/reward in trying to catch such a bounce here, and would wait for a better entry ahead.
Long term outlook:
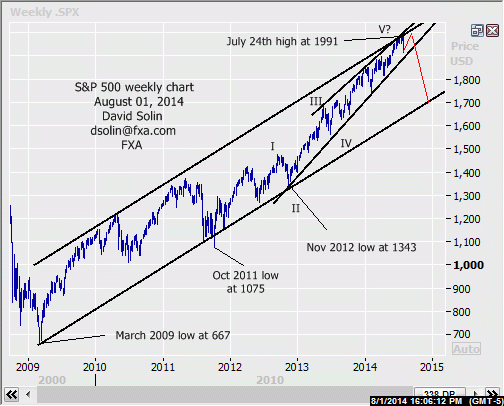
As discussed above, lots of very long term negatives are also evident and suggests an even more major topping (at least 12-18 months). No doubt the market is extremely overbought after the huge surge from the March 2009 low at 667, longer term sentiment is broadly bullish/extreme level of complacency (volatility just starting to perk up from 7 year lows), appear to be within the final upleg in the rally from at least the Oct 2011 low at 1075 (wave V) and the Fed continues to cut back on QE. Additionally, the market is stalling near longer term resistance at the ceiling of the bullish channel since March 2009 (see weekly chart/2nd chart below), an "ideal" area to form a more major top. As discussed above, there is still some risk for further topping but any such gains would likely be limited. Bottom line : a more major top is also seen in process of forming.
Long term strategy/position:
Looking to switch the longer term bias to the bearish side and would be using a nearer term upleg (see shorter term above) to change from neutral.
Current:
- Nearer term: poss upleg back toward the highs as part of a larger topping, but to much risk to get long.
- Last : short Apr 10 at 1861, stopped May 27th at 1912.
- Longer term: potentially more major top nearing, looking to short on further near term topping.
General Risk Warning for stocks, cryptocurrencies, ETP, FX & CFD Trading. Investment assets are leveraged products. Trading related to foreign exchange, commodities, financial indices, stocks, ETP, cryptocurrencies, and other underlying variables carry a high level of risk and can result in the loss of all of your investment. As such, variable investments may not be appropriate for all investors. You should not invest money that you cannot afford to lose. Before deciding to trade, you should become aware of all the risks associated with trading, and seek advice from an independent and suitably licensed financial advisor. Under no circumstances shall Witbrew LLC and associates have any liability to any person or entity for (a) any loss or damage in whole or part caused by, resulting from, or relating to any transactions related to investment trading or (b) any direct, indirect, special, consequential or incidental damages whatsoever.
Recommended Content
Editors’ Picks
EUR/USD trades with negative bias, holds above 1.0700 as traders await US PCE Price Index

EUR/USD edges lower during the Asian session on Friday and moves away from a two-week high, around the 1.0740 area touched the previous day. Spot prices trade around the 1.0725-1.0720 region and remain at the mercy of the US Dollar price dynamics ahead of the crucial US data.
USD/JPY jumps above 156.00 on BoJ's steady policy

USD/JPY has come under intense buying pressure, surging past 156.00 after the Bank of Japan kept the key rate unchanged but tweaked its policy statement. The BoJ maintained its fiscal year 2024 and 2025 core inflation forecasts, disappointing the Japanese Yen buyers.
Gold price flatlines as traders look to US PCE Price Index for some meaningful impetus

Gold price lacks any firm intraday direction and is influenced by a combination of diverging forces. The weaker US GDP print and a rise in US inflation benefit the metal amid subdued USD demand. Hawkish Fed expectations cap the upside as traders await the release of the US PCE Price Index.
Sei Price Prediction: SEI is in the zone of interest after a 10% leap

Sei price has been in recovery mode for almost ten days now, following a fall of almost 65% beginning in mid-March. While the SEI bulls continue to show strength, the uptrend could prove premature as massive bearish sentiment hovers above the altcoin’s price.
US core PCE inflation set to signal firm price pressures as markets delay Federal Reserve rate cut bets

The core PCE Price Index, which excludes volatile food and energy prices, is seen as the more influential measure of inflation in terms of Fed positioning. The index is forecast to rise 0.3% on a monthly basis in March, matching February’s increase.

