![]() HY Markets Research Team
HY Markets Research Team
HY Markets
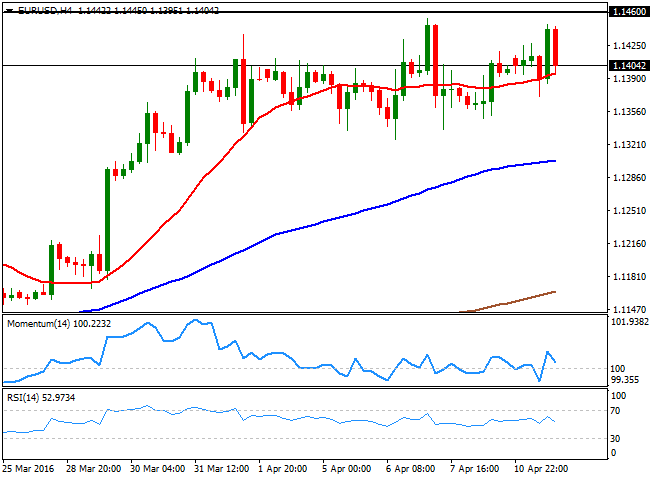
EUR/USD
Risk aversion led the way at the beginning of the day, favoring the most the JPY, as Chinese March inflation fell by 0.4%, while recording a softerthanexpected 2.3% compared to a year before. The Producer Price index, however, offered an upward surprise, as it fell less than expected, printing 4.3% yearonyear against previous 4.9%. But sentiment turned positive during the European morning, as local share markets opened with a strong footing to finally close in the green. The EUR/USD pair advanced up to 1.1447 in a lackluster start to the week, but the pair was again rejected by selling interest around the 1.1460 region, a strong static resistance area. The short term picture is neutral, as the pair has been stuck between 1.1330 and 1.1460 for over a week now, but the longer term perspective still favors the upside. In the 4 hours chart, the pair is slightly above a horizontal 20 SMA, whilst the technical indicators have lost upward strength after entering positive territory, with no actual directional strength. Stop beyond the mentioned 1.1460 critical resistance are suspected to be large, which means that if they got triggered, the pair can rally up to 1.1500 beyond.
Support levels: 1.1370 1.1330 1.1280
Resistance levels: 1.1420 1.1460 1.1500
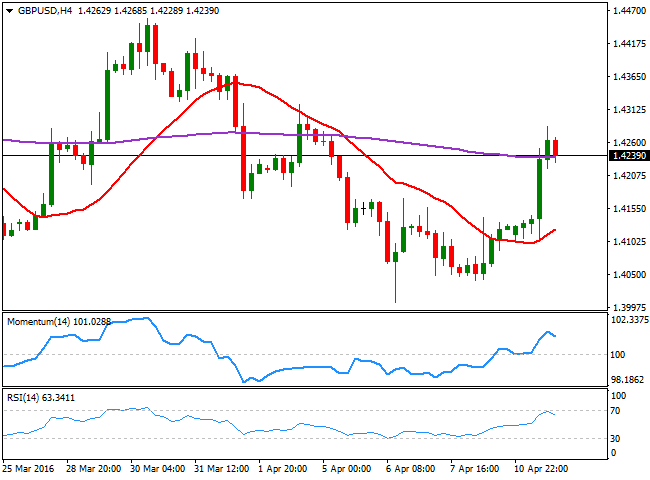
GBP/USD
The British Pound enjoyed of some strong demand after London's opening, tracking local share markets' positive opening, and the GBP/USD pair advanced up to 1.4285, erasing all of the previous week losses. The UK will release its CPI and PPI figures early Tuesday, generally expected to have improved in March, compared to the previous month. An uptick in inflation indeed can help the pair to recover further, as Pound's latest decline, blamed on Brexit fears, seems to be overstretched, considering the dollar's underlying negative tone. The pair retreated partially from the mentioned high, overbought in the short term after adding around 180 pips daily basis. The technical picture however, keeps favoring the upside, as in the 1 hour chart, the technical indicators are resuming their advances well into positive territory and after correcting extreme readings. In the 4 hours chart, the price is currently above a horizontal 20 SMA, while the 20 SMA is gaining bullish strength in the 1.4120 region, not enough to suggest a stepper recovery. In the same chart, the technical indicators have turned south within positive territory, but hold far above their midlines, suggesting the pair may enter a consolidative phase, and even retreat some, before attempting a new upward move.
Support levels: 1.4190 1.4150 1.4100
Resistance levels: 1.4285 1.4330 1.4370
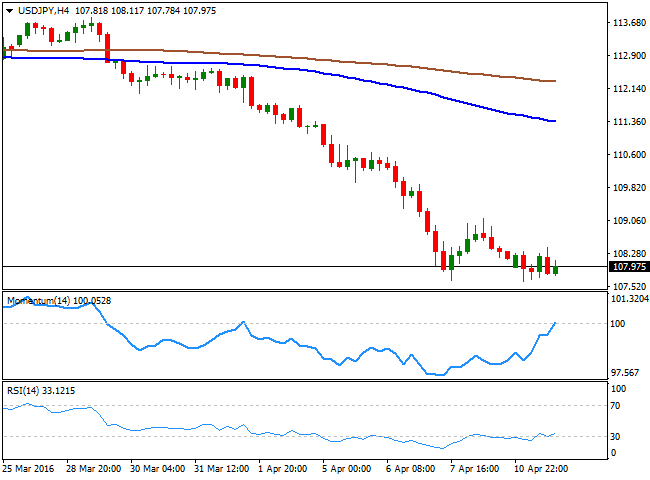
USD/JPY
The Japanese yen extended its advance to a fresh multimonth high against its American rival, with the USD/JPY bouncing from 107.62, after BOJ's Governor Kuroda said that the Central Bank is monitoring exchange levels, and that they will add further stimulus without hesitation if needed. The intraday recovery in the pair reached 108.43 in the American afternoon, but it retreated back below the 108.00 figure, where it stands ahead of the Asian opening. Overall, the downside remains favored, both short and long term, given broad dollar's weakness and limited expectations of a US rate hike. In the 1 hour chart, the technical indicators have corrected oversold readings whilst the price remained range bound, a clear sign that bears are still in the driver's seat. In the same chart, the 100 SMA heads sharply lower around 109.00, offering a strong dynamic resistance in the case of a sudden recovery. In the 4 hours chart, the Momentum indicator presents a strong upward slope around its 100 level, whilst the RSI indicator keeps hovering around 32, but only an extension beyond the mentioned 109.00 region will offer a more upward constructive outlook for the pair.
Support levels: 107.65 107.30 106.90
Resistance levels: 108.45 109.90 109.35
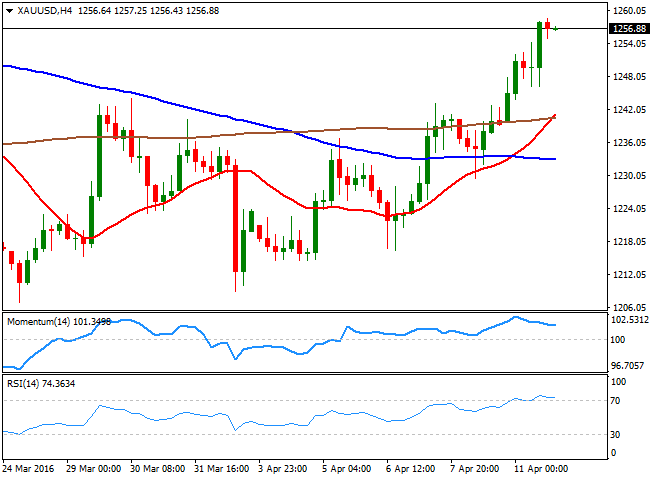
GOLD
Spot gold surged to a fresh 3week high of $1,258.66 a troy ounce this Monday, fueled by a weaker dollar and reduced possibilities of a US rate hike as the FED remains dovish. Gold for June delivery settled roughly 1.0% higher and trades around 1,256.20 ahead of the Asian opening, barely below the mentioned daily high. From a technical point of view, the commodity is poised to extend its advance, as in the daily chart, the price has extended further above its 20 SMA, while the technical indicators head north well above their midlines, supporting some further gains for this Tuesday. In the 4 hours chart, the 20 SMA has crossed above the 100 and 200 SMA well below the current level, whilst the Momentum indicator has turned lower within positive territory and the RSI indicator lost upward potential, but remains within overbought levels, suggesting the metal may consolidate some before resuming its advance, particularly on a break above the mentioned daily high.
Support levels: 1,252.05 1,241.90 1,233.70
Resistance levels: 1,258.90 1,266.90 1,271.80
WTI CRUDE
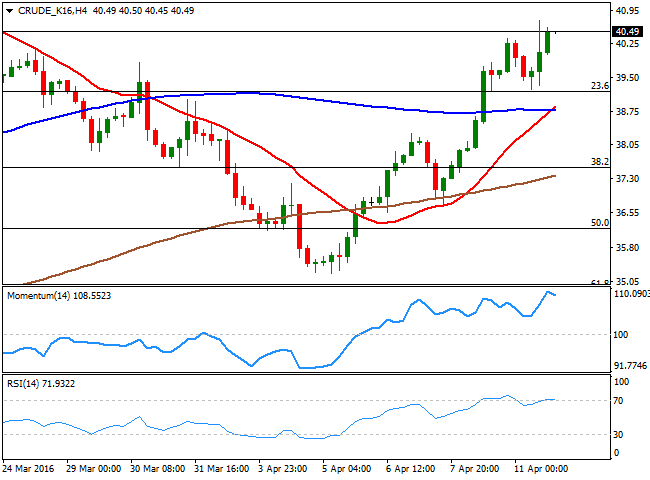
Oil futures rose this Monday, with the US benchmark closing above $40.00 a barrel for the first time since March 22nd, while Brent crude futures closed the day near $43.00 a barrel, its highest since December 2015. The black gold was supported by a US government forecast saying that US shale oil production is expected to fall for a seventh month in a row in May, boosting hopes of a sooner end to the global glut that has kept prices depressed for over a year now. Ahead of oil producers meeting in Doha next Sunday, the daily chart for WTI shows that the commodity settled above its 200 SMA, for the first time in almost a month, while the technical indicators hold flat within positive territory, lacking enough momentum to confirm further advances. In the 4 hours chart, the technical indicators are retreating partially within overbought levels, whilst the 20 SMA accelerated its advance below the current level, and now converges with the 100 SMA at 39.10, providing a strong dynamic support in the case of a downward move.
Support levels: 39.80 39.10 38.45
Resistance levels: 40.80 41.50 42.30
DAX
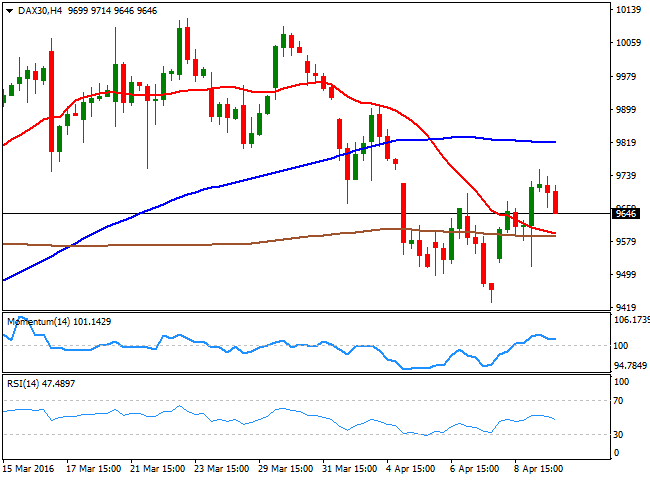
European stocks closed the day mostly higher, as a recovery in oil prices resulted in an improvement in market sentiment from the riskaverse sentiment seen during the Asian session, resulting in the DAX closing the day 0.63% higher at 9,682.99. With no data on the deck, however, local share markets´ gains were limited, and even turned lower in afterhours trading, as Wall Street failed to hold on to early gains. The German benchmark daily chart shows that the technical indicators remain within bearish territory, but also that the index posted a higher high daily basis, showing that somehow, the downside pressure is beginning to ease. Nevertheless, the index continues trading below its DMAs, with the 20 DMA currently around 9,844, being the level to break to support additional gains. In the shorter term, the 4 hours chart presents a neutral stance, as the index is hovering between its 100 and 200 SMAs, both flat, while the technical indicators turned lower within neutral territory.
Support levels: 9,581 9,526 9,432
Resistance levels: 9,680 9,754 9,850
DOW JONES
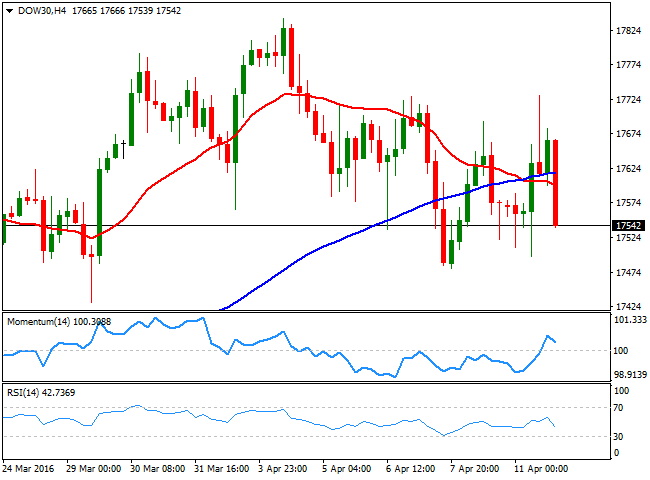
Wall Street edged lower at the beginning of the week, with all of the three major indexes closing in the red after trading higher for most of the session. The DJIA lost 20 points and closed the day at 17,556.41, whilst the Nasdaq and the SandP lost 0.36% and 0.27% respectively. US stocks started the day with a strong note, and even attempted to break to new highs, but turned lower ahead of the close, on rising uncertainty ahead of the beginning of earnings seasons. The DJIA daily chart shows that the index failed to recover above its 20 SMA, despite an intraday advance beyond it, whilst the technical indicators remain within neutral territory, as the index closed inside Friday's range. In the shorter term, the 4 hours chart shows that the index continues moving back and forth around a mild bearish 20 SMA, whilst the Momentum indicator turned lower above its 100 level, and the RSI heads south around 42, this last anticipating some further declines, particularly on a break below 17,479, past week low.
Support levels: 17,530 17,479 17,396
Resistance levels: 17,615 17,653 17,717
FTSE 100
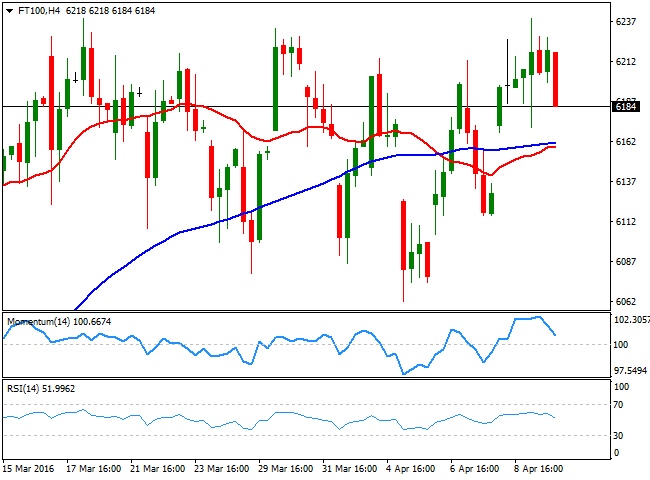
The Footsie retreated from its recent highs and closed 4 points lower at 6,200.12, in quite a choppy trading session due to the lack of a fundamental trigger. Mining and oilrelated shares, however, traded higher as commodities surged, with Anglo American up by 6.93% and Glencore by 3.44%. From a technical point of view, the daily chart shows that the index retreated from its 200 DMA, yet also that the technical indicators remain stuck around their midlines, as the index remains confined to a welllimited range for third week inarow. In the 4 hours chart, the 20 and 100 SMAs converge at 6,160, both flat, indicating no certain directional strength, but favoring the upside. The technical indicators in this last time frame have turned south and approach their midlines, but also lack momentum, suggesting the index will remain range bound, a situation that may extend until late June, when the UK referendum over remaining within the EU will give a clearer picture of the UK economic future.
Support levels: 6,160 6,104 6,062
Resistance levels: 6,232 6,285 6,340
The information set forth herein was obtained from sources which we believe to be reliable, but its accuracy cannot be guaranteed. It is not intended to be an offer, or the solicitation of any offer, to buy or sell the products or instruments referred herein. Any person placing reliance on this commentary to undertake trading does so entirely at their own risk.
Recommended Content
Editors’ Picks

EUR/USD consolidates weekly gains above 1.1150
EUR/USD moves up and down in a narrow channel slightly above 1.1150 on Friday. In the absence of high-tier macroeconomic data releases, comments from central bank officials and the risk mood could drive the pair's action heading into the weekend.

GBP/USD stabilizes near 1.3300, looks to post strong weekly gains
GBP/USD trades modestly higher on the day near 1.3300, supported by the upbeat UK Retail Sales data for August. The pair remains on track to end the week, which featured Fed and BoE policy decisions, with strong gains.

Gold extends rally to new record-high above $2,610
Gold (XAU/USD) preserves its bullish momentum and trades at a new all-time high above $2,610 on Friday. Heightened expectations that global central banks will follow the Fed in easing policy and slashing rates lift XAU/USD.

Week ahead – SNB to cut again, RBA to stand pat, PCE inflation also on tap
SNB is expected to ease for third time; might cut by 50bps. RBA to hold rates but could turn less hawkish as CPI falls. After inaugural Fed cut, attention turns to PCE inflation.

Bank of Japan set to keep rates on hold after July’s hike shocked markets
The Bank of Japan is expected to keep its short-term interest rate target between 0.15% and 0.25% on Friday, following the conclusion of its two-day monetary policy review. The decision is set to be announced during the early Asian session.

Moneta Markets review 2024: All you need to know
VERIFIED In this review, the FXStreet team provides an independent and thorough analysis based on direct testing and real experiences with Moneta Markets – an excellent broker for novice to intermediate forex traders who want to broaden their knowledge base.