EUR/USD
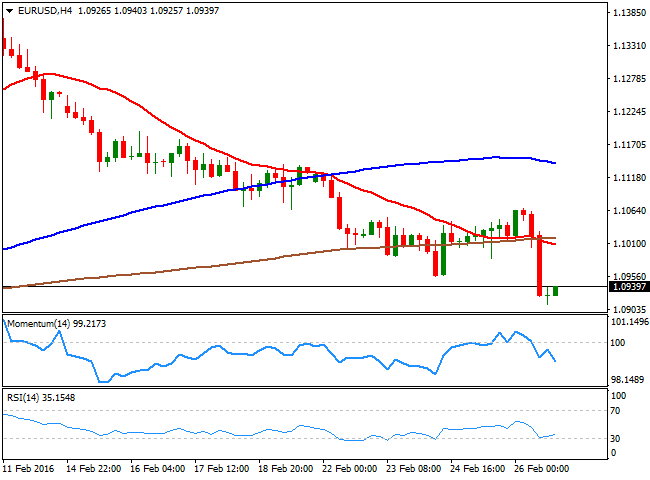
The second revision of the US Q4 2015 rocked the forex board on Friday, by printing 1.0% well above the 0.4% expected. The American dollar closed the week broadly higher across the board, helped also by easing risk aversion, and economic woes in other major economies: earlier in the week, European PMIs' came out well below previous readings and market's expectations. Also, the UK set a date for the Brexit referendum, reviving fears of an excision in the union, and sending the Pound to its lowest in nearly 6 years. The EUR/USD pair fell towards the 1.0900 region, and according to the technical picture, further slides are to be seen, as the daily chart presents a clear bearish bias, as the price has accelerated its decline below its 20 SMA, whilst being capped by the 200 SMA for most of this past week. The 100 SMA in the same chart is the last standing man, around 1.0895, the immediate support for this week. In the same chart, the technical indicators head firmly lower within bearish territory, indicating a continued decline is most likely. Shorter term, the 4 hours chart shows that the price remains near its Friday low at 1.0911, and below its moving averages, while the Momentum indicator continues heading south. The RSI indicator in this last time frame has posted a tepid bounce from oversold readings, but rather reflecting the latest recovery than suggesting an upward move in the short term. Some intraday lows around 1.0960 should offer resistance in the case of further advances, with a clear recovery above the level required to support the upward correction case.
Support levels:1.0895 1.0850 1.0810
Resistance levels: 1.0960 1.1000 1.1045
GBP/USD
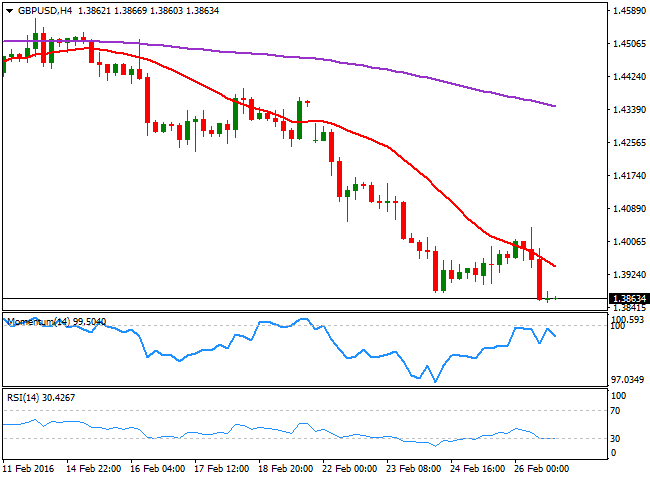
The British Pound shed over 3% against the greenback last week, breaking below the 1.400 figure for the first time since March 2009, on mounting concerns over the UK referendum on its EU membership, which has been set for June 23rd. Mid February, the EU reform deal was expected to ease the pressure over a possible Brexit, but concerns returned last week, whilst the strong US GDP upward revision did the rest. The GBP/USD pair is currently trading at 1.3863, a handful of pips above the multiyear low set at 1.3852, maintaining a strong negative technical tone. Done for a second week inarow, the daily chart shows that the technical indicators maintain their bearish momentum, despite being in oversold territory, whilst the 20 SMA has turned south, but far above the current level, around 1.4320. In the 4 hours chart, a sharply bearish 20 SMA continues leading the way south, offering a dynamic resistance, now around 1.3940, whilst the Momentum indicator has been rejected from its 100 level and the RSI indicator consolidates in oversold territory, all of which supports the longer term outlook.
Support levels: 1.3850 1.3315 1.3770
Resistance levels: 1.3895 1.3940 1.3985
USD/JPY
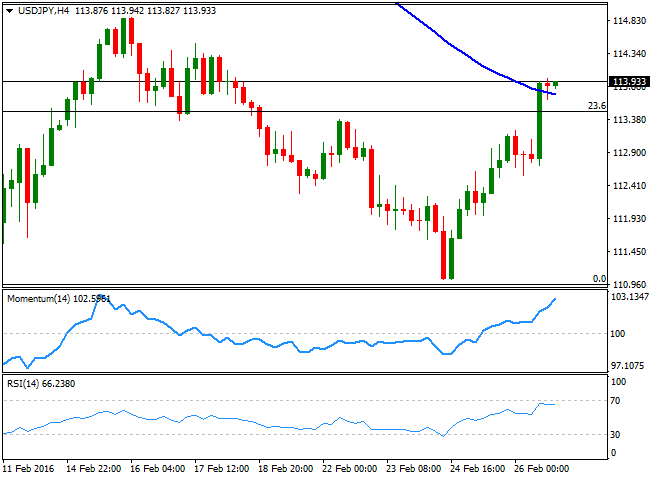
The USD/JPY pair closed the week with nice gains at 113.93, helped by positive US data, which sent riskaversion trading to the backstage. Nevertheless, the pair is far from recovering its postBOJ's losses, as it remains well below the 38.2% retracement of such slump, at 115.05. Also, helping the pair's advance is renewed speculation that the Japanese Central Bank may announce further stimulus measures during its upcoming meetings. From a technical point of view, the daily chart shows a double floor developing, with the neckline at February 16th daily high at 114.87. With the mentioned Fibonacci resistance barely above this last, seems that a recovery above the mentioned 115.05 level is required to confirm additional gains, during this week. The technical indicators in the same chart, head higher, with only the Momentum indicator above its midline, whilst the 100 and 200 SMAs are far away above the current level, all of which suggests that the upside is still limited. According to the 4 hours chart however, the upside seems more constructive, with the price above its 100 SMA for the first time since early February, and the technical indicators nearing overbought territory, in line with further short term gains.
Support levels: 113.50 113.10 112.75
Resistance levels: 114.60 115.05 115.50
GOLD
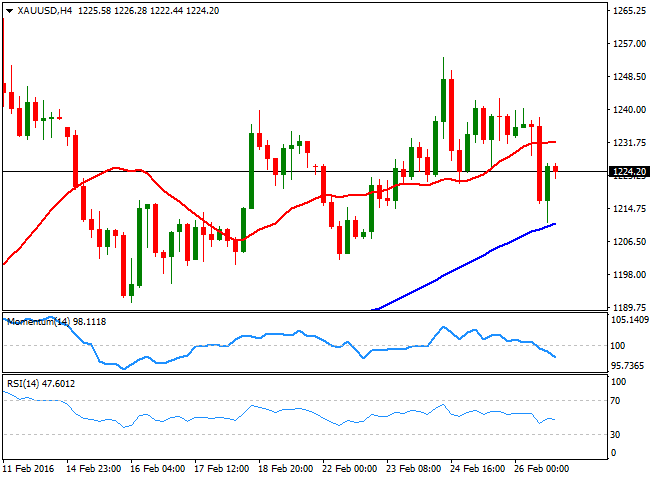
Spot gold closed the week flat at $1,224.20 a troy ounce, down over 1% on Friday amid dollar's strength, following the release of a betterthanexpected GDP revision. The commodity however, maintains the positive tone seen earlier this year, which was initially fueled by riskaversion. But the metal continued appreciating beyond market's sentiment, supported mostly by bargain hunting, as the commodity flirted with production cost for most of the end of 2015. The daily chart shows that the technical indicators have corrected extreme overbought conditions and head lower towards their midlines within positive territory, while the price has managed to remain near its highs, consolidating above a strongly bullish 20 SMA, all of which suggests the commodity may resume its advance. In the 4 hours chart, and for the shorter term, the price is currently recovering after finding some buying interest around a bullish 100 SMA, but remains below the 20 SMA, whilst the technical indicators head south within bearish territory. The upward potential is present, but some gains beyond 1,242.30 are required to confirm a firmer advance, whilst buying interest will likely surge on approaches to the 1,200 region.
Support levels: 1,214.50 1,202.05 1,195.10
Resistance levels: 1231.50 1,242.30 1,251.90
WTI CRUDE
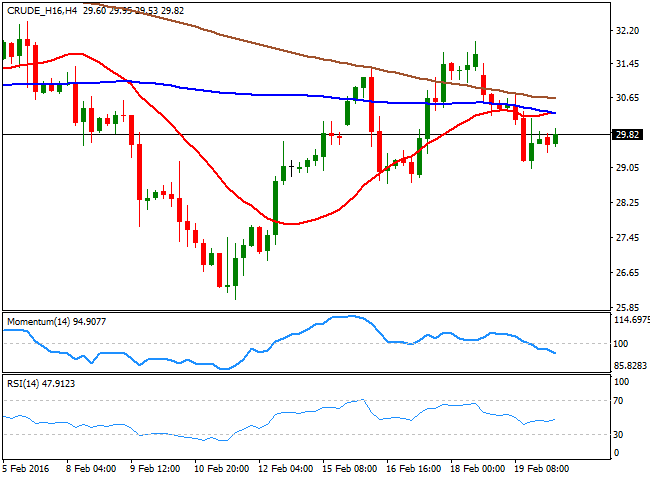
Crude oil prices remain subdued, with WTI futures ending the week below $30.00 a barrel. The black gold hit highs not seen in four weeks, briefly topping around $34.00 a barrel on positive US news, but retreated right before the closing bell, to end the week slightly higher. In the meantime, oil producers continue to refuse to reduce oil production, while in the US, the oil rig count fell by 13 to 400, the lowest since December 2009, yet stockpiles continued rising in the previous week, up by 3.5 million barrels to reach an alltome peak above 507 million barrels. Overall, there is little from a macroeconomic point of view that supports a recovery in oil's prices, unless worldwide economies start picking up. Technically, the daily chart shows that the price is below a mild bearish 20 SMA, whilst the technical indicators hover within bearish territory, lacking enough upward momentum to support some further gains. In the 4 hours chart, the price is below its moving averages, while the Momentum indicator heads south below the 100 level and the RSI indicator hovers around 47, all of which maintains the risk towards the downside.
Support levels: 29.40 28.65 27.80
Resistance levels: 30.10 30.80 31.50
DAX
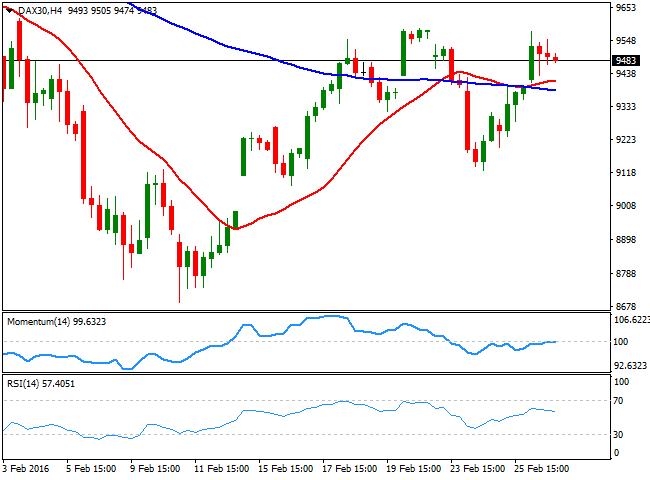
The German DAX added 185 points or 1.95% to end at 9,513.36 last Friday, helped by investor's positive mood and in spite poor local inflation readings. Data coming from Germany showed that February CPI rose by 0.4%, better than the previous 0.8% but below market's expectations of 0.5%. Yearly basis, inflation resulted at 0.1%, against previous 0.5%. Despite its latest gains, the index ended the week barely positive, and below Monday's high of 9,586. Technically, the daily chart presents quite a constructive tone, given that the index is above its 20 SMA, whilst the technical indicators advance beyond their midlines. In the 4 hours chart, however, the technical stance is more neutral, with the Momentum indicator flat around its 100 level, the index barely above its 20 ad 100 SMAs, and the RSI indicator turning south around 57. Some follow through beyond the mentioned weekly high is required to confirm more sustainable gains for this week.
Support levels: 9,433 9,356 9,281
Resistance levels: 9,586 9,674 9,762
DOW JONES
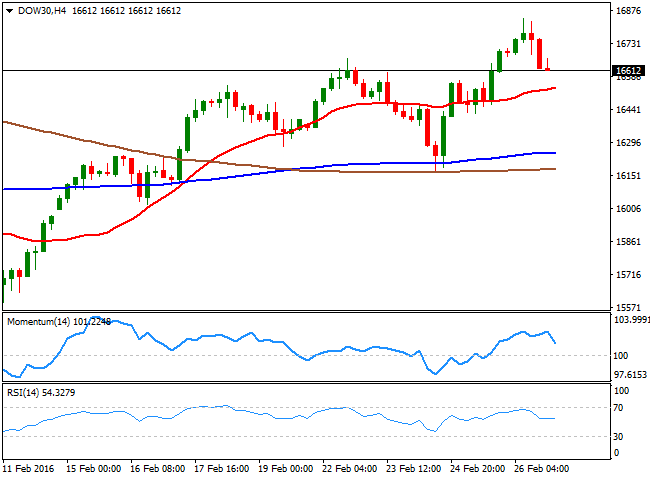
Wall Street indexes ended mixed, with the Dow Jones down 57 points to 16.639.97, the Nasdaq up 0.18% to end at 4,590.47, and the SandP 3 points lower at 1,948.05, hurt ahead of the closing bell by falling oil's prices. Also, the poor performance of Chinese shares on Friday, as the Shanghai Composite plummeted 6.4%, weighed on investors, in spite of the strong GDP review. The DJIA traded in the green for most of the day last Friday, up to 16,841, a fresh 7week high. Technically, the daily chart shows that, despite closing in the red, the index managed to post a higher high and a higher low, and well above a mild bullish 20 SMA. In the same chart, the Momentum indicator continues heading north well above the 100 level, while the RSI indicator has lost upward strength and turn south around 57. In the 4 hours chart, the index is above a bullish 20 SMA, whilst the technical indicators have turned south, but remain within positive territory. Overall, the index is expected to continue advancing as long as declines towards the 16,000 level attracts buying interest, with a break beyond the mentioned daily high supporting a rally towards the 17,000 region.
Support levels: 16,570 16,492 16,410
Resistance levels: 16,666 16,754 16,841
FTSE 100
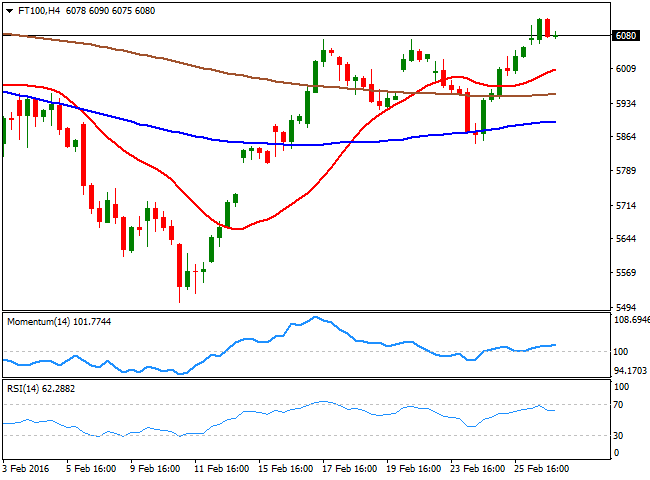
The FTSE 100 added 1.38% on Friday, closing at 6,096.01, up by a second week inarow. The index was supported by a recovery in base metals and oil, which lead to an advance in the commodityrelated shares. Royal Dutch Shell surged 3.37%, BP added 3.28%,, while the luxuryfashion retailer Burberry added 7.54% after a ratings upgrade from Nomura, from neutral to buy. The positive tone in the index, however, could be quickly reversed should fears of a Brexit continue affecting the Pound. In the meantime, the daily chart shows that the FTSE100 stalled its rally a few points below a flat 100 SMA, currently at 6,132, the immediate resistance, whilst the technical indicators head higher above their midlines, in line with further gains, particularly on an advance beyond the mentioned level. In the 4 hours chart, the technical picture is also bullish, given that the index is currently above its moving averages, the Momentum indicator aims higher above its 100 level, while the RSI indicator consolidates around 62.
Support levels: 6,027, 5,969 5,921
Resistance levels: 6,132 6,181 6,246
The information set forth herein was obtained from sources which we believe to be reliable, but its accuracy cannot be guaranteed. It is not intended to be an offer, or the solicitation of any offer, to buy or sell the products or instruments referred herein. Any person placing reliance on this commentary to undertake trading does so entirely at their own risk.
Recommended Content
Editors’ Picks

EUR/USD consolidates weekly gains above 1.1150
EUR/USD moves up and down in a narrow channel slightly above 1.1150 on Friday. In the absence of high-tier macroeconomic data releases, comments from central bank officials and the risk mood could drive the pair's action heading into the weekend.

GBP/USD stabilizes near 1.3300, looks to post strong weekly gains
GBP/USD trades modestly higher on the day near 1.3300, supported by the upbeat UK Retail Sales data for August. The pair remains on track to end the week, which featured Fed and BoE policy decisions, with strong gains.

Gold extends rally to new record-high above $2,610
Gold (XAU/USD) preserves its bullish momentum and trades at a new all-time high above $2,610 on Friday. Heightened expectations that global central banks will follow the Fed in easing policy and slashing rates lift XAU/USD.

Week ahead – SNB to cut again, RBA to stand pat, PCE inflation also on tap
SNB is expected to ease for third time; might cut by 50bps. RBA to hold rates but could turn less hawkish as CPI falls. After inaugural Fed cut, attention turns to PCE inflation.

Bank of Japan set to keep rates on hold after July’s hike shocked markets
The Bank of Japan is expected to keep its short-term interest rate target between 0.15% and 0.25% on Friday, following the conclusion of its two-day monetary policy review. The decision is set to be announced during the early Asian session.

Moneta Markets review 2024: All you need to know
VERIFIED In this review, the FXStreet team provides an independent and thorough analysis based on direct testing and real experiences with Moneta Markets – an excellent broker for novice to intermediate forex traders who want to broaden their knowledge base.
