GOLD
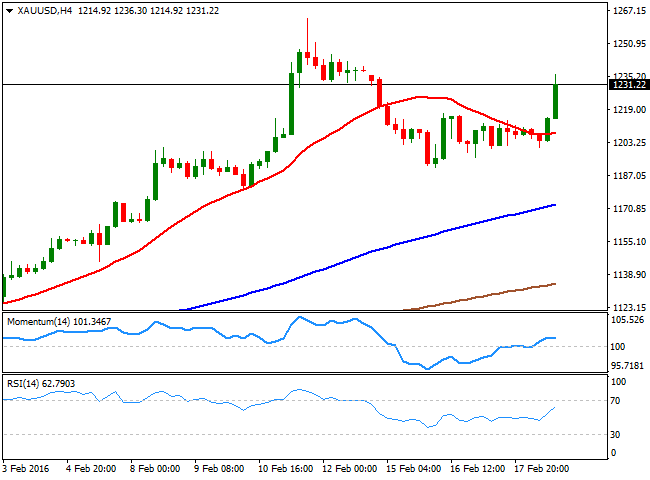
Gold resumed its advance this Thursday, with spot around $1,231.00 a troy ounce by the end of the US session. The bright metal has erased most of its weekly losses, indicating the dominant bullish trend remains firm in place, and that the latest decline has been merely corrective, with higher highs beyond 1,260 at sight. The sharp intraday advance is also saying that bargain hunting will likely surge on downward moves, as long as US data remains tepid, and therefore maintains the FED on hold. Technically, and according to the daily chart, further gains are to be expected, given that the technical indicators have resumed their advances after correcting extreme overbought readings, while the 20 SMA has extended its bullish slope below the current level, now standing around 1,175.00. In the 4 hours chart, the price accelerated higher after breaking through its 20 SMA, while the RSI indicator heads north around 62, supporting the longer term perspective, particularly on a break above 1,242.30, the immediate resistance.
Support levels:1,222.50 1,214.50 1,202.05
Resistance levels: 1,242.30 1,251.90 1,263.40
WTI CRUDE
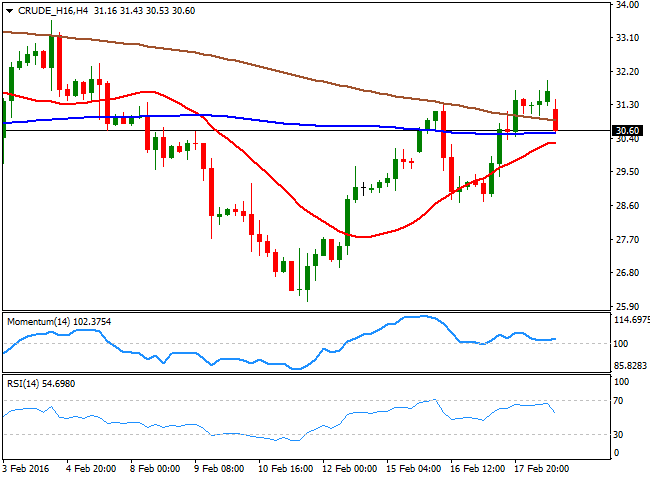
Crude oil prices jumped early Europe to fresh 2week highs, with WTI futures rising up to $31.95 a barrel, boosted by the API report released late Wednesday, saying that crude oil inventories fell by 3.3 million barrels in the previous week. Also supporting the commodity was Iran's endorsement to the output freeze proposed by other major producers. But the black gold fell down to the 30.50 region after the EIA released its weekly crude oil inventory, showing an increase of 2.1 million barrels last week, while stockpiles reached their highest in over 84 years. The worldwide glut continues, which means the risk in price will remain towards the downside. Technically, WTI holds onto gains weekly basis, but the daily chart shows that the price is now battling to hold above a horizontal 20 SMA, while the technical indicators have lost upward strength around their midlines, and the RSI indicator already turned south, in line with further declines. In the shorter term, the 4 hours chart the price is holding above a bullish 20 SMA, currently around 30.10, the immediate support, while the RSI indicator heads lower from overbought level and the Momentum indicator aims slightly higher above its 100 level, lacking enough strength to confirm a directional move.
Support levels:30.10 29.40 28.60
Resistance levels:30.80 31.50 32.10
EUR/USD
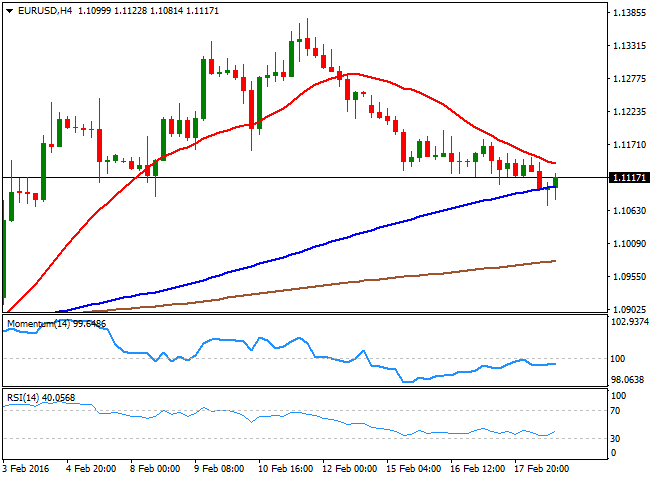
The American dollar ended the day mixed, with high levels of uncertainty across the board, resulting in choppy trading all across the financial world. The common currency came under pressure after the release of the Minutes of the latest ECB's meeting, as the Governing Council indicated its willing and able to act in March, if needed, in line with what policy makers have been saying over the last few week. There were no relevant releases in Europe, but US data was quite encouraging, as weekly unemployment claims fell to 262K in the week ending Feb 12, while the Philadelphia manufacturing index declined by less than expected, resulting a 2.8. For this Friday, the country is expected to release its January inflation figures, expected slightly better than December ones.The positive market's mood seen at the beginning of the day faded as the day went by, and the EUR/USD pair recovered from a daily low of 1.1070 printed after the release of positive US data, bouncing back above the 1.1100 level, but maintaining the weak tone seen on previous updates. The 1 hour chart shows that the price is currently battling with a bearish 20 SMA, while the technical indicators are still below their midlines, far from supporting a stronger advance. In the same chart, the 100 SMA has crossed below the 200 SMA offering a strong dynamic support around 1.1160. In the 4 hours chart, the price is also below its 20 SMA, while the technical indicators have turned slightly higher, also below their midlines, indicating limited buying interest at current levels.
Support levels:1.1080 1.1045 1.1000
Resistance levels: 1.1160 1.1200 1.1245
GBP/USD
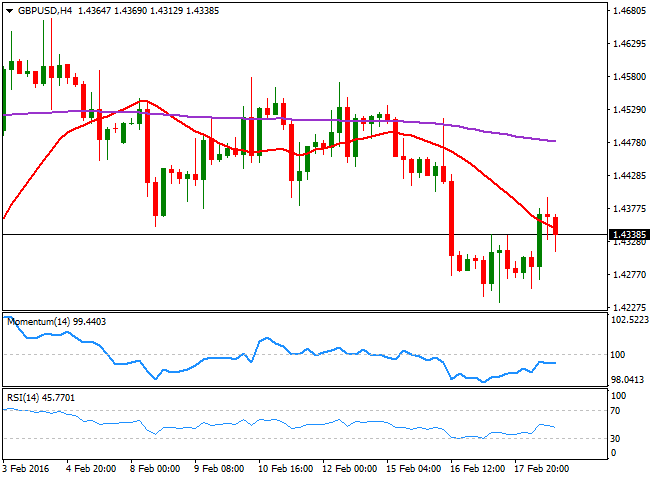
The GBP/USD pair advanced up to 1.4394 during the European session, as local share markets opened with a strong footing, tracking Asian stocks. But the pair trimmed most of its daily gains during the American session, and retreated towards its comfort zone around the 1.4300 level. There were no news in the UK to support the Pound, but this Friday, the kingdom will release its January Retail Sales data, expected to have grown compared to December figures. If that's the case, the British currency may result benefited. Nevertheless, the discussions surrounding a possible Brexit and the upcoming referendum on the matter, will probably keep the GBP subdued. The 1 hour chart shows that the pair is meeting short term buying interest around a bullish 20 SMA, whilst the technical indicators have retreated from overbought levels, but remain horizontal above their midlines. In the 4 hours chart, the price is back below a bearish 20 SMA , while the technical indicators have turned lower within negative territory and after correcting overbought readings, in line with another leg lower for this Friday.
Support levels: 1.4310 1.4265 1.4220
Resistance levels: 1.4370 1.4410 1.4450
USD/JPY
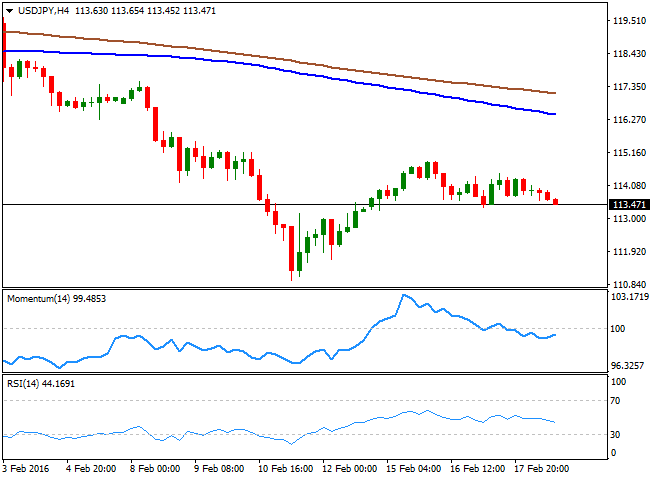
The USD/JPY approaches its weekly low ahead of the Asian session opening, having been unable to attract buyers, despite better mood among investors during the first half of the day, and positive US data. Declining US yields and the poor performance of Wall Street are helping the Japanese currency that slowly, but steadily approaches 113.37 against the greenback. The short term technical picture favors a continued decline for this Friday, as the price is below its 100 and 200 SMAs, both converging around 114.00, whilst the technical indicators head lower below their midlines. In the 4 hours chart, the moving averages are accelerating their declines well above the current level, while the RSI indicator anticipates a continued slide by heading lower around 44. A break below the mentioned weekly low should see the price declining down to the 112.50 region, a strong static support level, while a weekly close below this last level, exposes it to retest the low set this month around 111.00.
Support levels:113.35 112.90 112.50
Resistance levels:114.00 114.50 114.85
DAX
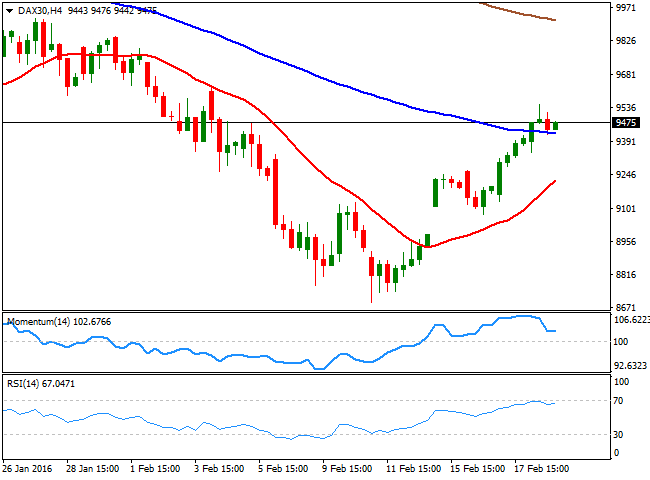
Following a positive start, European indexes closed the day mixed, pressured by oil's turbulence affecting commodityrelated equities. The German DAX managed to advance 87 points to close at 9,463.64, favored by the absence of local data. The benchmark retreated from a fresh weekly high of 9,549 on the back of rising US stockpiles to record highs, but remains well above its weekly opening. From a technical point of view, the daily chart shows that the DAX is still above its 20 SMA that anyway is flat, while the Momentum indicator is turning south below its midline, and the RSI indicator hovers around 49, keeping the upside limited. Shorter term, the 4 hours chart shows that the index is still above a bullish 20 SMA while the technical indicators have stalled their declines within positive territory and after correcting overbought readings, leaving a neutral stance at the time being. Should the index extend beyond the mentioned daily high, further gains could be expected for this Friday.
Support levels: 9,420 9,343 9,281
Resistance levels: 9,549 9,601 9,674
DOW JONES
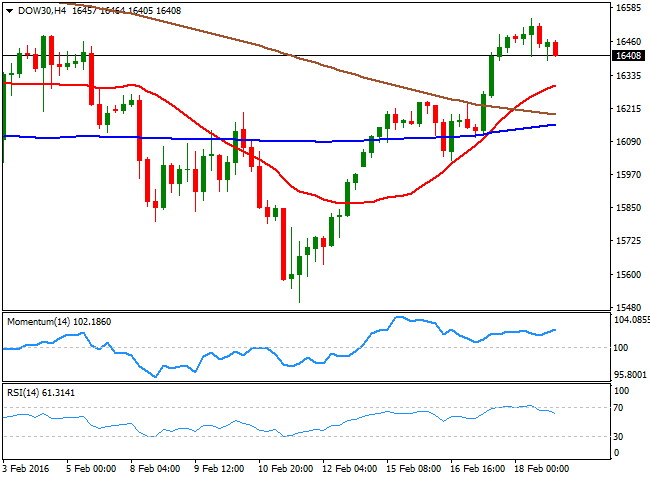
After wobbling between gains and losses ever since the opening, Wall Street closed in the red, snapping a 3day winning streak. Despite the telecom and utilities sectors rose, the slump in oil prices weighed on the commodity sector, and investors' mood. The DJIA posted a modest decline of 0.25% to end at 16,413.43, the Nasdaq shed 46 points to 4,487.54, while the SandP closed at 1,917.83, down by 0.47%. The DJIA closed the day near its daily low of 16,386, having set a higher low and a higher high of 16,546, but in the daily chart, the technical picture is far from suggesting a sharper decline, given that the index remains well above its 20 SMA, while the technical indicators have partially lost upward steam, but hold above their midlines. In the shorter term, the 4 hours chart shows that the 20 SMA has crossed above the 100 and 200 SMAs, whilst the Momentum indicator maintains its bullish slope well above its 100 level. In the same chart, the RSI indicator has retreated from overbought levels, but stands around 62, all of which maintains the downside risk limited.
Support levels: 16,386 16,277 16,202
Resistance levels: 16,470 16,546 16,630
FTSE 100
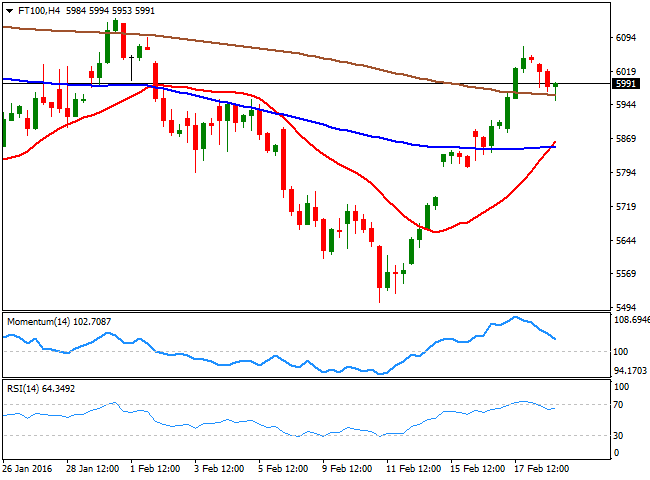
The FTSE 100 closed 0.97% lower at 5,971.95, dragged lower by oil and mining related shares. The Footsie gave back part of its weekly gains, but what seems more relevant, is the fact that the index was unable to sustain gains above the 6,000 level, signaling the latest advance could be merely corrective. Among the biggest losers were Anglo American, down by 7.7% and Tullow Oil that tumbled 11%. The daily chart shows that the index is still well above a bullish 20 SMA, but that the technical indicators have turned lower around their midlines, lacking strength enough to confirm a bearish acceleration ahead. In the 4 hours chart, the 20 SMA has extended above its 100 SMA, both well below the current level, while the technical indicators continue retreating from overbought levels, but remain firmly above their midlines.
Support levels:5,922 5,945 5,909
Resistance levels: 6,027 6,093 6,140
The information set forth herein was obtained from sources which we believe to be reliable, but its accuracy cannot be guaranteed. It is not intended to be an offer, or the solicitation of any offer, to buy or sell the products or instruments referred herein. Any person placing reliance on this commentary to undertake trading does so entirely at their own risk.
Recommended Content
Editors’ Picks
EUR/USD edges lower toward 1.0700 post-US PCE

EUR/USD stays under modest bearish pressure but manages to hold above 1.0700 in the American session on Friday. The US Dollar (USD) gathers strength against its rivals after the stronger-than-forecast PCE inflation data, not allowing the pair to gain traction.
GBP/USD retreats to 1.2500 on renewed USD strength

GBP/USD lost its traction and turned negative on the day near 1.2500. Following the stronger-than-expected PCE inflation readings from the US, the USD stays resilient and makes it difficult for the pair to gather recovery momentum.
Gold struggles to hold above $2,350 following US inflation

Gold turned south and declined toward $2,340, erasing a large portion of its daily gains, as the USD benefited from PCE inflation data. The benchmark 10-year US yield, however, stays in negative territory and helps XAU/USD limit its losses.
Bitcoin Weekly Forecast: BTC’s next breakout could propel it to $80,000 Premium

Bitcoin’s recent price consolidation could be nearing its end as technical indicators and on-chain metrics suggest a potential upward breakout. However, this move would not be straightforward and could punish impatient investors.
Week ahead – Hawkish risk as Fed and NFP on tap, Eurozone data eyed too

Fed meets on Wednesday as US inflation stays elevated. Will Friday’s jobs report bring relief or more angst for the markets? Eurozone flash GDP and CPI numbers in focus for the Euro.
