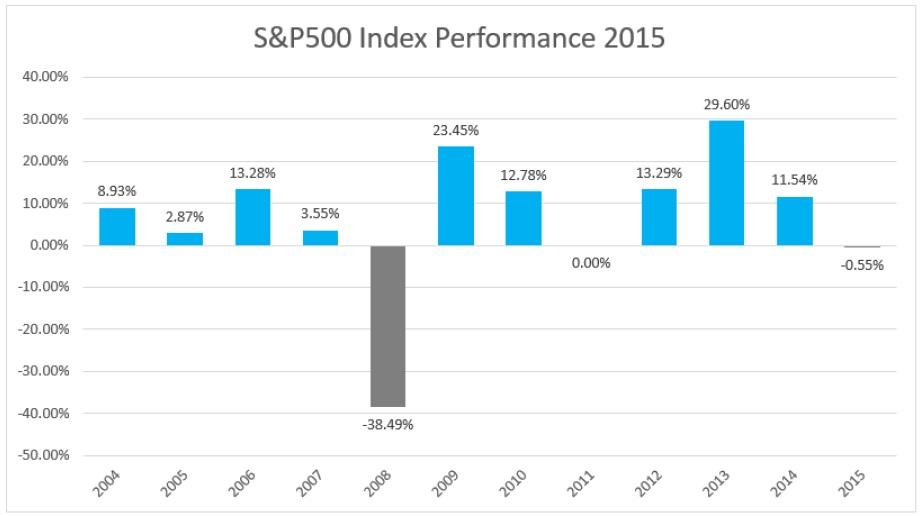
The S&P 500 index fully recovered after falling in August to as low as 1,835 when fears of a slowdown in China shocked the global markets. The index experienced its first technical correction during the month of August as it fell more than 6% from its all‐time high. This is the biggest fall since September 2011 where the index faced a ‐7.20% drop. Even though the index recovered above the psychological level of 2,000 it went negative on the year‐to‐date (YTD) at 1.85% and in the past one year period is down about 0.60%. For the third quarter, the index finished with a total return of ‐ 6.90%.
However, the main concern is that the index return is coming from a few of its stocks. Among the 10 most valuable stocks in the market which are up roughly 20% as a group this year versus a ‐3% for the rest of the stocks. For example, shares of Amazon.com (NASDAQ: AMZN), Microsoft (NASDAQ: MSFT), Facebook (NASDAQ: FB) and Alphabet (NASDAQ: GOOG) have led the way, while Exxon Mobil (NYSE: XOM) and Berkshire Hathaway (NYSE; BRK) have been underperformed. Thus, we should examine this more closely as a widening of the stocks between the market's best performers and the rest of the market could raise some worries for the whole performance of the index in the near term.
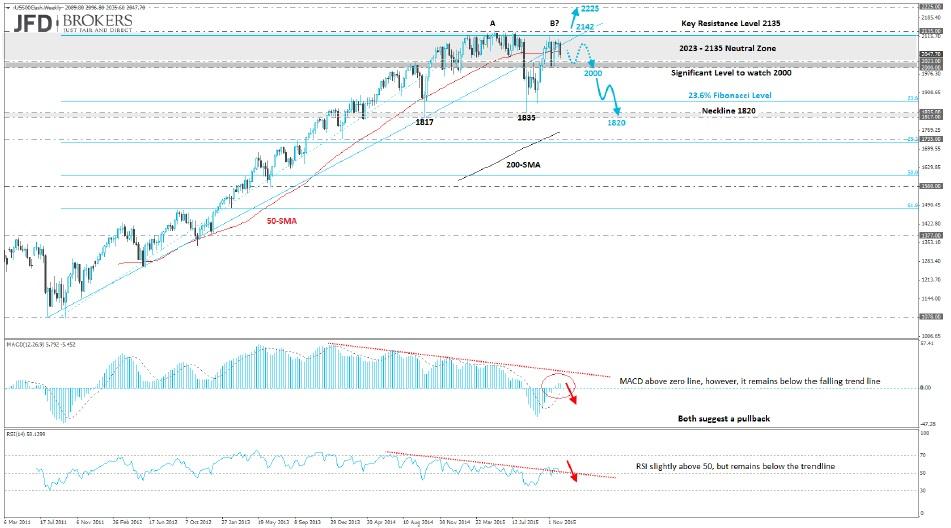
Technically, the index is struggling to extend the bullish rally above the all‐time high of 2,135 following the aggressive buy from the 1,835 in mid‐August. The recent sell‐off in mid‐November saw the key zone of 2,000 – 2,023 once again provide solid support for the index. Therefore, the key zone which will have a significant impact on the direction of the index will be the 2,000 – 2,023 zone. The recent rally above the aforementioned zone has been extremely aggressive and if we see a close above the key 2,135 or the all‐time high, would be a strong bullish signal.
On the other side of the coin, a break below the aforementioned zone could be seen as a double top reversal, which is a bearish reversal pattern, and therefore, we should expect a further pressure on the bottom of the pattern or the neckline, around 1,835 and slightly below the 23.6% Fibonacci retracement level.
The content we produce does not constitute investment advice or investment recommendation (should not be considered as such) and does not in any way constitute an invitation to acquire any financial instrument or product. JFD Group, its affiliates, agents, directors, officers or employees are not liable for any damages that may be caused by individual comments or statements by JFD Group analysts and assumes no liability with respect to the completeness and correctness of the content presented. The investor is solely responsible for the risk of his investment decisions. Accordingly, you should seek, if you consider appropriate, relevant independent professional advice on the investment considered. The analyses and comments presented do not include any consideration of your personal investment objectives, financial circumstances or needs. The content has not been prepared in accordance with the legal requirements for financial analyses and must therefore be viewed by the reader as marketing information. JFD Group prohibits the duplication or publication without explicit approval.
72,99% of the retail investor accounts lose money when trading CFDs with this provider. You should consider whether you can afford to take the high risk of losing your money. Please read the full Risk Disclosure: https://www.jfdbank.com/en/legal/risk-disclosure
Recommended Content
Editors’ Picks

EUR/USD consolidates weekly gains above 1.1150
EUR/USD moves up and down in a narrow channel slightly above 1.1150 on Friday. In the absence of high-tier macroeconomic data releases, comments from central bank officials and the risk mood could drive the pair's action heading into the weekend.

GBP/USD stabilizes near 1.3300, looks to post strong weekly gains
GBP/USD trades modestly higher on the day near 1.3300, supported by the upbeat UK Retail Sales data for August. The pair remains on track to end the week, which featured Fed and BoE policy decisions, with strong gains.

Gold extends rally to new record-high above $2,610
Gold (XAU/USD) preserves its bullish momentum and trades at a new all-time high above $2,610 on Friday. Heightened expectations that global central banks will follow the Fed in easing policy and slashing rates lift XAU/USD.

Week ahead – SNB to cut again, RBA to stand pat, PCE inflation also on tap
SNB is expected to ease for third time; might cut by 50bps. RBA to hold rates but could turn less hawkish as CPI falls. After inaugural Fed cut, attention turns to PCE inflation.

Bank of Japan set to keep rates on hold after July’s hike shocked markets
The Bank of Japan is expected to keep its short-term interest rate target between 0.15% and 0.25% on Friday, following the conclusion of its two-day monetary policy review. The decision is set to be announced during the early Asian session.

Moneta Markets review 2024: All you need to know
VERIFIED In this review, the FXStreet team provides an independent and thorough analysis based on direct testing and real experiences with Moneta Markets – an excellent broker for novice to intermediate forex traders who want to broaden their knowledge base.


