Market Overview
It almost seems as though there is a different driving factor for the markets every day at the moment, and yesterday was the turn of China. So what will it be today then? Well, the standoff with Greece and the Eurozone is gradually coming to a head as we approach the Eurogroup meeting on 24th April which could be critical as to whether Greece receives the €7.4bn tranche of bailout. This issue will grab the headlines in the coming days and could easily impact on sentiment.
Wall Street jumped higher yesterday as markets reacted to the easing measures put in place by the People’s Bank of China. The S&P 500 rallied by 0.9% as Morgan Stanley became the latest bank to beat estimates. Asian markets have been a touch more positive today, with the Nikkei 225 rallying 1% as the yen has begun to weaken again. European markets are a little more reticent today, with a mixed showing in early trading with Greece giving cause for concern.
In forex trading, after battling back yesterday, the US dollar has continued its recovery and is trading positively against all forex majors. The prices of gold and silver are also weaker as a result of the rebound on the dollar. Euro traders will be able to turn their focus to Germany this morning which could lend some support, as the ZEW Economic Sentiment due at 1000BST. The expectation is for further recovery to 55.3 (from 54.8 last month) which would be a sixth consecutive month of improvement and be further signs of better news in Europe’s driving economy.
Chart of the Day – AUD/USD
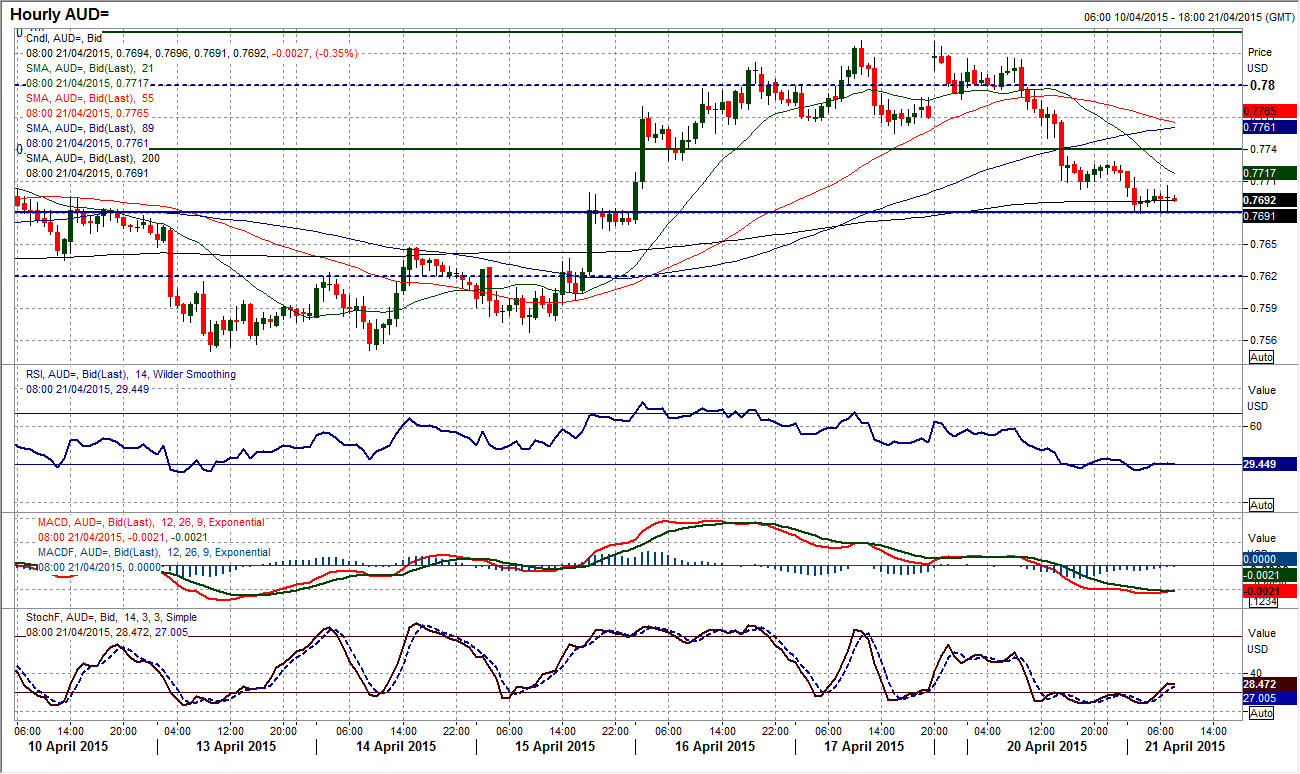
With a strongly negative candle that was incredibly close to forming a bearish key one day reversal (by just 2 pips on my Reuters chart), the sentiment for the Aussie has turned. The Stochastics have negatively crossed over and the last two times that this was seen, in late February and late March, it preceded a sell-off on the Aussie. The hourly chart reflects this change in sentiment with a move back below the key pivot level at $0.7740. Also the hourly momentum, which had been showing bearish divergences on the last few peaks of the rally, have now turned negative. There is now around 30 pips of resistance between $0.7725/$0.7755 with which to use rallies as a chance to sell. There are many pivot levels that seem to have formed on the Aussie, with $0.7680 immediately being tested, under which is $0.7620 before the key lows come in at $0.7550.
EUR/USD
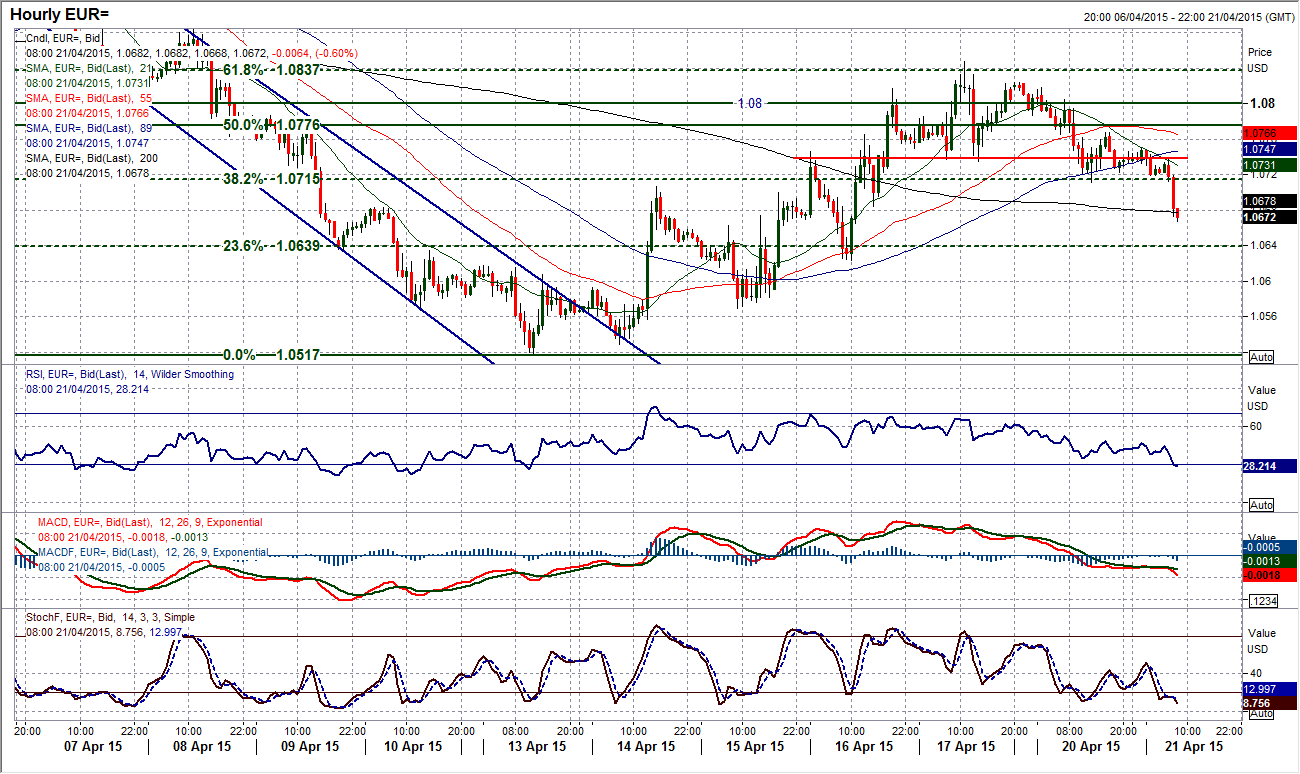
Has the euro rally rolled over again? The initial signs are not great, with yesterday’s close below the low of the previous session the candle has been fairly bearish. The RSI has turned lower at 50 whilst the Stochastics have also begun to turn lower again. On the intraday hourly chart there has been a small head and shoulders top formed below $1.0735 which implies a target of $1.0620. Furthermore, in the past two days there has been a series of lower highs and lower lows formed which is putting pressure on the downside, with the next support at $1.0700 before $1.0620. Hourly momentum indicators have turned more corrective in the past 24 hours too. It would now need a break back above the $1.0800 pivot level to suggest that the bulls had regained control.
GBP/USD
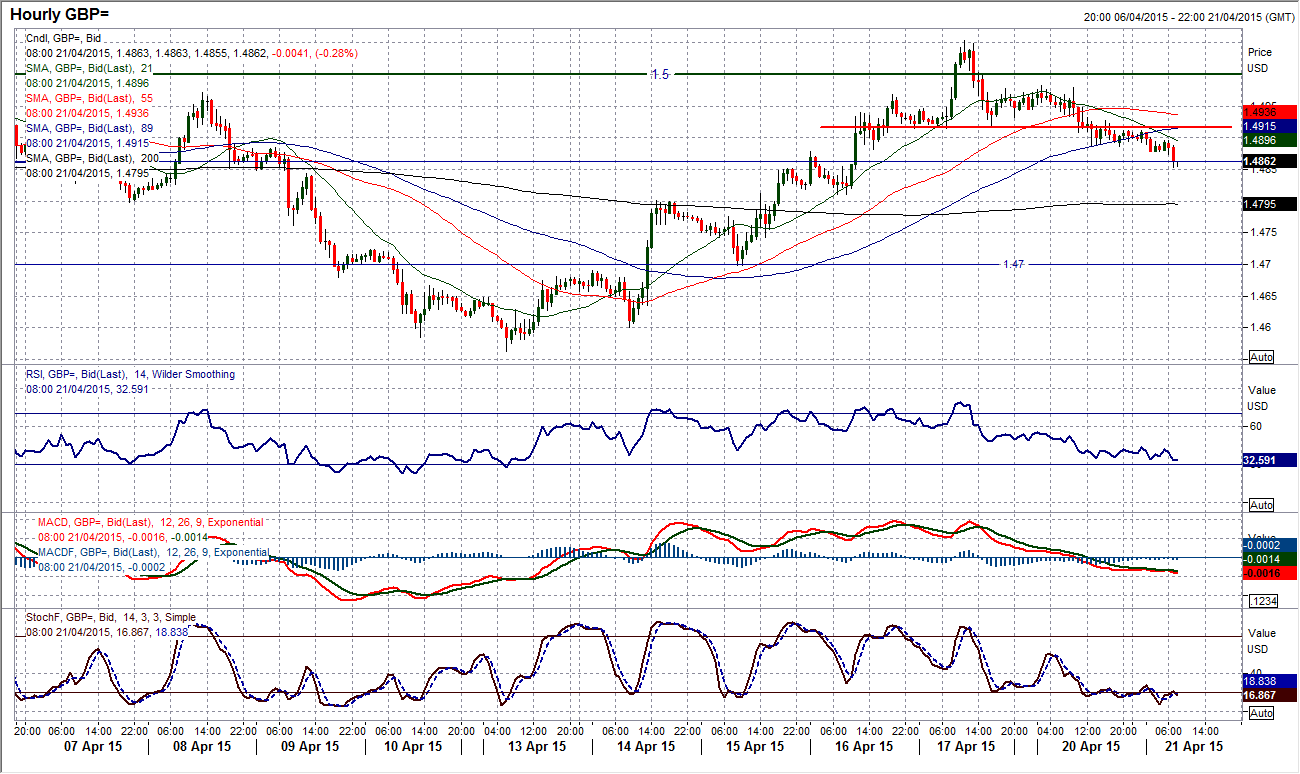
I spoke yesterday of the arguable “shooting star” candle formed on Friday. It was not a perfect example of one, but the reversal in sentiment was clear to see. This move has since been backed up by a negative candle yesterday and the corrective signs are building once more. Additionally the Stochastics have now crossed and turned lower which suggests near term bullish momentum has stalled. It is very interesting on the hourly chart because there is the same head and shoulders top pattern on Cable as there is with the euro. The move completed on a breach of the reaction low at $1.4915 and gives an implied target of around $1.4780. I also notice that the near term outlook is being guided lower now by the falling 21 hour moving average (which had previously acted as a basis of support). Once again, as with the euro the hourly momentum has turned more corrective in the past 24 hours with MACD, RSI and Stochastics all in a more negative configuration. A retest of the old pivot level at $1.4800 looks increasingly likely now. Resistance comes around the neckline at $1.4915 and the rally high at $1.49843.
USD/JPY
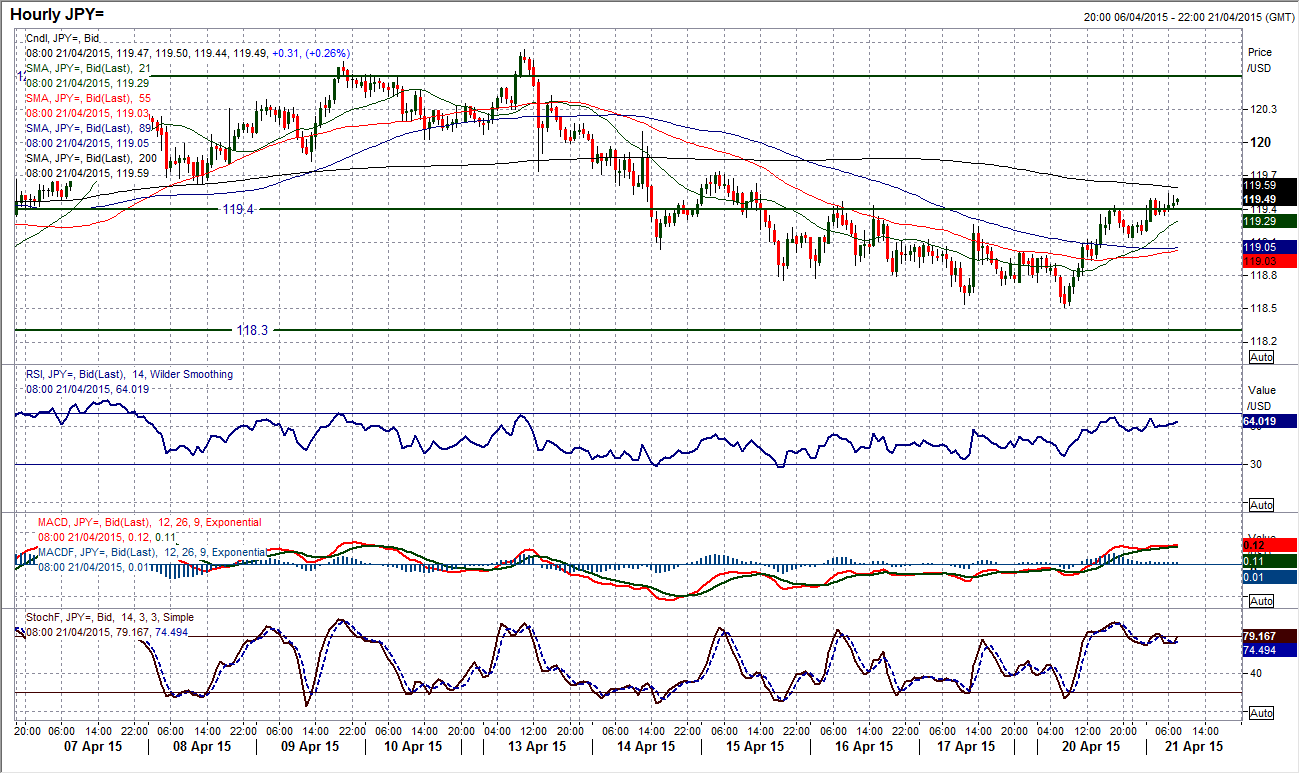
Another fascinating move has been seen on the chart of Dollar/Yen. With the key medium term support at $118.30 within touching distance the bulls have returned to end six straight days of selling pressure to post a higher low at 118.50. The daily momentum indicators which continue to flow around neutral have subsequently started to pick up again, with the ranging Stochastics giving a positive crossover. An interesting move has also been seen on the hourly chart, with the pivot level around 119.40 having initially held back the rally late yesterday evening, on second thoughts the bulls are now breaking through. This is giving Dollar/Yen a more positive outlook within the medium term consolidation range. Even the hourly MACD lines are at a 9 day high. Initial resistance is at 119.75 with the first real test at 120.00. It is also possible to get a 120.00 implied target from a small double bottom base pattern formed above 119.25 too. That leaves an initial support band between 119.00/119.25.
Gold
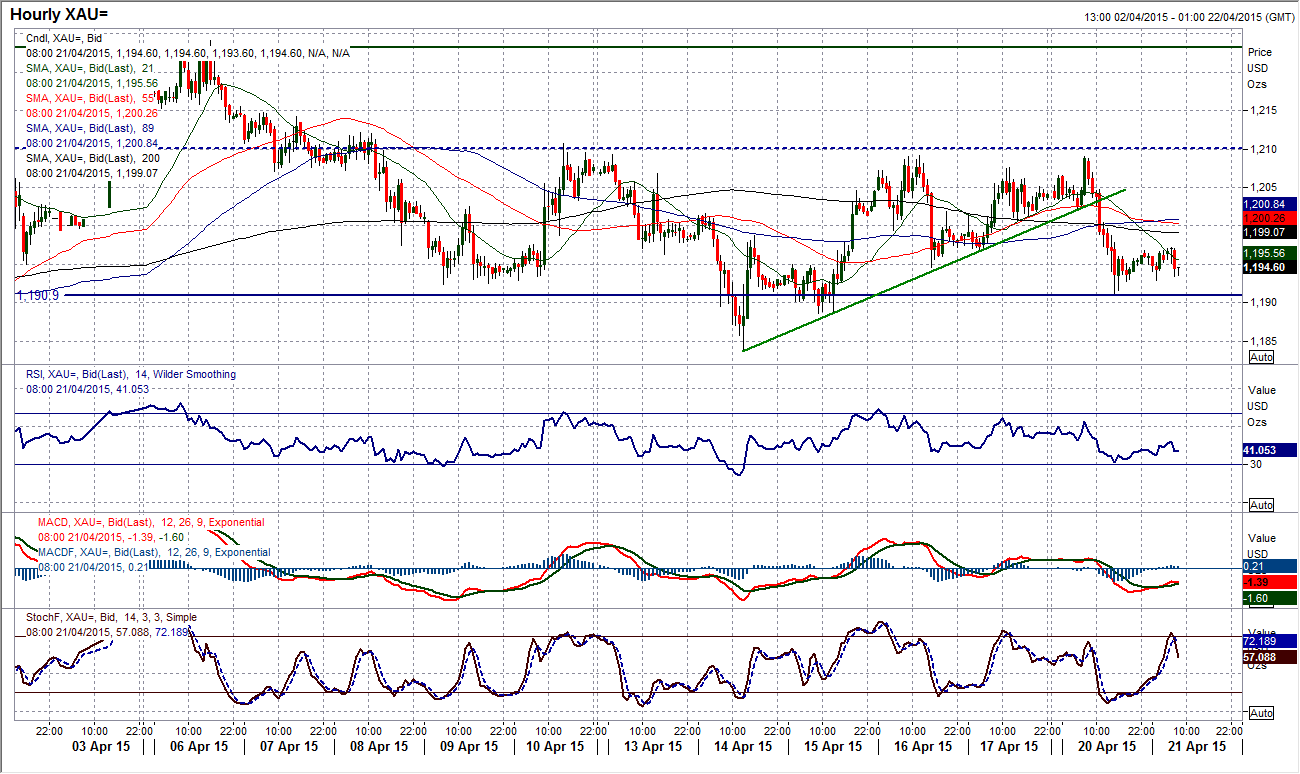
The erratic movement in the recent price movement continues. The daily chart now shows four successive different candles as gold fails to find any real direction. The price has been stuck in this range between the key levels of $1178 and $1224 for a few weeks now and there is little to suggest this is going to end any time soon. Even within the range there is resistance that is building at $1210.70, whilst I was interested to see yesterday’s low coming in around the old support band at $1191. I still see it as possible to play the classic hourly RSI signals, buying around 30 and selling around 70. Other than that we need to wait for a break of the range.
WTI Oil
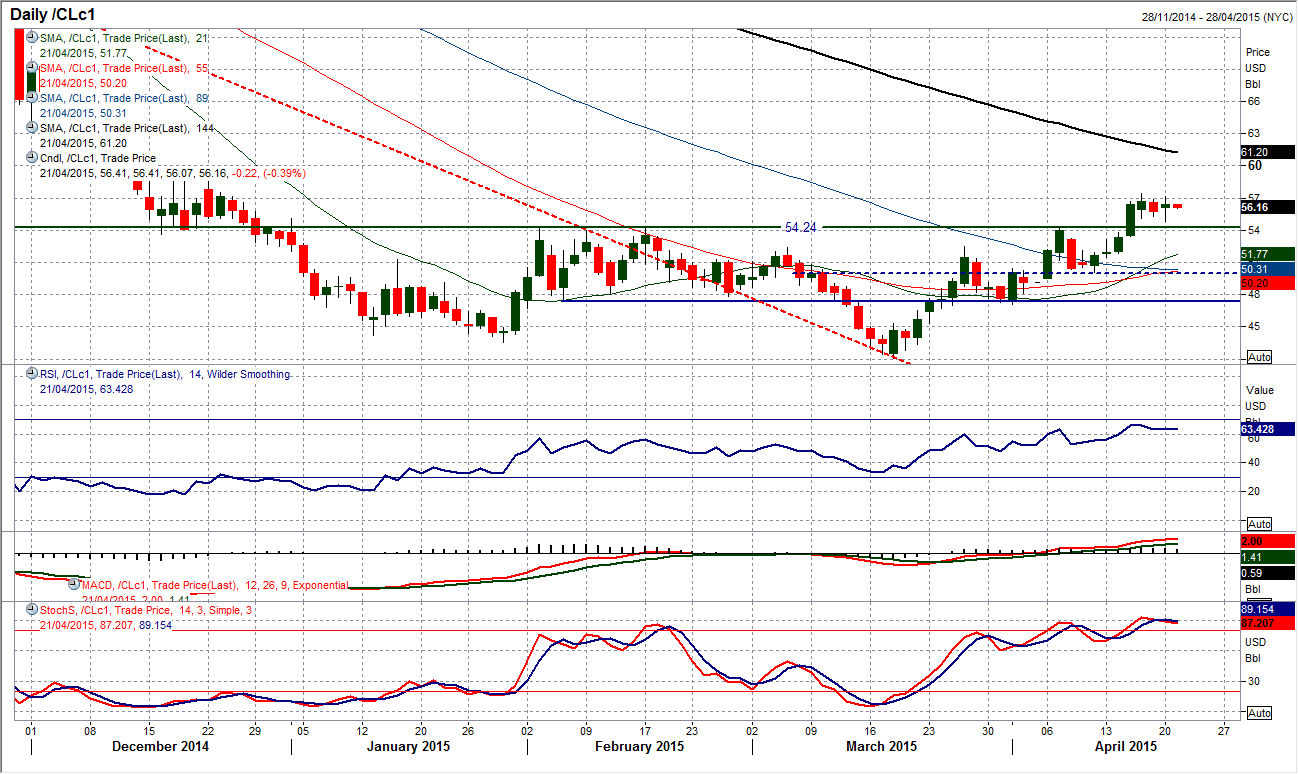
The consolidation following the key upside break continues. A “long legged doji” candle is a volatile but uncertain candle on the daily chart which suggests there is an unresolved battle between the bulls and the bears over the course of yesterday. The bulls seem happy to fight against the profit takers as the support continues to be formed above the breakout support at $54.24 which implies a continued acceptance of the new breakout level. The intraday hourly chart suggests a near term consolidation with support forming at $54.85 and resistance under the Thursday’s high at $57.42. The daily momentum indicators remain positive and suggest there is further upside potential. I continue to be bullish about the breakout whilst the support continues to form above the band $53/$54.24. The large base continues to target $65.00.
Note: All information on this page is subject to change. The use of this website constitutes acceptance of our user agreement. Please read our privacy policy and legal disclaimer. Opinions expressed at FXstreet.com are those of the individual authors and do not necessarily represent the opinion of FXstreet.com or its management. Risk Disclosure: Trading foreign exchange on margin carries a high level of risk, and may not be suitable for all investors. The high degree of leverage can work against you as well as for you. Before deciding to invest in foreign exchange you should carefully consider your investment objectives, level of experience, and risk appetite. The possibility exists that you could sustain a loss of some or all of your initial investment and therefore you should not invest money that you cannot afford to lose. You should be aware of all the risks associated with foreign exchange trading, and seek advice from an independent financial advisor if you have any doubts.
Recommended Content
Editors’ Picks
EUR/USD edges lower toward 1.0700 post-US PCE

EUR/USD stays under modest bearish pressure but manages to hold above 1.0700 in the American session on Friday. The US Dollar (USD) gathers strength against its rivals after the stronger-than-forecast PCE inflation data, not allowing the pair to gain traction.
GBP/USD retreats to 1.2500 on renewed USD strength

GBP/USD lost its traction and turned negative on the day near 1.2500. Following the stronger-than-expected PCE inflation readings from the US, the USD stays resilient and makes it difficult for the pair to gather recovery momentum.
Gold struggles to hold above $2,350 following US inflation

Gold turned south and declined toward $2,340, erasing a large portion of its daily gains, as the USD benefited from PCE inflation data. The benchmark 10-year US yield, however, stays in negative territory and helps XAU/USD limit its losses.
Bitcoin Weekly Forecast: BTC’s next breakout could propel it to $80,000 Premium

Bitcoin’s recent price consolidation could be nearing its end as technical indicators and on-chain metrics suggest a potential upward breakout. However, this move would not be straightforward and could punish impatient investors.
Week ahead – Hawkish risk as Fed and NFP on tap, Eurozone data eyed too

Fed meets on Wednesday as US inflation stays elevated. Will Friday’s jobs report bring relief or more angst for the markets? Eurozone flash GDP and CPI numbers in focus for the Euro.
