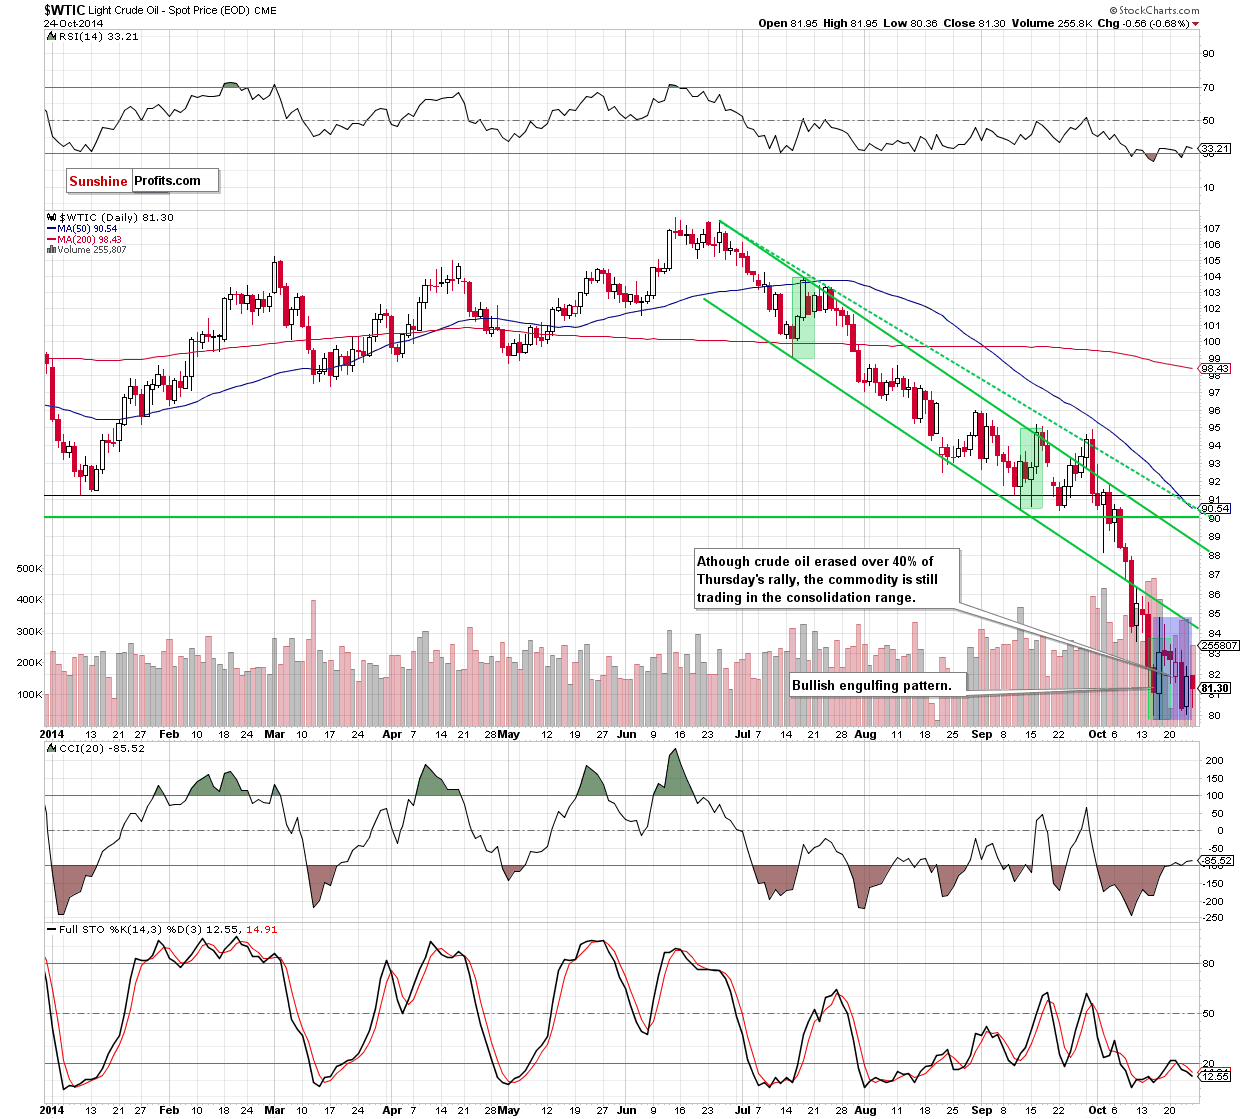
On Friday, crude oil lost 0.68% as concerns over a global oversupply continued to weigh. Additionally, soft U.S. housing data pushed the commodity below $82 per barrel. Will we see another test of the strength of the psychologically important level of $80?
Although crude oil moved sharply on Thursday on news that Saudi Arabia cut its supply to the market in September, oil investors digested that the country's overall production grew from 9.597 million barrels a day in August to 9.7 million barrels a day last month, indicating that the market will remain amply supplied. Additionally, soft U.S. housing data pushed the commodity lower as well. On Friday, the Census Bureau showed that U.S. new home sales rose in September to 467,000 units, missing expectations for an increase to 470,000 units. In this environment, the price of light crude declined after the market’s open on Friday, slipping below $82. Will crude oil test of the strength of the psychologically important level of $80 once again? (charts courtesy of http://stockcharts.com).

As you see on the daily chart, although crude moved lower once again, the commodity is trading in the consolidation between Oct 16 high and low (marked with blue), still above the key level of $80. Therefore, what we wrote on Thursday is up-to-date:
(…) light crude approached the recent low, which could encourage oil bulls to act and result in a post-double bottom rally. If this is the case, crude oil will rebound from here in the coming days and the initial upside target would be around $84.45, where the lower border of the declining trend channel and the lower long-term grey resistance line are. Additionally, slightly above these lines is also the upper border of the current consolidation (at $84.83). Therefore, a breakout above such solid resistance zone would be a strong bullish signal that should trigger further improvement and an increase to at least $88.50-$89, where the next resistance zone (created by the upper line of the declining trend channel and the first long-term grey declining line) is. Nevertheless, if oil bulls fail, and the commodity breaks below $79.78, they will find the next support around $77.28, where the Jun 2012 low is.
Did this short-term move affected the medium-term picture? Let’s check.

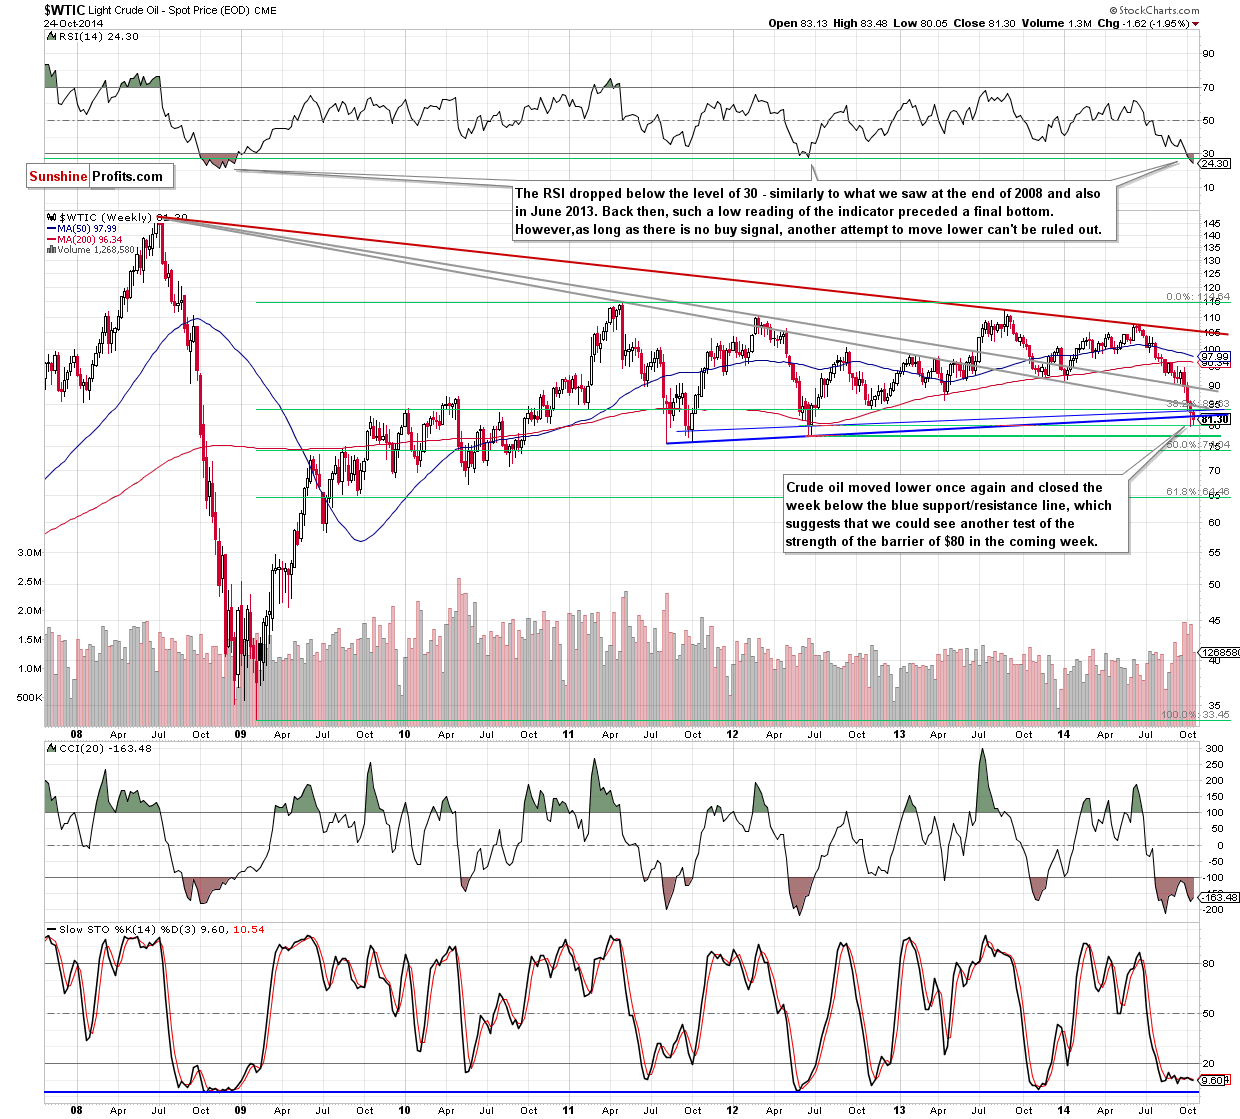
From this perspective, we see that Friday’s move took crude oil below the blue rising line once again. In this way, the commodity closed the week under this resistance, which suggests that we will see another test of the strength of the barrier of $80 in the coming week. In our opinion, as long as this key support is in play another sizable downward move is not likely to be seen. On the other hand, as long as there is no breakout above the blue resistance line, further improvement is questionable.
Summing up, although the very short-term picture hasn’t changed much as crude oil is still trading in the consolidation range, the situation in the medium-term has deteriorated slightly after a weekly close below the long-term support/resistance line. Such price action suggests that we’ll see another test of the strength of the barrier of $80 in the coming week. Taking all the above into account, we still think that staying on the sidelines and waiting for the confirmation that the declines are over is the best choice.
Very short-term outlook: mixed with bullish bias
Short-term outlook: mixed with bullish bias
MT outlook: mixed
LT outlook: bullish
Trading position (short-term; our opinion): No positions.
Recommended Content
Editors’ Picks
EUR/USD holds below 1.0750 ahead of key US data

EUR/USD trades in a tight range below 1.0750 in the European session on Friday. The US Dollar struggles to gather strength ahead of key PCE Price Index data, the Fed's preferred gauge of inflation, and helps the pair hold its ground.
GBP/USD consolidates above 1.2500, eyes on US PCE data

GBP/USD fluctuates at around 1.2500 in the European session on Friday following the three-day rebound. The PCE inflation data for March will be watched closely by market participants later in the day.
Gold clings to modest daily gains at around $2,350

Gold stays in positive territory at around $2,350 after closing in positive territory on Thursday. The benchmark 10-year US Treasury bond yield edges lower ahead of US PCE Price Index data, allowing XAU/USD to stretch higher.
Bitcoin Weekly Forecast: BTC’s next breakout could propel it to $80,000 Premium

Bitcoin’s recent price consolidation could be nearing its end as technical indicators and on-chain metrics suggest a potential upward breakout. However, this move would not be straightforward and could punish impatient investors.
US core PCE inflation set to signal firm price pressures as markets delay Federal Reserve rate cut bets

The core PCE Price Index, which excludes volatile food and energy prices, is seen as the more influential measure of inflation in terms of Fed positioning. The index is forecast to rise 0.3% on a monthly basis in March, matching February’s increase.