Highlights
- Market Movers: Weekly Technical Outlook
- The Dollar Is King for May, But Can It Last?
- Stocks: Why the FTSE 100 Could Be a Leading Indicator
- Look Ahead: Equities
- Look Ahead: Commodities
- Global Data Highlights
Market Movers: Weekly Technical Outlook
Technical Developments to Watch:
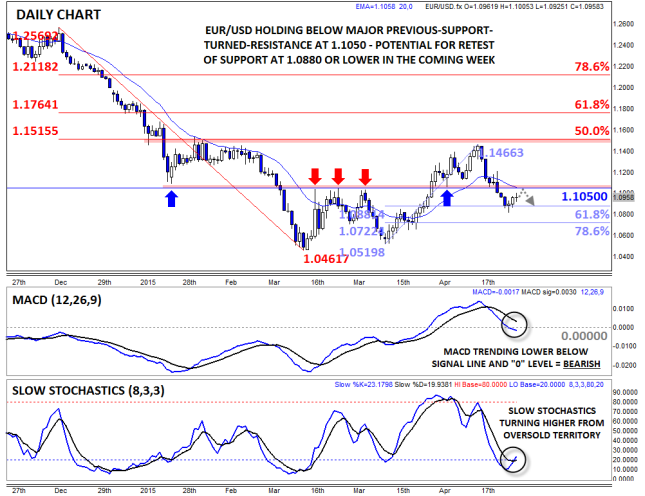
- EUR/USD bias remains lower beneath key resistance at 1.1050
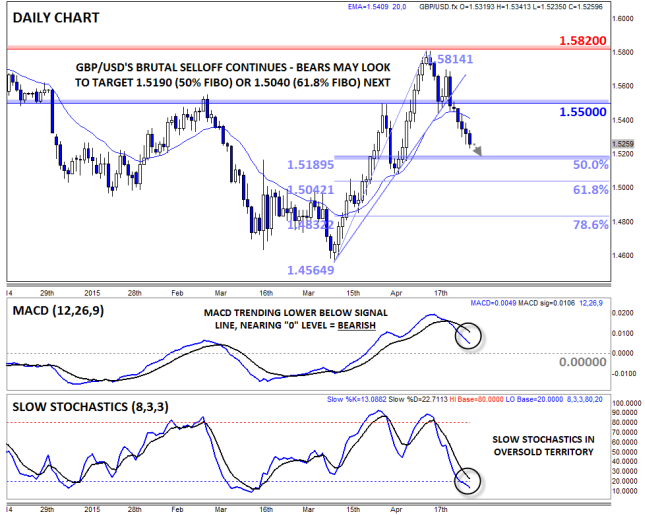
- GBP/USD bears may target 1.5190 (50% Fibo) or 1.5040 (61.8%) next
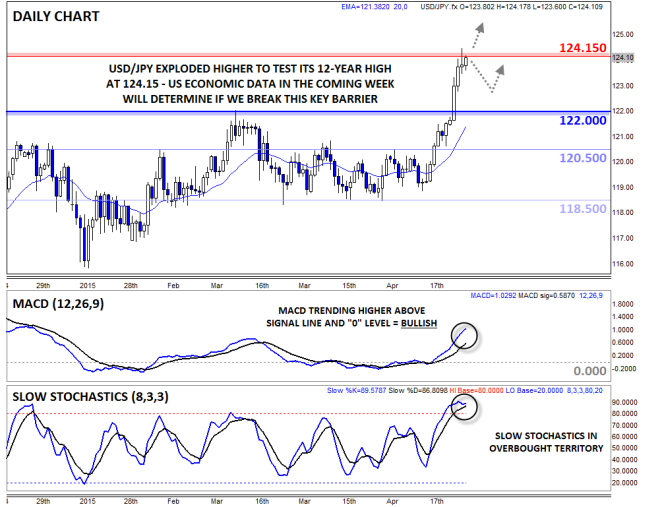
- USD/JPY pressing against its 12-year high above 124.00
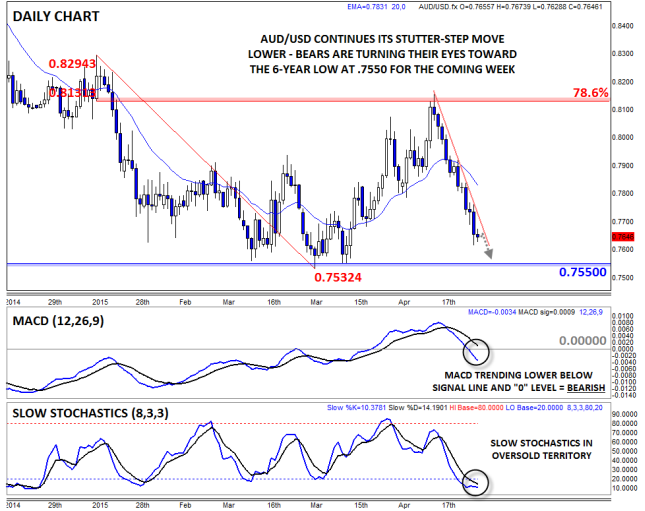
- AUD/USD in play, approaching 6-year low at .7550
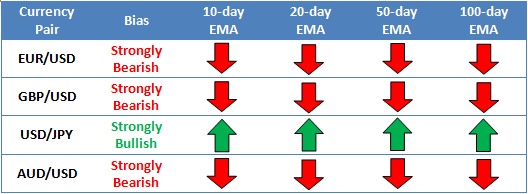
* Bias determined by the relationship between price and various EMAs. The following hierarchy determines bias (numbers represent how many EMAs the price closed the week above): 0 – Strongly Bearish, 1 – Slightly Bearish, 2 – Neutral, 3 – Slightly Bullish, 4 – Strongly Bullish.
** All data and comments in this report as of Friday’s European session close **
EUR/USD

- EURUSD dipped, then rallied last week, holding below the key 1.1050 level
- MACD crossing below “0” level, but Slow Stochastics now oversold
- Bias remains lower beneath previous-support-turned-resistance at 1.1050
EURUSD edged lower last week on fears surrounding Greece’s upcoming debt payment and broad-based strength in the US dollar. Given last week’s break below the major bull/bear line in the sand at 1.1050, the near-term bias has shifted to the downside; the MACD’s recent cross below its “0” level confirms the shift to bearish momentum. That said, the Slow Stochastics have reached oversold territory, so a consolidation or bounce would not be surprising early this week. Overall, the bias will remain lower this week under the key 1.1050 level.
Source: FOREX.com
GBP/USD

- GBPUSD sold off on all five days last week
- MACD trending lower, but Slow Stochastics hint at possible bounce
- Bears may look to target the 50% or 61.8% Fib retracements next at 1.5190 or 1.5040 next
GBPUSD traded consistently to the downside last week, trading lower on each day, as of writing on Friday afternoon. Bears remain firmly in control of the pair as any hopes of a BOE rate hike this year fade away and the dollar resumes its longer-term uptrend. Like the Euro, the momentum (MACD) has turned lower, though the bears’ progress may be limited by the Slow Stochastics which are now in oversold territory (<20). For this week, a move down toward the 50% or 61.8% Fibonacci retracement is definitely in play, though more conservative traders may prefer to fade any bounces to improve the risk/reward ratio on bearish trades.
Source: FOREX.com
USD/JPY

- USDJPY exploded out to a new 12-year high up to nearly 125.00 last week
- MACD showing bullish momentum, but Slow Stochastics overbought
- Pullback off 12-year high at 124.15 favored, but strong US data could break that barrier
USDJPY built on its minor breakout above 120.50 last week, eventually surging all the way up to a 12-year high near the 125.00 level before the bears were finally able to put the brakes on the rally. As we noted last week, the MACD is showing strong bullish momentum, and the Slow Stochastics is now deeply overbought. A near-term pullback toward previous-resistance-turned-support at 122.00 is our base case for this week, but strong US economic data could push the pair conclusively above 124.15 resistance and open the door for a strong bullish continuation.
Source: FOREX.com
AUD/USD

- AUDUSD’s stutter-step selloff continued last week
- MACD showing bearish momentum
- Potential for more weakness toward the 6-year low near .7550
AUD/USD is our currency pair in play this week due to a number of high-impact economic reports out of the US and Australia (see “Data Highlights” below for more). Last week, AUDUSD continued its stutter-step move lower, shedding another 200 pips to trade in the mid-.7600s as of writing on Friday morning. Like the other major currency pairs, the MACD shows that momentum has turned in favor of US dollar bulls, though the extreme reading in the Slow Stochastics augurs for some short-term caution. Assuming the economic data cooperates, AUDUSD bears will look to target the previous 6-year low at .7550, but it may be difficult to break that strong support level next week.
Source: FOREX.com
The Dollar Is King for May, But Can It Last?
The last trading day of May saw a pause in the recent dollar rally. Friday’s economic data didn’t help dollar sentiment, and confirmation that the US economy shrank 0.7% in the first quarter sent the buck lower at the end of last week. Although this was less than the -0.9% decline expected, it suggests that the US economy is still under the first quarter weather-related curse that we saw last year.
The immediate rush to safe havens saw Treasury yields fall and the dollar back away from recent highs. However, not even this data is enough to dislodge the dollar’s pole position in the G10 FX space for May.
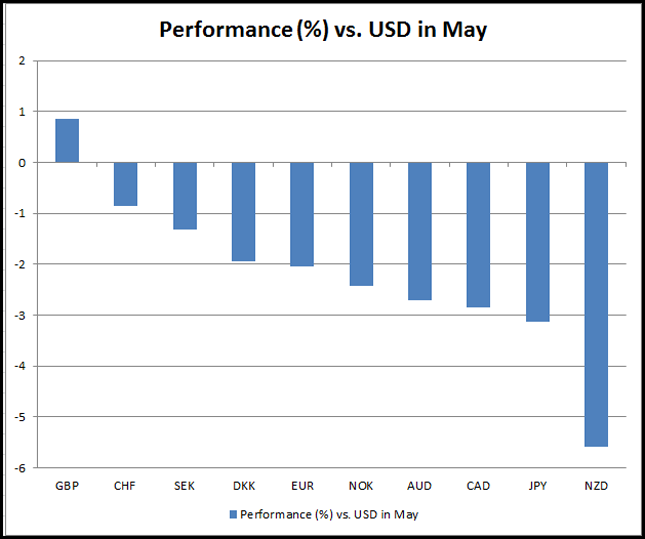
As you can see below, the dollar managed to outpace all of its G10 peers, with NZD suffering the most, dropping some 5.56% to a five-year low vs. the USD, while the JPY fell more than 3%, briefly sending USDJPY to its highest level for 12 years. The pound managed to eke out a gain vs. the USD this month, highlighting how powerful an election win for the Conservatives was for sterling.
But after such a strong performance, it is natural to see a bit of dollar short-covering as we move into June; this has been exacerbated by the US GDP data. However, we continue to think that the USD may strengthen further for a few reasons:
- The Fed seems willing to look through a period of weather-related GDP weakness and may still raise rates in 2H 2015
- US two-year Treasury yields are still only 60 basis points – surely they will have to move higher if we get more “hawkish” Fed rhetoric this month, which could add to the dollar’s attractiveness?
- The rest of the G10 are unlikely to hike ahead of the Fed, which should give the USD the yield advantage for some time to come
How to trade the USD:
We think that EURUSD could prove tricky in the next few days/weeks. A “kick-the-can-down-the-road” solution to the Greek problem that averts imminent bankruptcy could trigger a relief rally in the single currency.
As you can see below, dollar strength seems fairly well entrenched and may continue into June. We believe that the buck has the potential for further gains vs. the NZD (where the 2010 low at 0.6560 is now key support) and the JPY (where the next key level of resistance for USDJPY is 136.50 – the high from 2002). The pound also looks fragile, especially in light of a potential austerity-led slowdown in growth for the next few years, 1.5155 – a cluster of daily moving averages – could act as key support next week.
Takeaway:
The dollar triumphed vs. its G10 peers in May
Although the pound managed to eke out a gain vs. the buck, it has lost steam in recent weeks
The dollar starts June in a strong position; however, it may struggle vs. the EUR if we get a last-minute Greece deal
We believe the dollar may have further to go vs. the JPY and NZD after breaking through multi-year barriers that could open the way to further strength in the coming days.
The dollar is King for May, and we believe that it can last into June, although gains may not be as broad-based as May
Stocks: Why the FTSE 100 Could Be a Leading Indicator
There has been much market speculation of late that the global stock market rally could be running out of steam and stocks may be about to head lower. In fairness, stocks have had a fantastic run; the S&P has been in an uptrend since 2009 and has made record highs. Likewise, the Dax and the FTSE 100 have also reached fresh record territory in recent months. So is it time the markets turned lower?
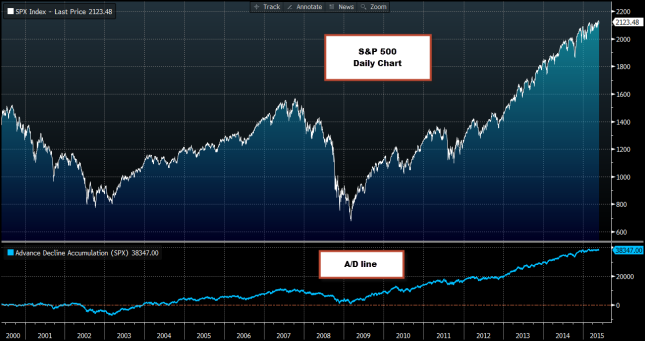
One way to gauge the strength of a stock market trend is to look at the Advance/ Decline line, otherwise known as the A/D line. The A/D line is the difference between the number of advancing and declining stocks in an index over a set period of time. It is used to determine the strength of a current trend, and to try and determine when a trend will change direction. When the market is advancing but the A/D line is declining this can be a sign that the market rally is losing steam. If the market is advancing at the same time as the A/D line is advancing it is considered a sign of a healthy market rally.
Below we take a look at the S&P 500, the German Dax and the FTSE 100 including their A/D lines, to see if we can find out anything about the strength of their current trends.
1. S&P 500
Source: Bloomberg.com. PLEASE NOTE THIS CHART DOES NOT REPRESENT THE PRICES OFFERED BY FOREX.com
2. FTSE 100
Source: Bloomberg.com. PLEASE NOTE THIS CHART DOES NOT REPRESENT THE PRICES OFFERED BY FOREX.com
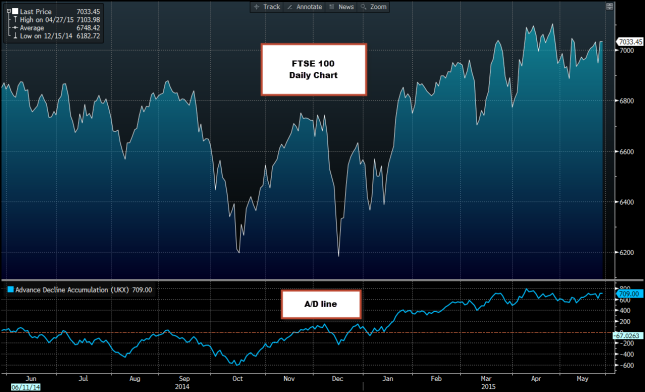
Similar to the S&P 500, the FTSE 100’s A/D line has also leveled off. The difference here is that it peaked in April, at the same time as the FTSE 100 made a record high. This suggests a couple of things: one, the FTSE 100 may have already peaked on 27th April at 7,103; two, the period of consolidation has already begun for the FTSE 100; three, the next big move for the FTSE 100 could happen sooner than it does for the S&P 500. If the A/D line turns south anytime soon, FTSE 100 traders should have their hardhats at the ready.
3. The Dax
Source: Bloomberg.com. PLEASE NOTE THIS CHART DOES NOT REPRESENT THE PRICES OFFERED BY FOREX.com
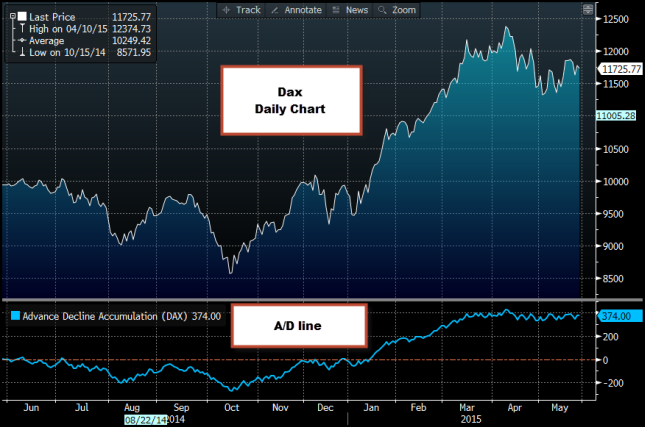
As with the S&P 500 and the FTSE 100, the Dax’s A/D line also suggests that the index is in a period of consolidation. It has been moving sideways since March, but the range of its A/D line is smaller than the range of the FTSE 100’s A/D line, suggesting that this index is happy to stay at a relatively high level for now. Whenever the A/D line moves sideways it is always worth watching closely to see if it heads south, suggesting that a change in trend could be imminent. For now, the A/D line supports the Dax remaining in its current range.
Conclusions:
- Our A/D analysis does not suggest that the markets will change direction any time soon
- The S&P 500 still has the strongest uptrend out of all the indices that we looked at
- Although the S&P 500 has the strongest uptrend, the A/D line has started to level off suggesting that we could encounter a period of consolidation
- The FTSE 100 has been in consolidation for the longest amount of time. Due to this, it is worth watching the FTSE 100 as it could be one of the first indices to change direction. If this happens, we would expect to see the A/D line head lower first
- The Dax’s A/D line is also flat-lining, which suggests that the Dax may continue to move sideways for the short term
Overall, market sentiment remains fairly strong, but it has lost its oomph of late which suggests that a prolonged period of consolidation could be on the cards during the summer months.
Look Ahead: Stocks
European stocks endured a volatile week, ending near the lows ahead of the weekend amid concerns over Greece. On Thursday, the IMF chief Lagarde had admitted that Greece exiting from the Eurozone was “a potential,” adding, “It’s very unlikely that we will reach a comprehensive solution in the next few days.” There are serious question marks over Athens’ ability to pay back the IMF €300 million it owes next week and €1.5bn by June 19. No one seems to be too sure whether the Greek government will be able to meet these obligations, and if it doesn’t, would that necessarily mean a default and an exit from the Eurozone? Making the matter more complicated is the fact that the ECB would be more likely not to discontinue its Emergency Liquidity Assistance to Greek banks in any event. Yet at the same time, hopes are still alive for a deal to be reached after all. An EU spokesman reportedly said on Friday that they are working only on a scenario that Grexit is avoided. On top of this, Jean-Claude Juncker, the President of the European Commission, said that the Greece issue will be resolved in the “coming days and weeks,” which sort of contradicted Lagarde’s remarks from the day before. As a result of this confusion, the European markets ended Friday’s session on the back foot. Clearly speculators were unwilling to take on too much risk going into the weekend.
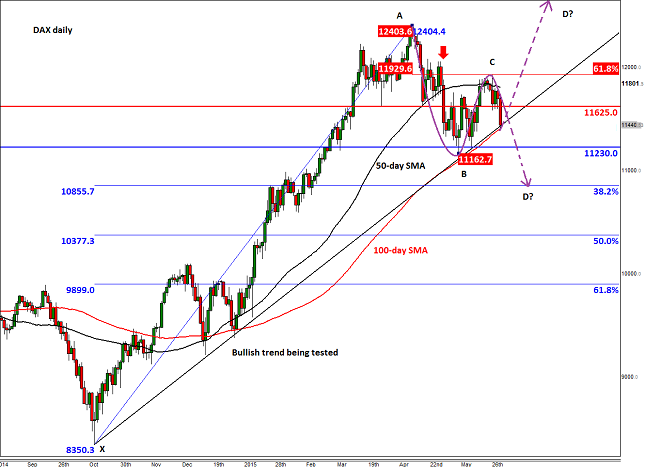
But it is not all about Greece next week; there will be plenty of economic numbers and other fundamental events to look forward to as well, not least the ECB’s latest monetary policy decision and the corresponding press conference by Mario Draghi on Wednesday. As ever, the German DAX index remains highly sensitive to the situation in Greece and changes (or expected changes) in monetary policy. At the time of this writing on Friday, the index was testing its medium-term bullish trend line and threatening to break lower. As we had warned previously, the index’s last significant bounce off this trend ended at just shy of 11930 earlier in the week; this level corresponds with the 61.8% Fibonacci retracement of the downswing from the April peak (12405). While the index holds below this Fibonacci level, the risks for a potential breakdown of the bullish trend remain high. But for the bullish trend to break, some sort of a stimulus such as an actual or expected Grexit would probably be a prerequisite. Given that this scenario is still unlikely to happen, the bulls may step in and defend the trend line here. The immediate resistance level they will then need to tackle is at 11625; thereafter is the 50-day moving average at just above 11800, and then the aforementioned Fibonacci level at 11930. However, if the trend breaks decisively, than the next stop may well be at the 38.2% Fibonacci level of the last major upswing at 10855.
Source: FOREX.com. Please note this product is not available to US clients
Look Ahead: Commodities
After suffering sharp losses up until Wednesday afternoon, crude oil prices bounced back equally sharply over the next couple of days to ensure a strong finish ahead of the weekend. On Wednesday afternoon traders realized that the summer driving season in the US had started with a bang, for according to the EIA not only had gasoline demand reached 9.73 million barrels the week before, which was the highest level since August 2007, there was also a sharp drawdown in gasoline stocks i.e. 3.31 million barrels. The EIA’s data also showed that the overall level of crude oil inventories in the US had declined by an additional 2.8 million barrels. This was thus the fourth consecutive decline in as many weeks. During this period, oil stocks have been reduced by a good 11.6 million barrels. Also aiding the oil rally at the end of the week was the slightly retreating US dollar which had rallied sharply at the start of the week. The greenback will be in focus next week as we will have a number of high-impact data scheduled, not least the nonfarm payrolls data on Friday. If the dollar finds support again then this may prevent oil from rising more significantly. In fact, Friday will be a very important day for oil because that is when the OPEC’s next meeting is scheduled. The cartel is widely expected to confirm its output target of 30 million barrels per day and thus maintain its strategy of defending market share. If seen, this may keep a lid on Brent oil prices going forward.
Despite the sharper-than-expected drawdown in US oil stocks, the Brent-WTI remains above $5, having collapsed to a mid-April low of about $4.50 in mid-week. Still, this is considerably lower than just a few months ago when the gap was about double this figure. Evidently, traders are surprised by the resilience of US oil, while at the same time they have grown bearish on Brent because of the continued rise in OPEC output. Saudi and Iraq are already producing more oil than is needed and soon Iran could join them if its sanctions are eased further or removed completely. On top of this, oil demand from China could ease if its economy cools down even more (hence, next week’s data from China, including the Manufacturing PMI on Monday, will be important for oil traders to watch). Thus, there is a chance that the price gap may get eliminated completely or even reverse. That said, it is highly unlikely for WTI to trade at a premium over Brent for a sustainable period of time. After all, if US oil stabilizes around the current levels then there will be no incentive for shale producers to scale back operations more than they already have. This may mean therefore that the excessive US oil surplus will remain in place for the foreseeable future and thus absorb any small positive demand shocks.
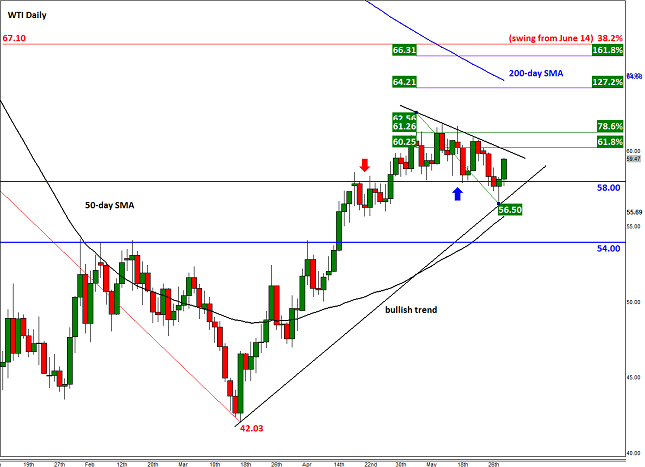
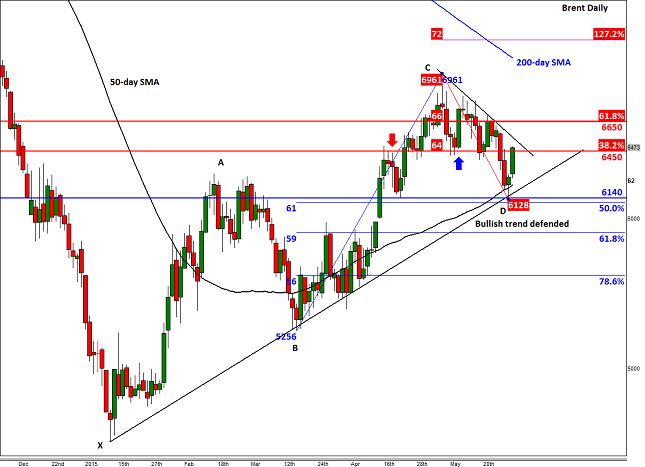
The technical outlook for oil has turned bullish once more following the sharp rally at the end of the week. WTI has broken back above the pivotal $58.00 handle, thereby invalidating the bearish triangle breakout that had occurred earlier in the week. A new bullish trend line has now been established as a result: for as long as WTI holds above this, the trend would thus remain bullish. Some potential resistance levels to watch for US oil include the 61.8% Fibonacci retracement of the most recent downswing at $60.25, which also corresponds with a short-term bearish trend. Thereafter, the May high of $62.55 would be the next key level to watch and then the extension levels at $64.20 (127.2%) and $66.30 (161.8%). The 200-day moving average at $64.65 may also offer some resistance, should we get there. As before, the key support level to watch is $58.00. Below here is the weekly low at $56.50 and then the old major resistance level at $54.00. Brent meanwhile has rallied sharply off its bullish trend line around $61. The next logical bullish target could be the 61.8% Fibonacci level at $66.50 and then the May high at $69.60. Meanwhile a potential break below the trend line could expose the 61.8% Fibonacci retracement level of the most recent upswing at $59 for a test.
Source: FOREX.com. Please note this product is not available to US clients
Source: FOREX.com. Please note this product is not available to US clients
Global Data Highlights
US:
Monday, June 1, 2015
12:30 GMT PCE Data, April
This is the Fed’s preferred measure of inflation. Although this information looks fairly old, the core PCE rate is still worth watching. It is expected to show a slight increase of 0.2% on the month, with the core annual rate rising to 1.4% from 1.3%. This is below the Fed’s 2% target, but is no way near deflation zone, so it could add fuel to expectations that the Fed will hike rates later this year. If we get stronger PCE data then we could see a bounce in the USD.
14:00 GMT ISM manufacturing, May
This timely data is expected to show a pick-up to 52.0 last month from 51.5 in April. We are also expecting an increase in the prices paid component to 43 from 40.5. Although this still suggests that prices are falling, the pace of decline could be starting to slow. Overall, this data may reinforce the belief that the Q1 GDP slowdown was a one-off weather-related blip.
Wednesday, June 3, 2015
1215 GMT ADP report, May
This is the first of a torrent of employment data due this week from the US, and it is likely to show that the private sector of the US economy created a respectable 198k jobs. Although this jobs report does not have a perfect correlation to the actual NFP number, it could give the dollar a boost if we get a 200k+ figure.
14:00 GMT ISM non-manufacturing, May
This is a key data release that measures the important service sector of the US economy. The market is expecting a slight decline to 57 from 57.8 in April. Overall, this index has been at elevated levels and we expect last month’s data to continue in this trend. This data should also reinforce that the Q1 GDP decline was a minor blip.
Friday, June 5, 2015
12:30 GMT US employment data, May
This is what everyone is waiting for this week. The market expects another strong NFP figure of 221k from 213k in April. The unemployment rate is expected to stay steady at 5.4%. Wages are also worth watching out for: the market expects a 0.2% increase, while the annual rate is expected to remain steady at 2.2%. Any better-than-expected data could give the dollar a boost.
Europe:
Monday, June 1, 2015
08:30 GMT PMI manufacturing (UK), May
The market expects the a pick up to 52.from 51.9 in April, which could reinforce the belief that UK growth may have picked up after a disappointing 0.3% GDP increase in Q1.
Tuesday, June 2, 2015
09:00 GMT CPI estimate, May
All eyes will be on this important CPI reading for May, the market expects another positive reading of 0.2%, which would add to evidence that the Eurozone is, at long last, exiting deflation. Core inflation is also expected to rise to 0.7%, its highest level since March. Even though the Eurozone may have exited deflation, we believe that the ECB will maintain its QE program; thus, unless we see a big upward surprise to CPI for May, we doubt that this will have a major impact on the EUR.
14:00 GMT ISM non-manufacturing, May
This is a key data release that measures the important service sector of the US economy. The market is expecting a slight decline to 57 from 57.8 in April. Overall, this index has been at elevated levels and we expect last month’s data to continue in this trend. This data should also reinforce that the Q1 GDP decline was a minor blip.
Wednesday, June 3, 2015
08:30 GMT Services PMI (UK)
The market expects a slight moderation in this data, to 59.2 from 59.5 for May, however this index is expected to remain at a relatively high level. We think that this data will add to the evidence that the UK economy has picked up in Q2 after a disappointing 0.3% GDP reading fort Q1.
09:00 GMT Unemployment rate, Eurozone, April
The market expects a slight moderation to 11.2% for April, down from 11.3% in March, but this is still an elevated level and suggests that the Eurozone economy remains in trouble. This may also support the ECB’s QE program, which could keep a lid on EUR gains.
09:00 GMT Retail sales, Eurozone, April
The market expects a large increase in April sales, rising to 0.6%, which is expected to push the annual rate to 2%. The risk is to the upside after a surge in German retail sales in April.
Thursday, June 4, 2015
11:00 GMT BOE rate decision
No change is expected and thus we do not expect much reaction from sterling or other UK assets. More important could be the minutes from this meeting, which will be released on 17th June, where we will get more information on the potential for a BOE rate hike down the line.
11:45 GMT ECB decision
The ECB is not expected to make any changes at this meeting. We expect Draghi and co. to reinforce that its QE program is here to stay. Draghi could also get quizzed on the bank’s contingency plans on the back of a potential Grexit; however, we doubt that he will give much away.
Friday, June 5, 2015
09:00 GMT GDP (Eurozone), Q1
GDP is expected to remain at 0.4%, with the annual rate at 1%. This looks fairly healthy, especially when compared with the US growth decline in Q1. The detail is also expected to remain strong, with investment and household consumption rising at 0.6% each. Public spending is also expected to rise a touch to 0.3% from 0.2%.
Information on these pages contains forward-looking statements that involve risks and uncertainties. Markets and instruments profiled on this page are for informational purposes only and should not in any way come across as a recommendation to buy or sell in these assets. You should do your own thorough research before making any investment decisions. FXStreet does not in any way guarantee that this information is free from mistakes, errors, or material misstatements. It also does not guarantee that this information is of a timely nature. Investing in Open Markets involves a great deal of risk, including the loss of all or a portion of your investment, as well as emotional distress. All risks, losses and costs associated with investing, including total loss of principal, are your responsibility. The views and opinions expressed in this article are those of the authors and do not necessarily reflect the official policy or position of FXStreet nor its advertisers. The author will not be held responsible for information that is found at the end of links posted on this page.
If not otherwise explicitly mentioned in the body of the article, at the time of writing, the author has no position in any stock mentioned in this article and no business relationship with any company mentioned. The author has not received compensation for writing this article, other than from FXStreet.
FXStreet and the author do not provide personalized recommendations. The author makes no representations as to the accuracy, completeness, or suitability of this information. FXStreet and the author will not be liable for any errors, omissions or any losses, injuries or damages arising from this information and its display or use. Errors and omissions excepted.
The author and FXStreet are not registered investment advisors and nothing in this article is intended to be investment advice.
Recommended Content
Editors’ Picks
EUR/USD edges lower toward 1.0700 post-US PCE

EUR/USD stays under modest bearish pressure but manages to hold above 1.0700 in the American session on Friday. The US Dollar (USD) gathers strength against its rivals after the stronger-than-forecast PCE inflation data, not allowing the pair to gain traction.
GBP/USD retreats to 1.2500 on renewed USD strength

GBP/USD lost its traction and turned negative on the day near 1.2500. Following the stronger-than-expected PCE inflation readings from the US, the USD stays resilient and makes it difficult for the pair to gather recovery momentum.
Gold struggles to hold above $2,350 following US inflation

Gold turned south and declined toward $2,340, erasing a large portion of its daily gains, as the USD benefited from PCE inflation data. The benchmark 10-year US yield, however, stays in negative territory and helps XAU/USD limit its losses.
Bitcoin Weekly Forecast: BTC’s next breakout could propel it to $80,000 Premium

Bitcoin’s recent price consolidation could be nearing its end as technical indicators and on-chain metrics suggest a potential upward breakout. However, this move would not be straightforward and could punish impatient investors.
Week ahead – Hawkish risk as Fed and NFP on tap, Eurozone data eyed too

Fed meets on Wednesday as US inflation stays elevated. Will Friday’s jobs report bring relief or more angst for the markets? Eurozone flash GDP and CPI numbers in focus for the Euro.
