![]()
By the end of today’s session we may have a good idea in terms of whether the so-called “Santa Claus Rally” is still on for stocks. Not only do the major indices look oversold from a technical point of view, there is also the potential for the Federal Reserve to deliver a surprisingly dovish statement at the conclusion of the FOMC meeting this evening. Although the employment situation is continuing to improve, there is a risk that inflation may start heading lower once again from its current 1.7% rate and away from the Fed’s 2% target due to the recent plunge in oil prices. So, if the FOMC or the Fed Chair Janet Yellen sound concerned about path of inflation in 2015 then the market’s expectations regarding the timing of the first rate hike may be pushed further out. If so, stocks could find some much-needed support today. That said, deflationary concerns in the Eurozone and the currency crisis in Russia and some other emerging markets are still weighing on risk sentiment and there could yet be further falls before the markets bottom out.
Technical outlook
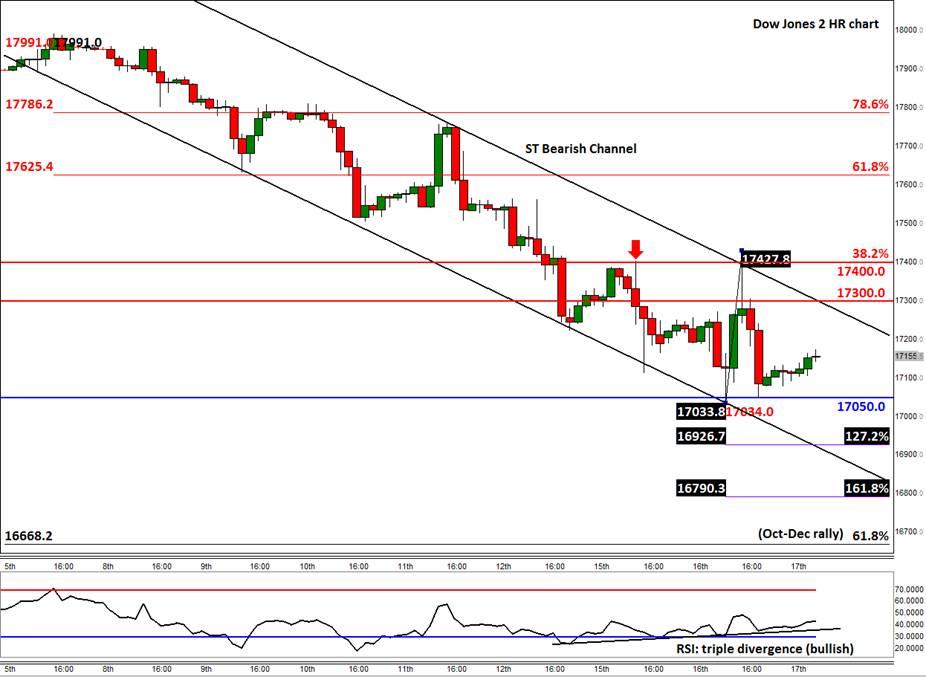
As can be seen on the 2-hour chart of the Dow, yesterday’s rally came to an abrupt halt after the buyers failed to hold their ground above 17400. As well as the prior high and the resistance trend of the bearish channel, this level also marks the 38.2% Fibonacci retracement of the recent sell-off from the record high. In other words, the bulls lacked conviction to increase their positions above a key technical area. Sensing this, the bears quickly moved in and drove the index lower before booking profit near the prior low at 17050. From here, the index future has drifted slightly higher but it still remains in danger of dropping further lower as it descends inside the bearish channel.
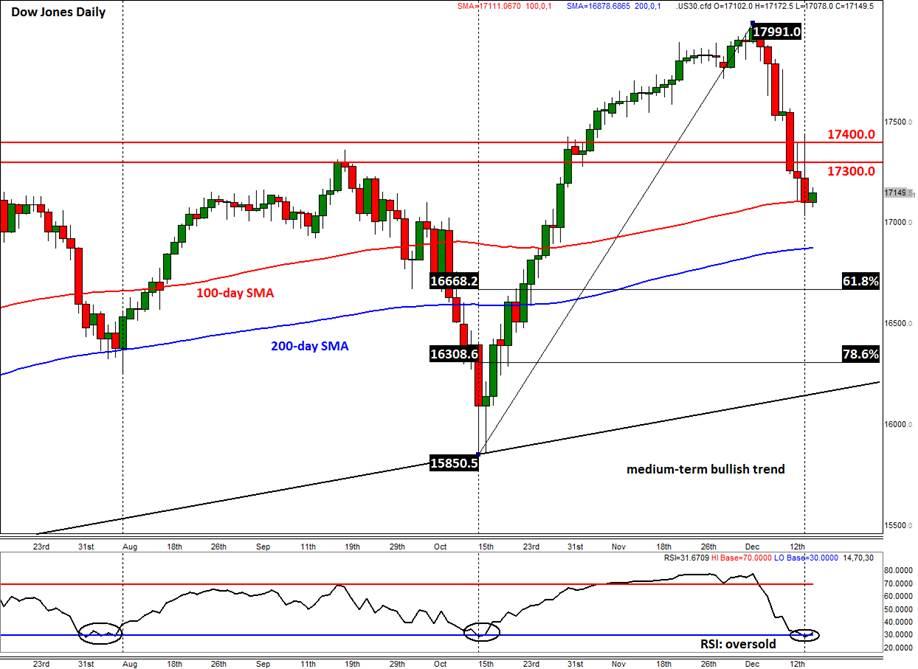
Indeed, a potential break below the 17050 support level could pave the way for a move towards the Fibonacci extension levels of yesterday’s range, at 16925 (127.2%) and then 16790 (161.8%). But as shown on the daily chart, in-between these Fibonacci extension levels is the 200-day moving average, which comes in at 16880. And further lower still is the 61.8% Fibonacci retracement level of the upswing from the October low, at 16670. The index could find support from any of these levels.
Meanwhile a closely-watched momentum indicator, the Relative Strength Index (RSI), is currently pointing to a potentially bullish scenario at these current levels. The daily RSI has already drifted in the oversold level of below 30. The last couple of times the RSI was at this level, a significant rally followed in the markets. Thus if history were to repeat itself, another leg higher could start as early as today. Meanwhile the RSI on the intraday chart has created a triple positive divergence i.e. it has made 3 higher lows even though the underlying Dow Jones index has formed lower lows. This also suggests that the bearish momentum is weakening, which is thus a potentially bullish development.
So, while there is potential for further losses, we have seen some bullish indications too. Thus going forward, the bulls should watch the resistance trend of the short term bearish channel closely, for a break above it could mark the resumption of the long-term bullish trend. This comes in around 17300. If broken, the first resistance to watch is that 17400 level that I mentioned above. Thereafter the next potential resistance levels are the 61.8 and 78.6 per cent Fibonacci retracements at 17625 and 17785 respectively.
Trading leveraged products such as FX, CFDs and Spread Bets carry a high level of risk which means you could lose your capital and is therefore not suitable for all investors. All of this website’s contents and information provided by Fawad Razaqzada elsewhere, such as on telegram and other social channels, including news, opinions, market analyses, trade ideas, trade signals or other information are solely provided as general market commentary and do not constitute a recommendation or investment advice. Please ensure you fully understand the risks involved by reading our disclaimer, terms and policies.
Recommended Content
Editors’ Picks

EUR/USD consolidates weekly gains above 1.1150
EUR/USD moves up and down in a narrow channel slightly above 1.1150 on Friday. In the absence of high-tier macroeconomic data releases, comments from central bank officials and the risk mood could drive the pair's action heading into the weekend.

GBP/USD stabilizes near 1.3300, looks to post strong weekly gains
GBP/USD trades modestly higher on the day near 1.3300, supported by the upbeat UK Retail Sales data for August. The pair remains on track to end the week, which featured Fed and BoE policy decisions, with strong gains.

Gold extends rally to new record-high above $2,610
Gold (XAU/USD) preserves its bullish momentum and trades at a new all-time high above $2,610 on Friday. Heightened expectations that global central banks will follow the Fed in easing policy and slashing rates lift XAU/USD.

Week ahead – SNB to cut again, RBA to stand pat, PCE inflation also on tap
SNB is expected to ease for third time; might cut by 50bps. RBA to hold rates but could turn less hawkish as CPI falls. After inaugural Fed cut, attention turns to PCE inflation.

Bank of Japan set to keep rates on hold after July’s hike shocked markets
The Bank of Japan is expected to keep its short-term interest rate target between 0.15% and 0.25% on Friday, following the conclusion of its two-day monetary policy review. The decision is set to be announced during the early Asian session.

Moneta Markets review 2024: All you need to know
VERIFIED In this review, the FXStreet team provides an independent and thorough analysis based on direct testing and real experiences with Moneta Markets – an excellent broker for novice to intermediate forex traders who want to broaden their knowledge base.

