![]()
As reflected in the falling price of gold over the past three sessions, traders are clearly not feeling confident that Switzerland will vote ‘Yes’ on Sunday’s referendum on the Swiss National Bank’s gold reserves. The proposal would require the SNB to hold gold reserves equivalent to 20% of its total assets. Not only that, but all Swiss gold held with foreign central banks would need to be repatriated and the SNB would never be allowed to sell them in the future. Some might argue, what’s the point then? Clearly such a commitment would make it extremely difficult for the SNB to effectively achieve its monetary policy objectives and may even be forced to abandon the 1.20 peg in EUR/CHF. So, I am extremely sceptical that the Yes vote will win. Thus it is likely that the gold price would not only move sharply lower on Sunday night, it could even gap down as the market prices out the possibility of SNB purchases. On the other hand, if the Yes vote wins, gold could absolutely soar as this would mean that the SNB will need to accumulate some 1,500 tonnes of the yellow metal – a huge amount – over 5 years. My colleague Kathleen Brooks has written more on this in greater detail – click HERE to view her article.
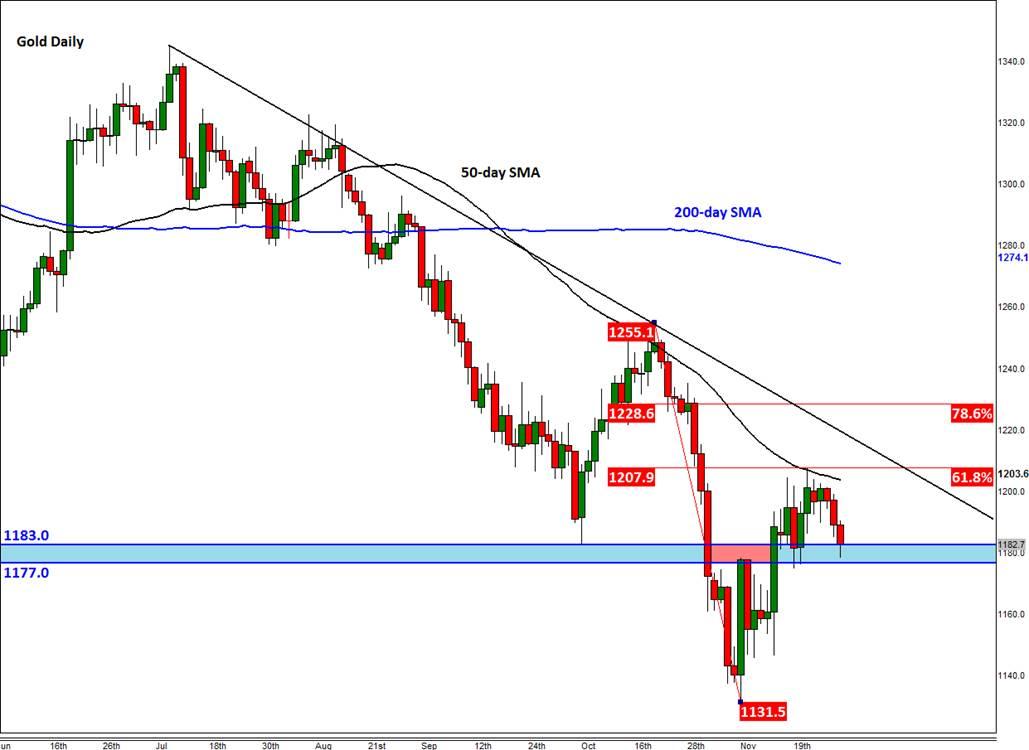
So, there is potential for a sharp move in the price of gold – and indeed the EUR/CHF currency pair –on Sunday night. Traders should therefore watch their key support and resistance levels with extra care. Below I have attached two charts of gold – the daily and 1 hour time frames. On the daily chart (figure 1), it is clear that the longer term trend is still bearish, even though price is holding above the key $1170 to $1183 support range, or more generally the area round $1180. This region had been support and resistance in the past. So, a potential closing break below here today could attracts fresh selling next week, particularly if the ‘No’ camp wins the referendum on Sunday. The key resistance level to watch is the area between the 50-day moving average and the 61.8% Fibonacci retirement level at $1203.5 to $1208.0. Beyond this level there is the bearish trend line and then the 78.6% Fibonacci level at $1228/9.
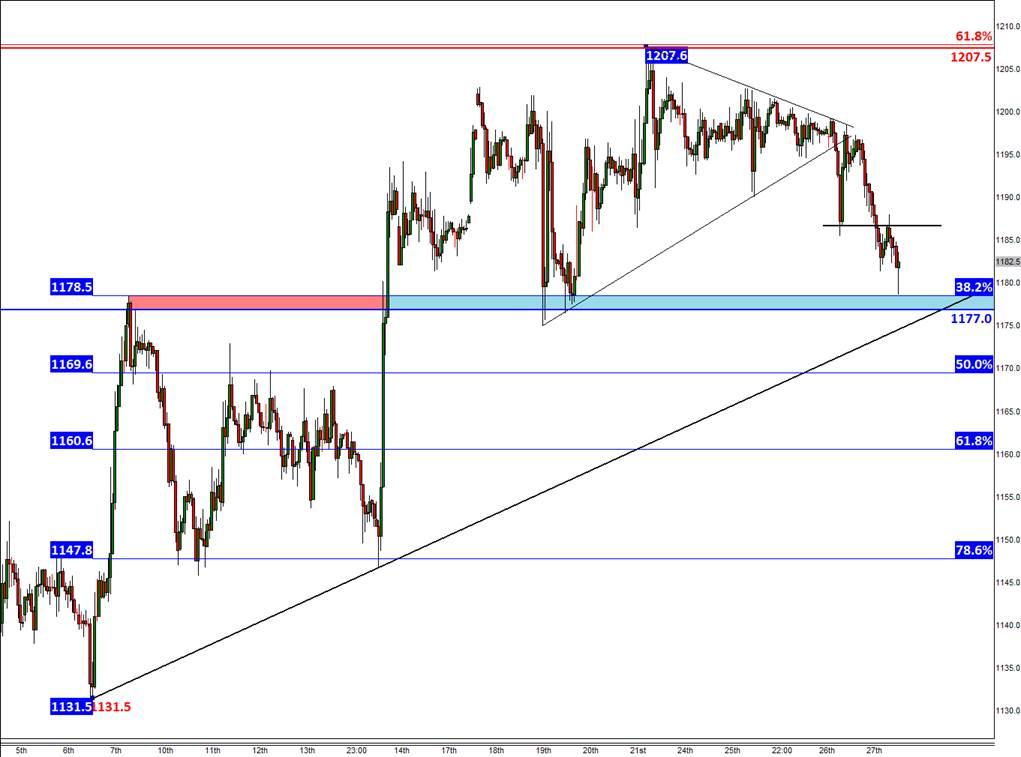
Meanwhile on the 1-hour chart (figure 2), the short-term bullish trend is still intact. Price is holding above the shallow 38.2% Fibonacci retracement level of the up move from this month’s low, at $1178.5; support around $1177.0, and a short-term bullish trend circa $1175. Thus a potential break below $1175 would be a bearish development. In that case, gold could easily drop to the 61.8% Fibonacci retracement at $1160.5 before deciding on its next move. The 78.6% Fibonacci level comes in at $1148 and the monthly low or the 100% retracement level is at $1131.5.
Trading leveraged products such as FX, CFDs and Spread Bets carry a high level of risk which means you could lose your capital and is therefore not suitable for all investors. All of this website’s contents and information provided by Fawad Razaqzada elsewhere, such as on telegram and other social channels, including news, opinions, market analyses, trade ideas, trade signals or other information are solely provided as general market commentary and do not constitute a recommendation or investment advice. Please ensure you fully understand the risks involved by reading our disclaimer, terms and policies.
Recommended Content
Editors’ Picks
AUD/USD gains momentum above 0.6500 ahead of Australian Retail Sales data

AUD/USD trades in positive territory for six consecutive days around 0.6535 during the early Asian session on Monday. The upward momentum of the pair is bolstered by the hawkish stance from the Reserve Bank of Australia after the recent release of Consumer Price Index inflation data last week.
EUR/USD: Federal Reserve and Nonfarm Payrolls spell action this week

The EUR/USD pair temporarily reconquered the 1.0700 threshold last week, settling at around that round level. The US Dollar lost its appeal following discouraging United States macroeconomic data indicating tepid growth and persistent inflationary pressures.
Gold: Strength of $2,300 support is an encouraging sign for bulls

Gold price started last week under heavy bearish pressure and registered its largest one-day loss of the year on Monday. The pair managed to stage a rebound in the second half of the week but closed in negative territory.
Ethereum fees drops to lowest level since October, ETH sustains above $3,200

Ethereum’s high transaction fees has been a sticky issue for the blockchain in the past. This led to Layer 2 chains and scaling solutions developing alternatives for users looking to transact at a lower cost.
Week ahead – Hawkish risk as Fed and NFP on tap, Eurozone data eyed too

Fed meets on Wednesday as US inflation stays elevated. Will Friday’s jobs report bring relief or more angst for the markets? Eurozone flash GDP and CPI numbers in focus for the Euro.

