EUR/USD
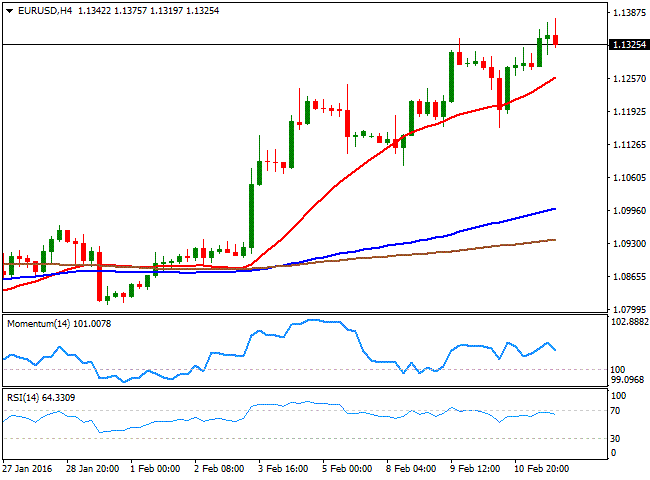
Risk aversion reached a new peak this Thursday, as oil prices plummeted towards $26.00 a barrel before bouncing some, while worldwide stocks sunk with the banking sector leading the decline amid increasing fears the new negative rate policy, will hit banks' profitability. Sweden's Riksbank surprised the market by delivering a 15bp rate cut today to take the repot rate to minus 50bp, fueling the negative mood among investors mid European session, while in the US, weekly unemployment claims fell down to 269K in the week ending February 5. The EUR/USD pair advanced to a fresh 4month high of 1.1375 before retreating partially, but remains firmly above 1.1300, consolidating its latest gains, and overall maintaining the bullish tone. That trend will be challenged during the upcoming European session, with the release of several macroeconomic figures, which include German inflation and the EU Gross Domestic Product. Should the data surprise to the upside, the pair can continue rallying up to 1.1460, particularly if the dollar retains the negative tone. Technically, the 4 hours chart shows that the 20 SMA heads higher around 1.1250, acting as a strong support in the case of further slides, while the technical indicators have lost upward steam and are currently heading lower within positive territory, suggesting the pair may correct lower, but far from signaling the end of the bullish trend.
Support levels: 1.1290 1.1245 1.1210
Resistance levels: 1.1385 1.1420 1.1460
GBP/USD
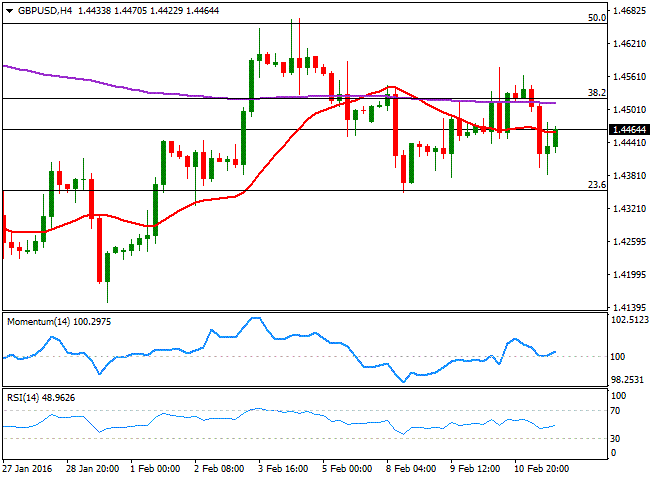
The British Pound was unable to attract investors, despite the generalized dollar's weakness, and the pair ended the day in the red. The GBP/USD pair advanced up to 1.4563 during the Asian session, but the movement was faded early Europe, as oil prices fell down to fresh multiyear lows, while the UK bond yields plummeted to record lows. There will be no macro released in Britain this Friday, which means that the pair will continue trading on sentiment. Technically, the 1 hour chart shows that the 20 SMA presents a strong bearish slope above the current level, in the 1.4490 region, while the technical indicators head higher within bearish territory. In the 4 hours chart, the technical indicators are aiming higher from their midlines, although with limited upward strength, while the price is struggling around a horizontal 20 SMA. A strong resistance continues being the 1.4520/30 region, as spikes beyond the level have result in sharp retracements several times over this last few days. Anyway and to confirm further rallies, the pair needs to advance beyond 1.4660, last week highs.
Support levels: 1.4410 1.4385 1.4350
Resistance levels: 1.4490 1.4535 1.4560
USD/JPY
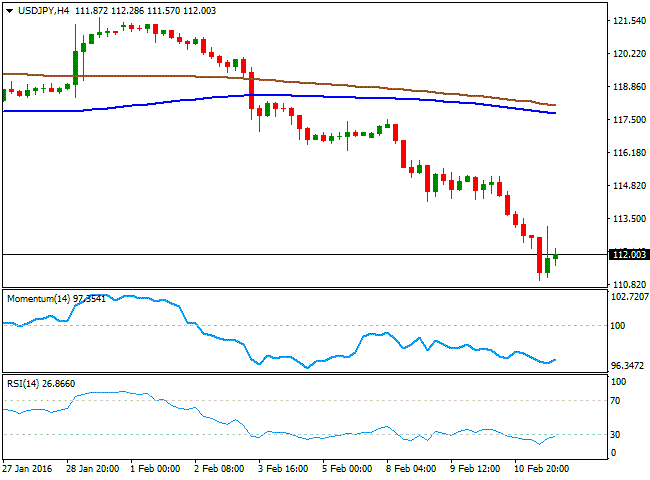
The USD/JPY fell over 250 pips this Thursday, down to 110.97 accumulating over 1,000 pips to the downside in less than two weeks, after peaking at 121.68 on BOJ's decision to cut rates into negative territory in their late January meeting. But during the European session, the pair jumped up to 113.17, on unconfirmed rumors that the Bank of Japan intervened in the FX markets to halt the appreciation of Yen. Besides that, speculation of some actual intervention during the upcoming session have increased as the day went by, and investors are actually expecting a bit more than the verbal intervention seen these last few days. From a technical point of view, the risk remains towards the downside, as in the 1 hour chart, the technical indicators are aiming to resume their declines within bearish territory, following a correction from extreme oversold levels. In the 4 hours chart, the technical indicators have posted tepid bounces, but remain within oversold readings, giving no signs of a change in the dominant trend.
Support levels: 111.60 111.20 110.70
Resistance levels: 112.35 112.75 113.20
GOLD
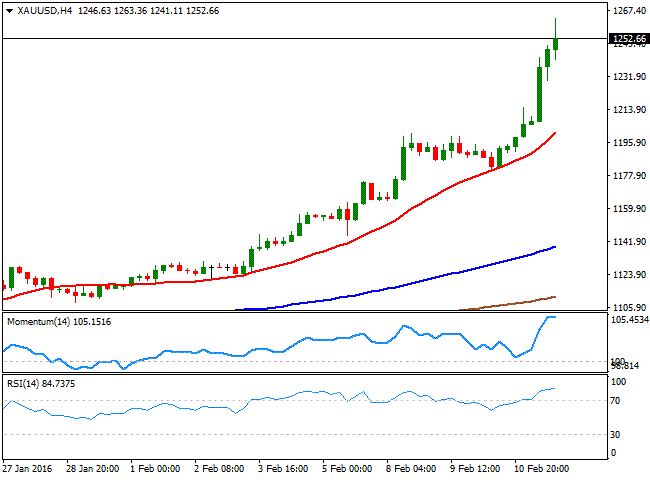
Gold's rally reached a 1year high this Thursday, benefited by the ongoing market turmoil sending investors towards safehaven assets. Spot reached a daily high of $1,263.36 a troy ounce, adding nearly 5% on the day, before easing some, now trading above 1,250.00. Plummeting bond yields worldwide also supported the commodity that advanced almost 20% ever since the year started. The rally is way overstretched, and the daily chart shows that the RSI indicator heads north around 85, while the Momentum indicator also heads north in extreme overbought levels, maintaining the bullish trend firm in place. Nevertheless, it seems to be a bit too late to join the buying party as there are high chances of some profit taking ahead of the weekend for this Friday. In the 4 hours chart, the technical indicators are losing upward strength, but remain at extreme levels, while the 20 SMA heads sharply higher around 1,201.00, providing a strong support in the case of a downward movement.
Support levels: 1,248.45 1,229.57 1,220.90
Resistance levels: 1,263.40 1,271.25 1,283.10
WTI CRUDE
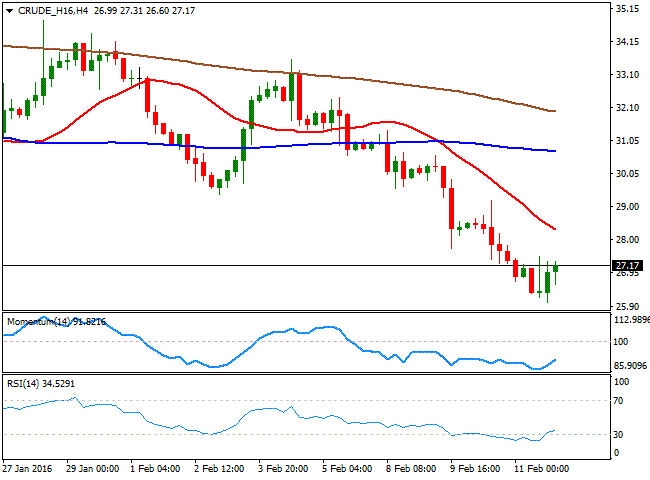
After settling at its lowest level in almost 13 years, crude oil prices turned higher and jumped amid headlines suggesting the OPEC is willing to cooperate on an output cut. West Texas Intermediate crude futures settled at $26.21 a barrel on the New York Mercantile Exchange, bouncing $1.00 on the mentioned headlines, but still trading within the lower band of its daily range. Early Thursday, news made the rounds of a Venezuelan proposal to freeze oil output at current levels, in an attempt to halt prices' declines. Saudi Arabia welcomed the proposal, but wants Iran to join the agreement also, something this latest is not willing to do. WTI crude futures are closing in the red for sixth day in arow, and with the daily chart showing a lower low and a lower high, as the technical indicators continue to head lower near oversold levels, supporting some further declines towards the 25.00 level. In the shorter term, and according to the 4 hours chart, the outlook is also bearish, as the RSI indicator is turning back lower within oversold levels after a limited upward correction, while 20 SMA extended its decline further, now acting as a strong dynamic resistance around 28.20.
Support levels: 26.00 25.50 24.90
Resistance levels: 27.40 28.20 29.00
DAX
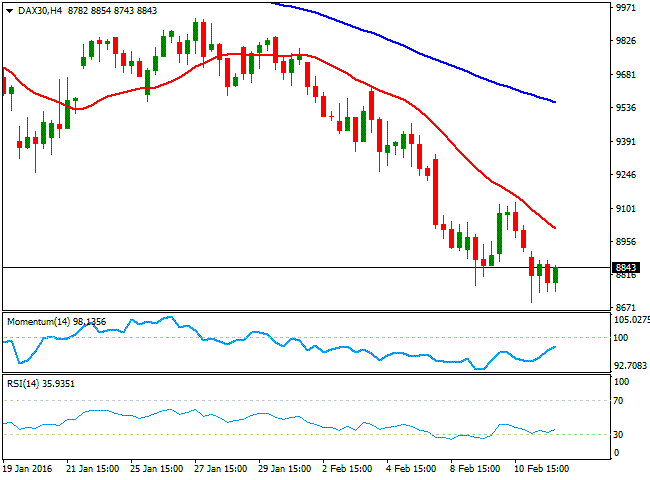
European equities edged sharply lower, with banks' shares falling to multiyear lows, on mounting concerns over Central Banks applying negative rates and yet being unable to prompt economic recovery. Also in the dark side was oil, down to almost 13year lows and dragging energy related shares down. Deutsche Bank shares plunged more than 7% after Wednesday's rally, weighed by speculation the bank can go down. The German DAX closed at 8.752.87, 2.93% lower, and the daily chart maintains the bearish tone seen on previous updates, although the index has managed to trim most of its daily losses in afterhours trading. In the mentioned chart, the Momentum indicator heads south near oversold readings, while the RSI indicator consolidates around 30, far from suggesting an upward move. In the 4 hours chart, the technical indicators have bounced from oversold levels, but remain well below their midlines, while the 20 SMA caps the upside with its bearish slope around 9,014.
Support levels: 8,743 8,692 8,620
Resistance levels: 8,874 8,960 9,014
DOW JONES
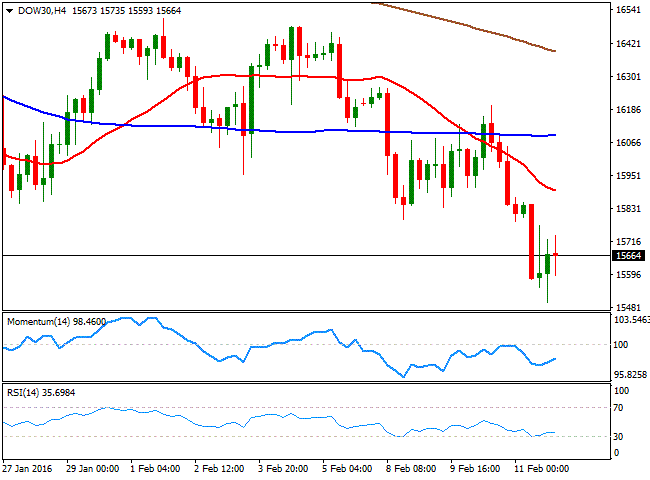
Wall Street resumed its decline this Thursday, after a short lived relief rally on Wednesday, with the Dow Jones Industrial Average ending the day down 1.60% or 254 points at 15,660.18, the Nasdaq down 0.39% to 4,266.84, and the S and P down 1.23% to 1,829.08. Risk aversion was behind the sharp decline, led by a decline in bank's stocks and oil, which fell to its lowest level since 2013 near $26.00 a barrel. The daily chart for the DJIA shows that the index retains the strong negative tone seen on previous updates, as the technical indicators head sharply lower below their midlines, whilst the index extended further below its 20 SMA, which slowly turns lower in the 16,100 region. In the 4 hours chart the 20 SMA has extended further below the 100 SMA, both well above the current level, whilst the technical indicators have managed to recover from near oversold levels, but remain deep into negative territory, far from suggesting a stronger recovery for this Friday.
Support levels: 15,593 15,497 15,410
Resistance levels: 15,735 15,809 15,892
FTSE 100
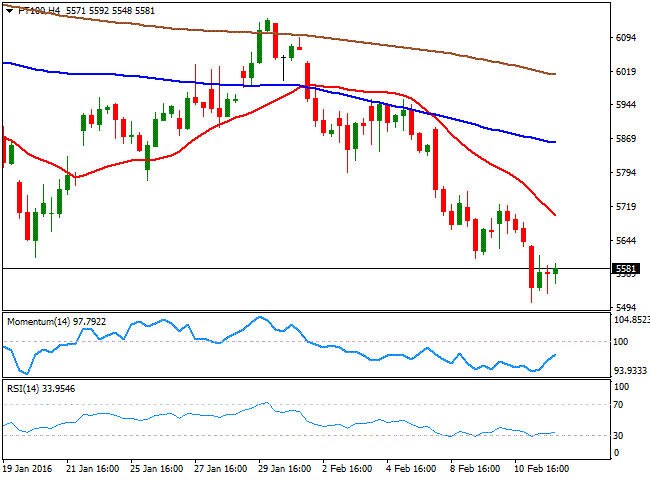
The FTSE 100 closed the day down 2.39%, at 5,536.97, down to its lowest level in three years, on fears a banking crisis may be just around the corner. Barclays was 5% lower, Standard Chartered dropped 3% and Royal Bank of Scotland fell 2%. Commodity related shares also plummeted, with Glencore down 6.22% after it reported lower fourth quarter copper and zinc output. Anglo America ended the day down 3.4% while BHP Billiton shed 3.01%. Daily basis, the bearish tone not only prevails, but also deepened, as the Momentum indicator heads south almost vertically as it approaches oversold readings, while the RSI indicator also heads south near 33. Shorter term and according to the 4 hours chart, the index seems to have entered consolidative mode, which helped technical indicators to correct partially higher. Nevertheless, the risk remains towards the downside, as the ongoing decline is being driven by sentiment, with a break below 5,505, the daily low, required to confirm a new leg south.
Support levels: 5,562 5,505 5,496
Resistance levels: 5,605 5,692 5,760
The information set forth herein was obtained from sources which we believe to be reliable, but its accuracy cannot be guaranteed. It is not intended to be an offer, or the solicitation of any offer, to buy or sell the products or instruments referred herein. Any person placing reliance on this commentary to undertake trading does so entirely at their own risk.
Recommended Content
Editors’ Picks

EUR/USD consolidates weekly gains above 1.1150
EUR/USD moves up and down in a narrow channel slightly above 1.1150 on Friday. In the absence of high-tier macroeconomic data releases, comments from central bank officials and the risk mood could drive the pair's action heading into the weekend.

GBP/USD stabilizes near 1.3300, looks to post strong weekly gains
GBP/USD trades modestly higher on the day near 1.3300, supported by the upbeat UK Retail Sales data for August. The pair remains on track to end the week, which featured Fed and BoE policy decisions, with strong gains.

Gold extends rally to new record-high above $2,610
Gold (XAU/USD) preserves its bullish momentum and trades at a new all-time high above $2,610 on Friday. Heightened expectations that global central banks will follow the Fed in easing policy and slashing rates lift XAU/USD.

Week ahead – SNB to cut again, RBA to stand pat, PCE inflation also on tap
SNB is expected to ease for third time; might cut by 50bps. RBA to hold rates but could turn less hawkish as CPI falls. After inaugural Fed cut, attention turns to PCE inflation.

Bank of Japan set to keep rates on hold after July’s hike shocked markets
The Bank of Japan is expected to keep its short-term interest rate target between 0.15% and 0.25% on Friday, following the conclusion of its two-day monetary policy review. The decision is set to be announced during the early Asian session.

Moneta Markets review 2024: All you need to know
VERIFIED In this review, the FXStreet team provides an independent and thorough analysis based on direct testing and real experiences with Moneta Markets – an excellent broker for novice to intermediate forex traders who want to broaden their knowledge base.
