![]() Fawad Razaqzada
Fawad Razaqzada
TradingCandles.com
Yesterday we looked at a long-term chart of the EUR/USD and highlighted the fact that the Fibre was testing a key resistance zone in the 1.1320-65 area (old support, underside of a broken bullish trend and 61.8% Fibonacci level). Today, we are looking at the technical outlook for the Dollar Index, which is a measure of the buck relative to a basket of foreign currencies.
The Dollar Index (DXY) basically moves inversely to the EUR/USD, as the euro has a weighting of more than 50% on the index. So, it is a very important market to watch for the FX traders, especially for the EUR/USD (57.6% weighting), followed by the USD/JPY (13.6%), GBP/USD (11.9%) and then the USD/CAD (9.1%).
Now, the DXY has been stuck in a sideways range for one and a half years. In range-bound market conditions, I have found that harmonic price patterns tend to work better than in trending markets – I am talking about the Gartleys, Butterflies, Bats and AB=CDs etc.
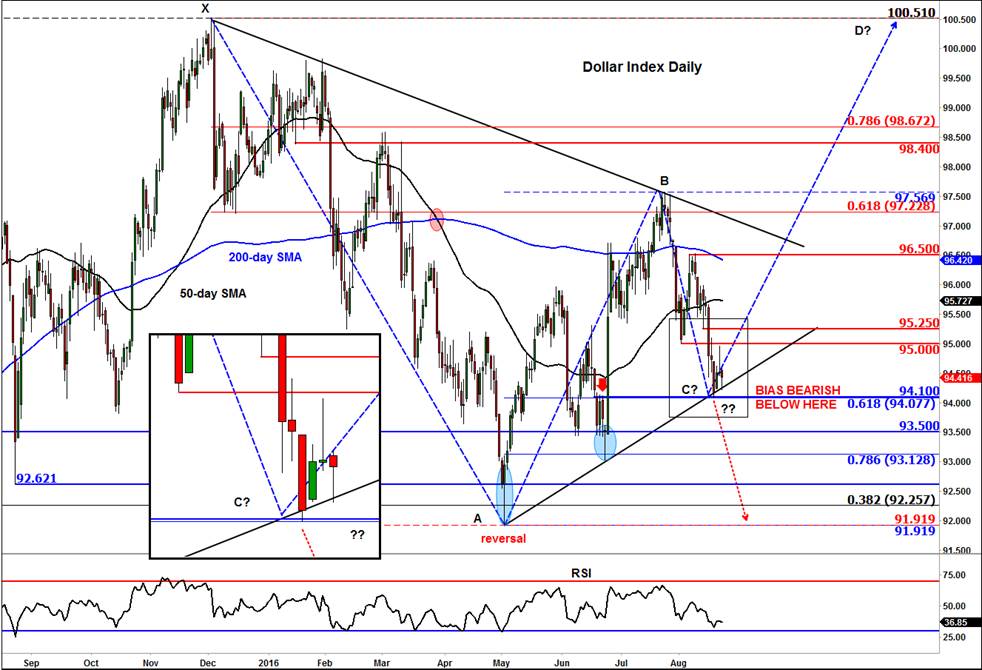
As you can see on the chart, there is a potential AB=CD pattern forming on the DXY currently, with the 61.8% Fibonacci retracement and an old resistance level providing support for point C to be potentially formed at around 94.10. If the rally from point A to B is anything to go by, then the DXY could find itself near 100 once again in the coming months.
Note that the prior rally had stalled around the 61.8% Fibonacci retracement level against the prior high (point X), where there was also a bearish trend line in place. Now, the selling pressure could end as price tests the 61.8% Fibonacci level against the prior low (point A), where there is also a bullish trend line in place. Noticed the price harmony now?
It must be pointed out though that this harmonic price pattern is in the early stages of development which may never come to fruition. Nevertheless, it has provided a small bounce for the dollar for the time being. The buck’s next move can become a little more predictable depending on what the DXY does next.
The bulls will need to chop some wood if the DXY is to get anywhere near 100 again. Resistance could be provided, among other things, by the prior support levels at 95.00, 95.25 and 96.50, or the 50- and 200-day simple moving averages at 95.72 and 96.42, respectively.
However, if the buyers fail to defend their ground at 94.10 then we may see a potential drop towards the lower band of the 1.5-year range at around the 91/92 area next, with some intermediate reference points to watch for signs of support at 93.50 and 93.10.
Please note that my fundamental outlook on the dollar is bullish because the Fed remains the only major hawkish central bank out there while the rest are pretty much all dovish. So my technical analysis tend to have a bullish bias when it comes to the US currency.
Trading leveraged products such as FX, CFDs and Spread Bets carry a high level of risk which means you could lose your capital and is therefore not suitable for all investors. All of this website’s contents and information provided by Fawad Razaqzada elsewhere, such as on telegram and other social channels, including news, opinions, market analyses, trade ideas, trade signals or other information are solely provided as general market commentary and do not constitute a recommendation or investment advice. Please ensure you fully understand the risks involved by reading our disclaimer, terms and policies.
Recommended Content
Editors’ Picks

EUR/USD consolidates weekly gains above 1.1150
EUR/USD moves up and down in a narrow channel slightly above 1.1150 on Friday. In the absence of high-tier macroeconomic data releases, comments from central bank officials and the risk mood could drive the pair's action heading into the weekend.

GBP/USD stabilizes near 1.3300, looks to post strong weekly gains
GBP/USD trades modestly higher on the day near 1.3300, supported by the upbeat UK Retail Sales data for August. The pair remains on track to end the week, which featured Fed and BoE policy decisions, with strong gains.

Gold extends rally to new record-high above $2,610
Gold (XAU/USD) preserves its bullish momentum and trades at a new all-time high above $2,610 on Friday. Heightened expectations that global central banks will follow the Fed in easing policy and slashing rates lift XAU/USD.

Week ahead – SNB to cut again, RBA to stand pat, PCE inflation also on tap
SNB is expected to ease for third time; might cut by 50bps. RBA to hold rates but could turn less hawkish as CPI falls. After inaugural Fed cut, attention turns to PCE inflation.

Bank of Japan set to keep rates on hold after July’s hike shocked markets
The Bank of Japan is expected to keep its short-term interest rate target between 0.15% and 0.25% on Friday, following the conclusion of its two-day monetary policy review. The decision is set to be announced during the early Asian session.

Moneta Markets review 2024: All you need to know
VERIFIED In this review, the FXStreet team provides an independent and thorough analysis based on direct testing and real experiences with Moneta Markets – an excellent broker for novice to intermediate forex traders who want to broaden their knowledge base.