Market Overview
Huge volatility continues to throw markets around with traders still in fear of a China/commodity slowdown in the wake of Monday’s big sell-off. Traders are paying the economic data scant regard (New Homes and Consumer Confidence both beat expectations yesterday) as market fears are still yet to abate. The easing measures from the People’s Bank of China yesterday have not been enough to settle the nerves and after a huge swings in the session, Wall Street closed lower again. Bottom fishing can be an expensive game in times like these and although the Asian markets have been higher overnight, the European markets are under pressure early on. After the Down Jones Industrial Average lost over 500 points in the final hours of trading, European indices need to play catch up. Will the selling continue or can something like Jackson Hole start to generate some stability once more?
The volatility continues in bond markets and forex markets alike as trading is still to settle down. Looking at the performance across the major forex pairs today there is little significant trend, although with the yen and euro weaker and the gold price again lower, the dollar recovery is tending to continue.
Traders have got the US durable goods orders to help distract them today at 1330BST, with the core month on month reading expected to show growth of 0.3%. However, if yesterday is anything to go by, traders are little interested in the data at the moment and it is bigger picture fears that are driving the moves. However, there will be interest in the announcement of the US crude oil inventories at 1530BST which is expected to show an further build in oil stocks of 1.0m. The 2.6m build last week was a surprise and helped to drag the price of WTI lower again so this will be watched.
Chart of the Day – AUD/USD
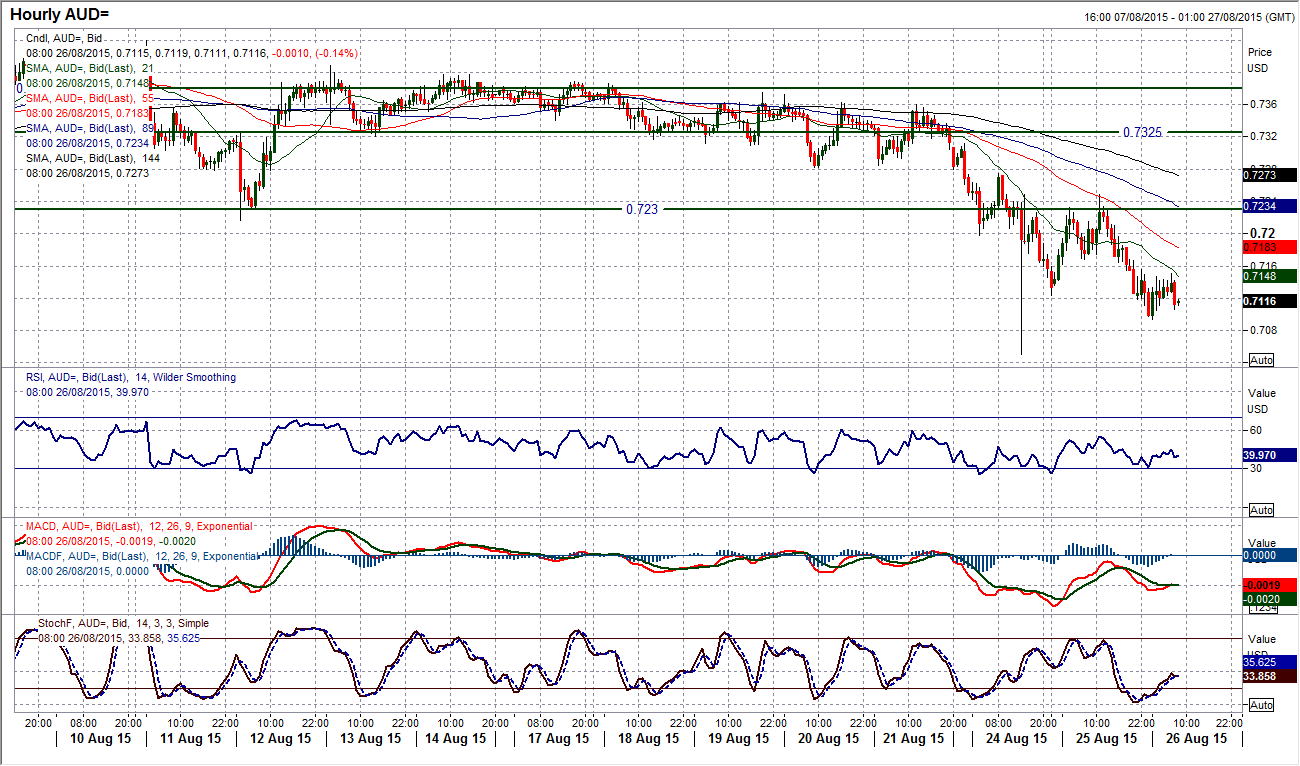
The Aussie was already creaking under the bearish pressure when the selling force came through on Monday to take the pair to a new multi-year low once more. Although it was a long spike tail on Monday which only briefly plumbed the depths to a low at $0.7050, the pressure remains to the downside and a return to test this level cannot be ruled out. The pullback rally seen yesterday failed around the old support band $0.7230/$0.7250 which is now resistance and the sellers have returned once more. I am very interested in the intraday hourly chart momentum indicators which tell a concerning tale for the Aussie. The hourly RSI has consistently failed around the 60 mark before move back below 30, which is a classic bear market. The hourly MACD lines are also consistently pulling back towards neutral before falling away again, once more a bearish sign. So the inference is that use the intraday rallies as a chance to sell. There are lower highs and expect further pressure on the initial $0.7094 and the $07050 supports to be tested as a move towards $0.7000 seems imminent.
EUR/USD
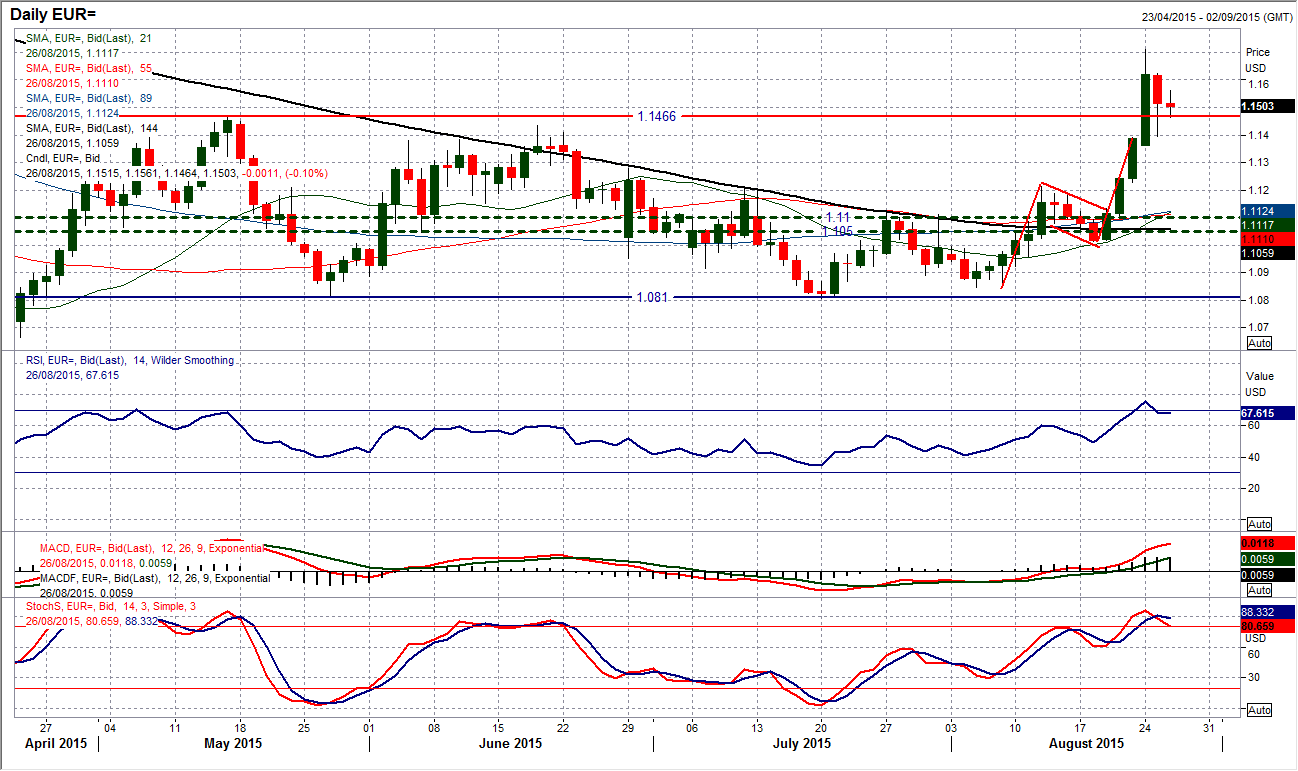
The volatility is still trying to settle after the huge move on Monday. Markets are always going to take a few days to calm down (if that is what they are in the process of doing). The euro has already retraced as much as 300 pips from its high at $1.1711 and engaged in a daily range of around 225 pips yesterday. The unwind has continued into today though and for now it seems that the market is due to settle to the downside. There is a sell signal (crossover) on the RSI however it would be a brave analyst to call definitive direction right now with the volatility still elevated. The move yesterday pulled the euro back into the old trading band as the old resistance at $1.1465 did little to hold up the initial correction. There is little certainty about this chart right now and sometimes you just need to let the dust settle by standing on the sidelines. Initial support comes with the $1.1396 low from yesterday and resistance is initially between $1.1560/$1.1575.
GBP/USD
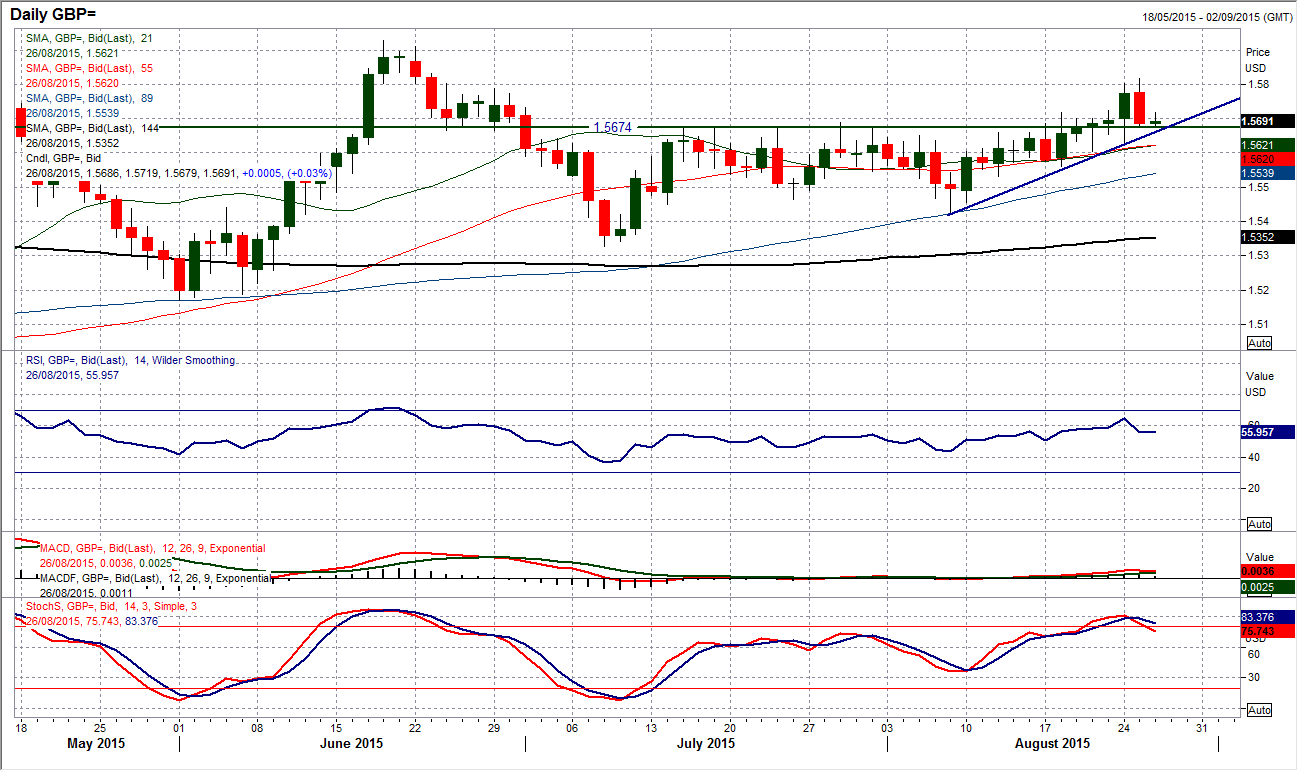
As with many of the forex major pairs there was an element of unwinding yesterday that has pulled Cable back into a band of support. I now see around 50 pips of support between $1.5670/$1.5720. The daily chart has a pivot level around $1.5670 which dates back to the old lows from late June which then acted as the basis of resistance for the range that has just been broken. The correction yesterday has pulled back to that pivot and started to build support early today. I subsequently remain cautiously optimistic about Cable. Technically speaking you would say that this is a pullback into a near 3 week uptrend that has been in place and should be classed as a chance to buy again. Momentum has tailed off a touch but not enough yet to suggest the sellers are gaining the upper hand, so buying into this correction seems viable. The support of Monday’s low around $1.5630 would be the line in the sand to change this outlook. The intraday hourly chart shows the support building around $1.5680 and as long as Monday’s low is intact then a sequence of higher lows remains in place and the creep higher can continue.
USD/JPY
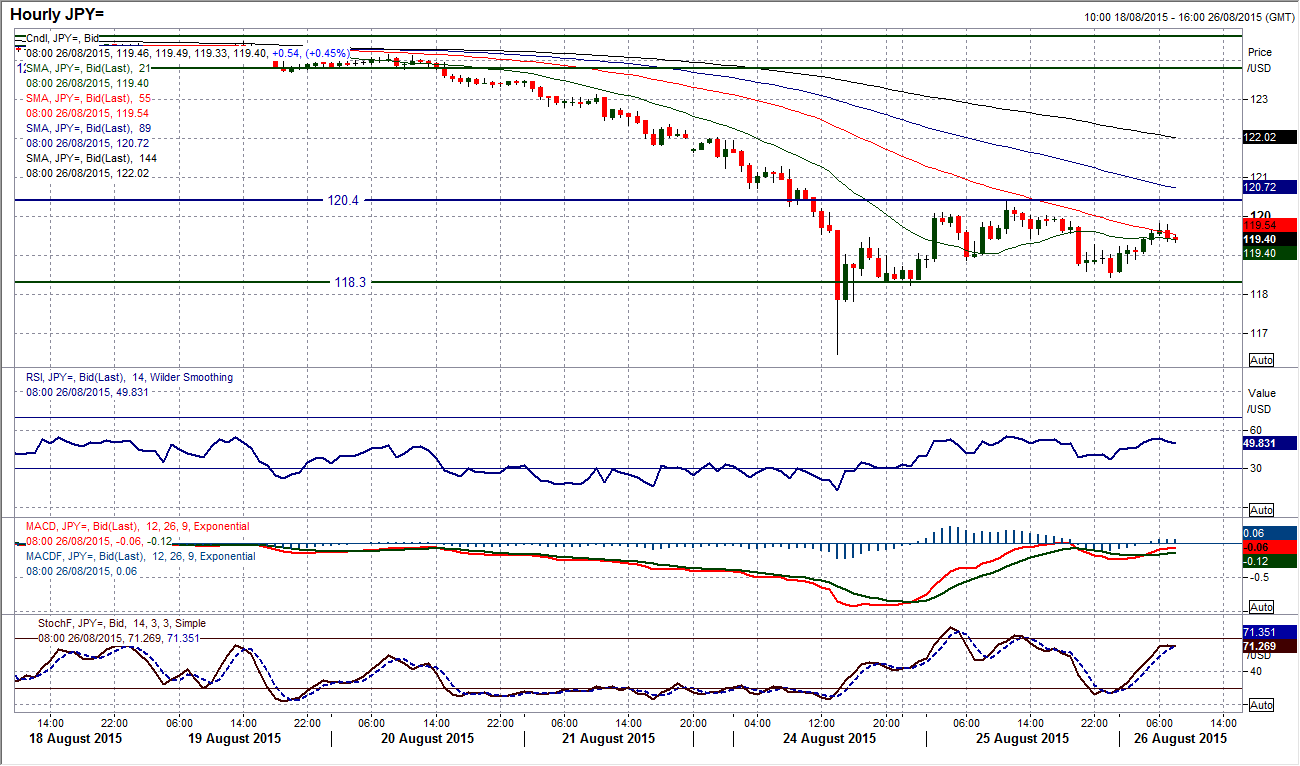
Perhaps more so than many major pairs, Dollar/Yen looked to have gone a long way on Monday and still needs to find a level at which the market is happen to settle down. Another day of fairly wild fluctuations yesterday was over 200 pips of range and already overnight today’s range is around 140 pips as the pair has looked to rally again. The technicals are starting to recover again after Monday’s enormous sell-off. The RSI and Stochastics have turned up and perhaps most interesting is that the support around the old 118.30 floor continues to hold. This is reflected in the intraday hourly chart which is now ranging between 118.30 and a reaction high at 120.40. The fact that the hourly momentum indicators are improving suggests that there could be further pressure on the resistance and a confirmed upside break would complete a small base pattern that would actually imply 122.50. For now though, as with many of the majors the volatility is still there in the chart and is looking to settle.
Gold
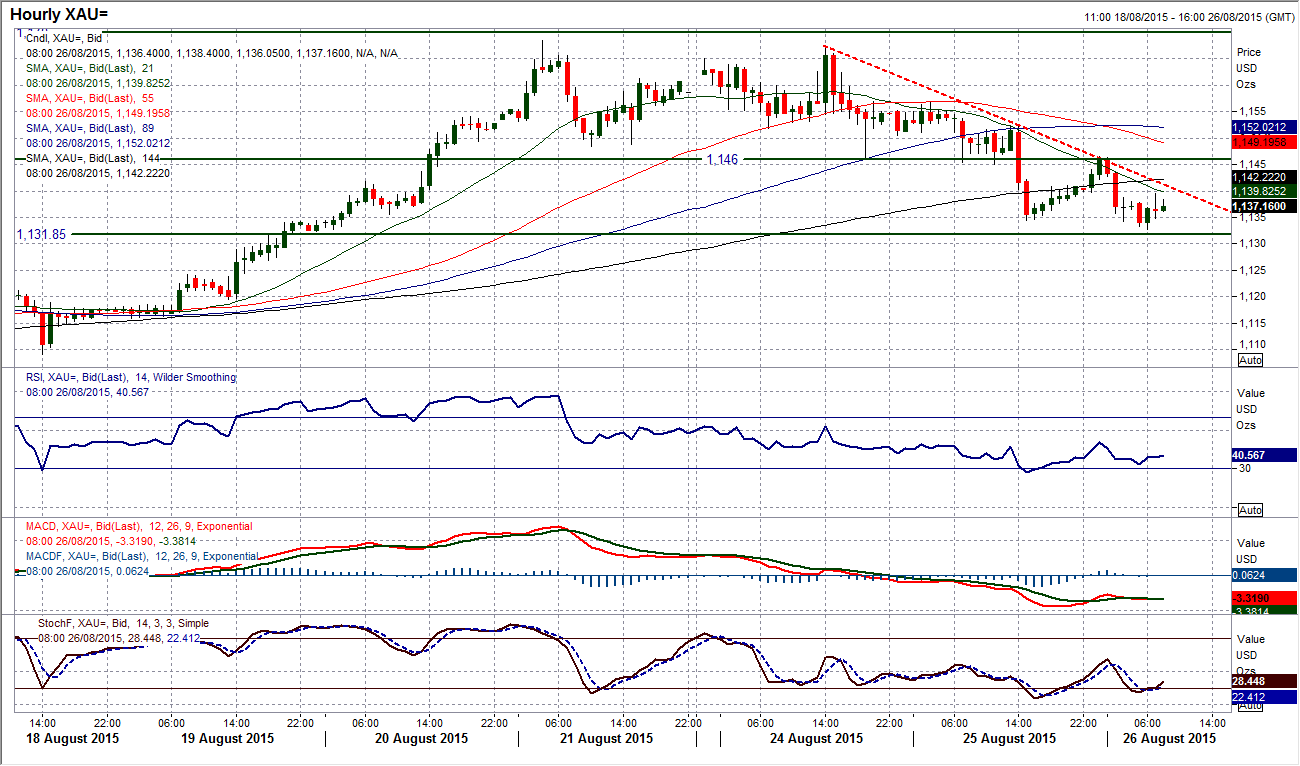
As I had thought, the underwhelming session on Monday was suggesting a lack of willingness for the bulls to continue to pull gold higher. The rally has run out of steam and a correction has set in. The small top pattern of around $20 (as shown on the intraday hourly chart) continues to imply $1128 as a target. However the price has to deal with the initial support in place around the old key floor at $1132 first. The pullback seen over the past three days has now also started to weigh on the momentum indicators. The RSI is in decline already, but it is the Stochastics which need to be watched now as a bear cross is close to being confirmed and this would add to the conviction that gold is under increasing pressure to the downside once more. With further support for this correction back at $1126 there is around $6 worth of support in this zone now and if this were to be breached it could mean sizable further retracement. The hourly chart shows the sequence of lower highs and also the pullback rally which found resistance around $1146. Increasingly it would seem that near term rallies are a chance to sell.
WTI Oil
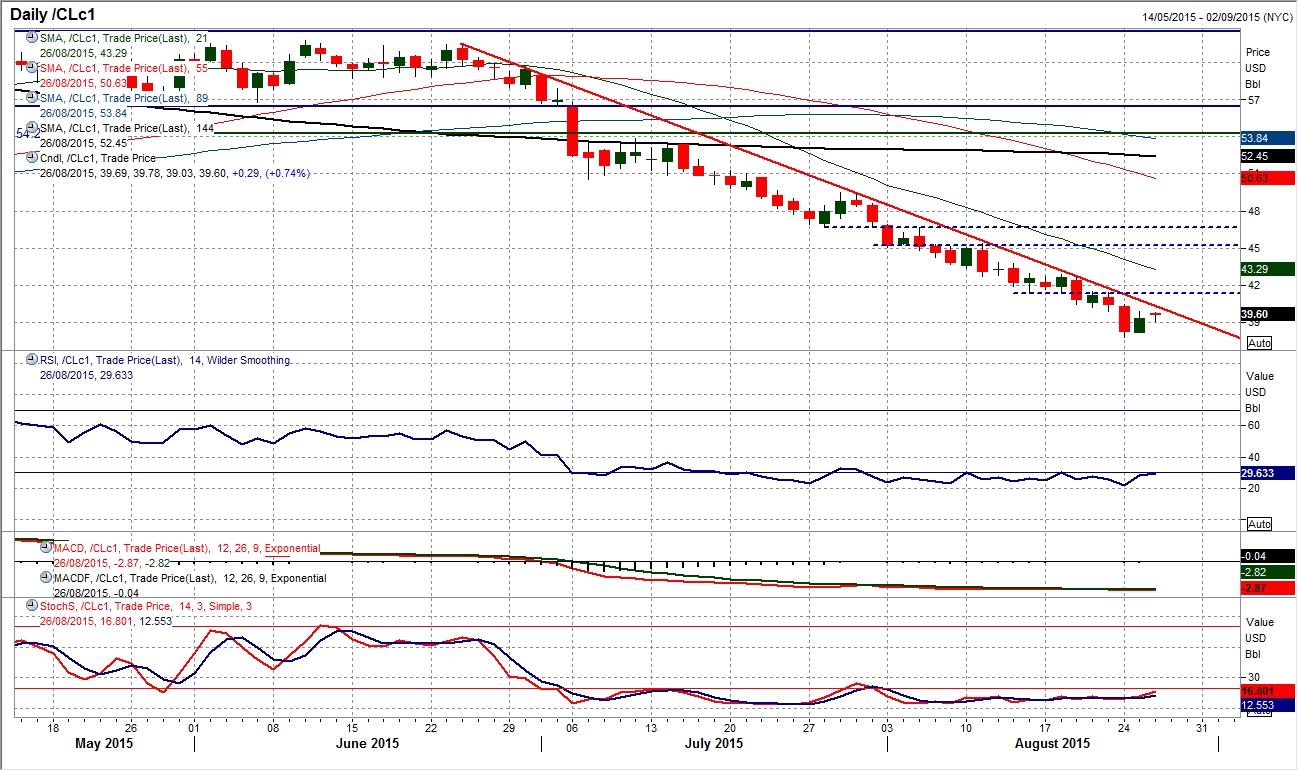
At one stage yesterday, the price of WTI had rallied over 4% from its previous close. This sounds a lot but once again just looking at the strength of the downtrend you will see that nothing has yet really been achieved on a technical basis for the bulls. Could this turn out to be anything more than a “dead cat bounce”? Currently, the downtrend resistance comes in at $40.30 which means that further progress needs to be seen today. Also, for my mind, you would need to see the daily RSI holding a move above at least the 40 level, something it has not done since the downtrend began in mid-June. There would also need to be a break of resistance. Now the bearish construct of the downtrend has meant that rallies are few and far between, so classic lower highs have been rare. However, looking on the intraday hourly chart we find the resistance band between $40.00/$40.50 is still intact. Furthermore, the hourly RSI is consistently failing in the low 60s when there is an intraday rebound, the bulls would need a move above 70 on the hourly RSI to really suggest the bulls are gathering momentum. Until these conditions are met, then unfortunately I have to stick with one of the best downtrends I have seen in a long time. Remember the trend is your friend, until it ends. Monday’s low at $37.75 is the initial support.
Note: All information on this page is subject to change. The use of this website constitutes acceptance of our user agreement. Please read our privacy policy and legal disclaimer. Opinions expressed at FXstreet.com are those of the individual authors and do not necessarily represent the opinion of FXstreet.com or its management. Risk Disclosure: Trading foreign exchange on margin carries a high level of risk, and may not be suitable for all investors. The high degree of leverage can work against you as well as for you. Before deciding to invest in foreign exchange you should carefully consider your investment objectives, level of experience, and risk appetite. The possibility exists that you could sustain a loss of some or all of your initial investment and therefore you should not invest money that you cannot afford to lose. You should be aware of all the risks associated with foreign exchange trading, and seek advice from an independent financial advisor if you have any doubts.
Recommended Content
Editors’ Picks
EUR/USD edges lower toward 1.0700 post-US PCE

EUR/USD stays under modest bearish pressure but manages to hold above 1.0700 in the American session on Friday. The US Dollar (USD) gathers strength against its rivals after the stronger-than-forecast PCE inflation data, not allowing the pair to gain traction.
GBP/USD retreats to 1.2500 on renewed USD strength

GBP/USD lost its traction and turned negative on the day near 1.2500. Following the stronger-than-expected PCE inflation readings from the US, the USD stays resilient and makes it difficult for the pair to gather recovery momentum.
Gold struggles to hold above $2,350 following US inflation

Gold turned south and declined toward $2,340, erasing a large portion of its daily gains, as the USD benefited from PCE inflation data. The benchmark 10-year US yield, however, stays in negative territory and helps XAU/USD limit its losses.
Bitcoin Weekly Forecast: BTC’s next breakout could propel it to $80,000 Premium

Bitcoin’s recent price consolidation could be nearing its end as technical indicators and on-chain metrics suggest a potential upward breakout. However, this move would not be straightforward and could punish impatient investors.
Week ahead – Hawkish risk as Fed and NFP on tap, Eurozone data eyed too

Fed meets on Wednesday as US inflation stays elevated. Will Friday’s jobs report bring relief or more angst for the markets? Eurozone flash GDP and CPI numbers in focus for the Euro.
