In last week’s article, which you can read here, I began discussing using option payoff diagrams, or risk graphs. These are an invaluable tool that must be mastered before we can expect to be successful with options. Fortunately, that’s not hard once you get the hang of it. We’ll go farther down that path today.
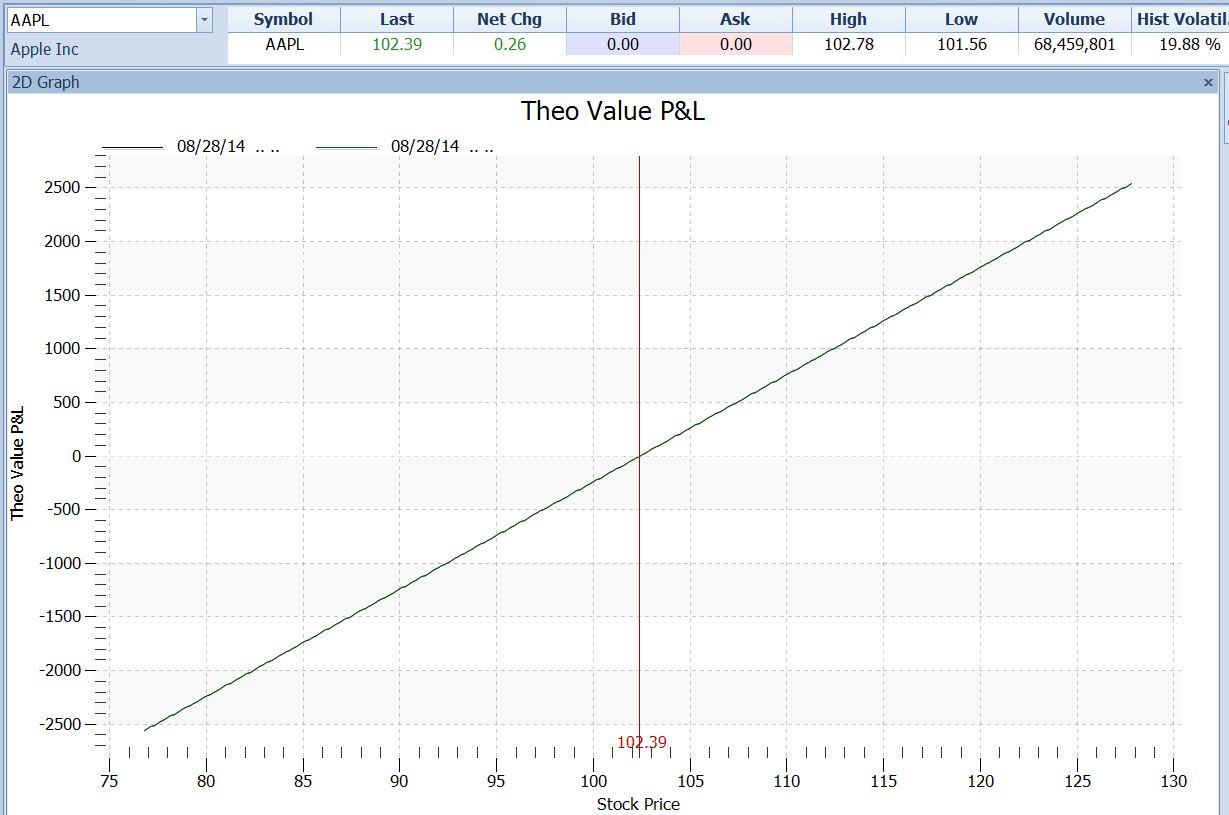
Last week we showed the payoff graph for a regular stock position – a hundred shares of Apple Computer. Updating that to the price as of this writing, this is what that chart looks like:
Option Payoff diagram – AAPL stock
This graph is just a 45-degree line, a slope of one in one (one dollar “rise” in profit per one dollar “run” in the stock price). The red vertical line is at today’s close of $102.39. If we look to the left from the intersection of that line with the P/L plot (the dark green line), we see that that intersection is at a “Theo Value P/L” value of $0.00. This makes sense. If we bought AAPL at the current price of $102.39 then we would have zero profit if it stayed there. We’d have positive P&L if it went up, and we would lose if it went down.
Next, let’s look at the chart of a call option on AAPL, instead of the stock itself. As of today, we could buy a 105 September Call option for $1.41 per share ($141 per 100-share contract). Anyone who owns one of these calls has the right to buy 100 shares of AAPL at $105 per share, at any time before the options expire at 4:00 PM EDT on Friday, September 19. If we bought one of those calls instead of the stock, then our profit picture would look like this:
Option Payoff diagram – Long AAPL Sep 105 Call
Unlike the case with the stock position, this one has a horizontal section. It stretches from a stock price of zero (off the chart to the left) all the way to $105. That horizontal line is at a P&L value of -$141 (on the left scale). This indicates that the maximum loss on that position is the amount paid for the option – $141. If AAPL doesn’t exceed our $105 strike, and we hang on until expiration, that will be the amount of our loss.
Above $105 (prices further right on the chart), the P/L curve ascends. If AAPL is higher than $105 when this option expires, then the option will have some value, and we as owners of the call will not lose our full $141 investment. If AAPL exceeds the $105 strike price by the amount needed to pay back our $141 investment, then we break even. The gold vertical line at that stock price (strike price plus option premium, $105 + $1.41 = $106.41) crosses the green P/L line where that green line’s value is zero.
If we are fortunate enough to see AAPL climb higher than $105, then we begin to make money. And the higher it goes, the more we make, with no limit.
This particular option could potentially pay off many times more than our $141 investment. BUT – AAPL has to move a lot in a short time to make that happen. If it doesn’t get a move on, we stand to lose money. True, that’s only $141 at worst, and that is a lot less than the cost of 100 shares of stock. Still that $141 is 100% of our investment.
Buying this specific option is therefore a very speculative trade. We’re betting on a big move. If it doesn’t happen, we lose.
So who wins? If we did lose our $141, to whom would it go? The answer is that it would go to the seller of the call option. We paid that person $141 when we bought the call. In return, they were obligated to sell us AAPL at $105 whenever we wanted, up until expiration. Since we never exercised that option, their obligation disappears when the option expires, and they pocket the money.
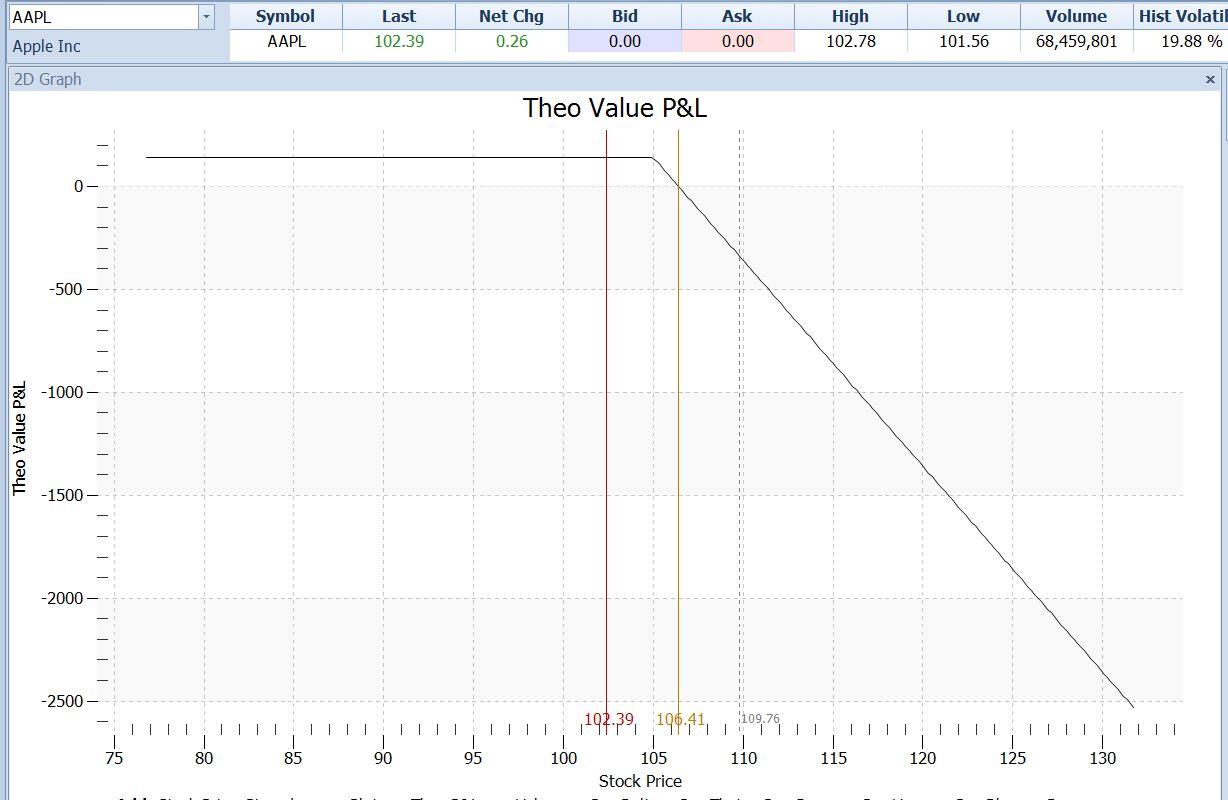
So let’s look at the other side of this trade. Here is the profit picture from the call seller’s point of view:
Option Payoff diagram – Short AAPL Sep 105 Call
Compare this diagram to the previous one. Note that it is the exact mirror image, if the graph is rotated around the horizontal axis. The horizontal line, at a P/L value of +$141, now indicates the option seller’s maximum profit. He took in $141, and he hopes to retain it. If AAPL stays below $105, he will do just that.
On the other hand, the P&L plot extends down to infinity at the right side of the graph. This reflects the fact that the call seller’s loss in unlimited – the literal mirror image of the option buyer’s unlimited potential profit.
The gold vertical line at $106.41 still crosses the P/L plot at a value of $0.00 on the left axis. But here the P/L curve slopes downward. This illustrates the fact that if an option buyer makes any money, the option seller loses that same amount. This is true at any price of the underlying asset at expiration. What one side gains, the other side loses. This is the definition of a zero-sum game. The sum of the wins and losses is zero.
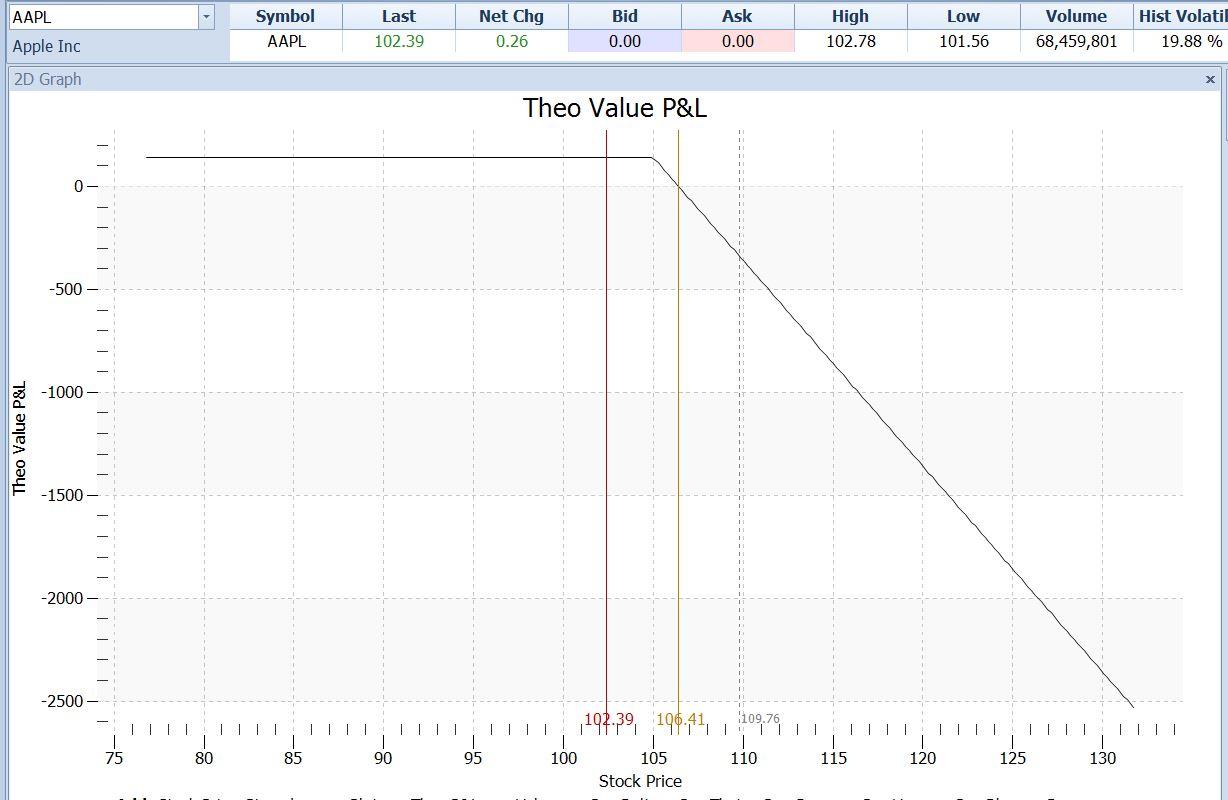
Now let’s take another step. What if the person who sold the call option (as in the above diagram) also bought AAPL’s stock at its current value of $102.39 (the first diagram)? The combination of the long stock and the short call is referred to as a covered call. This combined position would have a diagram of its own, which would look like this:
Option Payoff diagram – Long 100 shares AAPL at $102.39, Short AAPL Sep 105 Cal @ $1.41
AAPL04
The profit or loss on this covered call position, at any stock price, is the combination of the profit or loss on the stock, and the profit or loss on the short call. Notice these points about this combined position:
The break-even price – where the dark green line crosses zero on the left scale – is now at a price that is lower than the current stock price. That break-even point is now at $100.98 (gold line). By selling the call in addition to owning the stock, the investor has reduced his cost by the $141 call premium.
If AAPL now stands still, the stock owner’s profit is positive – in fact he makes $141.
This improvement in his immediate P/L picture has come at a cost. His profit is no longer unlimited. Because he is obligated to sell the AAPL stock at $105, he can never make more than ($105 – $102.39 = $2.61) on the stock; this amount, in addition to the $1.41 that he received for the call, is his maximum profit. This is shown by the horizontal line at a P/L value of ($261 + $141 = $402).
By combining the diagrams of these two separate positions, we can now see what the combined net profit would be at any stock price. This is a tremendous help in visualizing our potential profits and losses. There is still more that these diagrams can tell us, and we’ll review that in future articles.
Knowing how to interpret these diagrams, and manipulate them to take into account our educated forecasts for future prices, is an essential skill. A proper trading education is essential to being profitable in options, or any other kind of trading. That kind of education is available in our on-location or online classes. Contact your local center for details, or go to www.tradingacademy.com.
This content is intended to provide educational information only. This information should not be construed as individual or customized legal, tax, financial or investment services. As each individual's situation is unique, a qualified professional should be consulted before making legal, tax, financial and investment decisions. The educational information provided in this article does not comprise any course or a part of any course that may be used as an educational credit for any certification purpose and will not prepare any User to be accredited for any licenses in any industry and will not prepare any User to get a job. Reproduced by permission from OTAcademy.com click here for Terms of Use: https://www.otacademy.com/about/terms
Editors’ Picks
EUR/USD holds below 1.0750 ahead of key US data

EUR/USD trades in a tight range below 1.0750 in the European session on Friday. The US Dollar struggles to gather strength ahead of key PCE Price Index data, the Fed's preferred gauge of inflation, and helps the pair hold its ground.
GBP/USD consolidates above 1.2500, eyes on US PCE data

GBP/USD fluctuates at around 1.2500 in the European session on Friday following the three-day rebound. The PCE inflation data for March will be watched closely by market participants later in the day.
Gold clings to modest daily gains at around $2,350

Gold stays in positive territory at around $2,350 after closing in positive territory on Thursday. The benchmark 10-year US Treasury bond yield edges lower ahead of US PCE Price Index data, allowing XAU/USD to stretch higher.
Bitcoin Weekly Forecast: BTC’s next breakout could propel it to $80,000 Premium

Bitcoin’s recent price consolidation could be nearing its end as technical indicators and on-chain metrics suggest a potential upward breakout. However, this move would not be straightforward and could punish impatient investors.
US core PCE inflation set to signal firm price pressures as markets delay Federal Reserve rate cut bets

The core PCE Price Index, which excludes volatile food and energy prices, is seen as the more influential measure of inflation in terms of Fed positioning. The index is forecast to rise 0.3% on a monthly basis in March, matching February’s increase.
RECOMMENDED LESSONS
Making money in forex is easy if you know how the bankers trade!
Discover how to make money in forex is easy if you know how the bankers trade!
5 Forex News Events You Need To Know
In the fast moving world of currency markets, it is extremely important for new traders to know the list of important forex news...
Top 10 Chart Patterns Every Trader Should Know
Chart patterns are one of the most effective trading tools for a trader. They are pure price-action, and form on the basis of underlying buying and...
7 Ways to Avoid Forex Scams
The forex industry is recently seeing more and more scams. Here are 7 ways to avoid losing your money in such scams: Forex scams are becoming frequent. Michael Greenberg reports on luxurious expenses, including a submarine bought from the money taken from forex traders. Here’s another report of a forex fraud. So, how can we avoid falling in such forex scams?
What Are the 10 Fatal Mistakes Traders Make
Trading is exciting. Trading is hard. Trading is extremely hard. Some say that it takes more than 10,000 hours to master. Others believe that trading is the way to quick riches. They might be both wrong. What is important to know that no matter how experienced you are, mistakes will be part of the trading process.


