In last week’s article (link here), I started an example of an Iron Condor using the stock of Yahoo (YHOO). Today we’ll continue with that example.
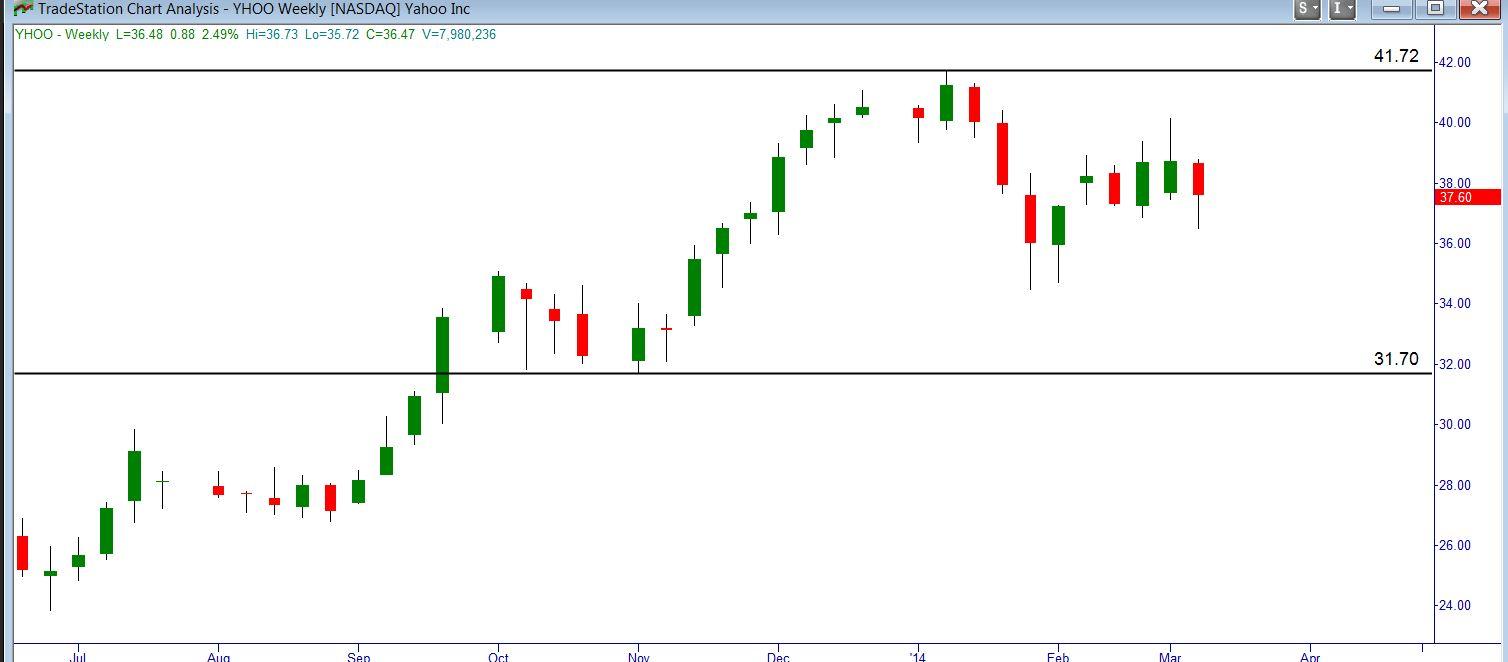
Below is the price chart as it stood for Yahoo at the time we put the trade on:
Here’s how I read the situation at that time:
The stock of Yahoo (YHOO) stood at $37.73, roughly midway between major support at around $32 and major resistance at the recent highs around $42. Implied volatility at 35% was on the high side compared to readings over the last year.
We could have bet that YHOO would stay in the $32-42 range for the next month, based on the supply (resistance) and demand (support) levels shown on the chart. Bolstering our opinion was the fact that, based on the 35% volatility reading at the time, our probability calculator showed a 79% chance of YHOO staying within that 32-42 range.
We could have put on an iron condor using the 30 and 32 April puts, and the 42 and 44 April calls, for a net credit of $.35 per share. This $.35 would be ours to keep if YHOO stayed within the 32-42 range. Since each of the two spreads that made up the condor (30-32 puts and 42-44 calls) was $2.00 wide, the most we could possibly have to pay to extract ourselves from this spread was $2.00 per share. Subtracting our original credit of $.35 from this $2.00 maximum exit cost gave $1.65 as our maximum loss.
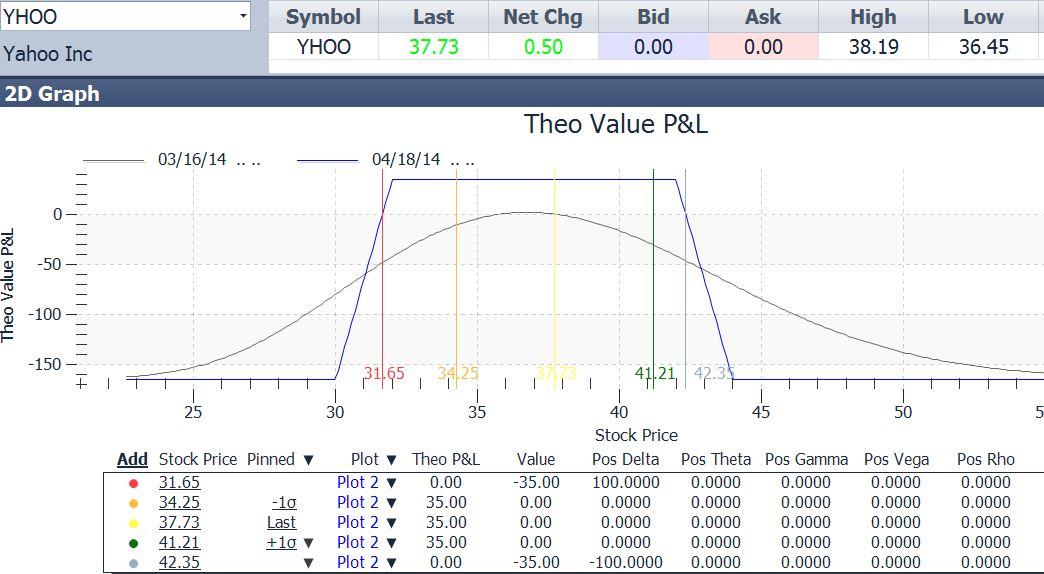
Here is the option payoff diagram for that position as it stood on March 14:
The yellow vertical line was the March 14 stock price ($37.73). The gold and dark green lines were placed at one standard deviation away from the current price, at $34.25 and $41.21. The red and blue lines were at the trade’s break-even prices of $31.65 and $42.35. With our break-even prices farther away than 1 standard deviation, it was statistically unlikely that YHOO would reach those levels in the time remaining.
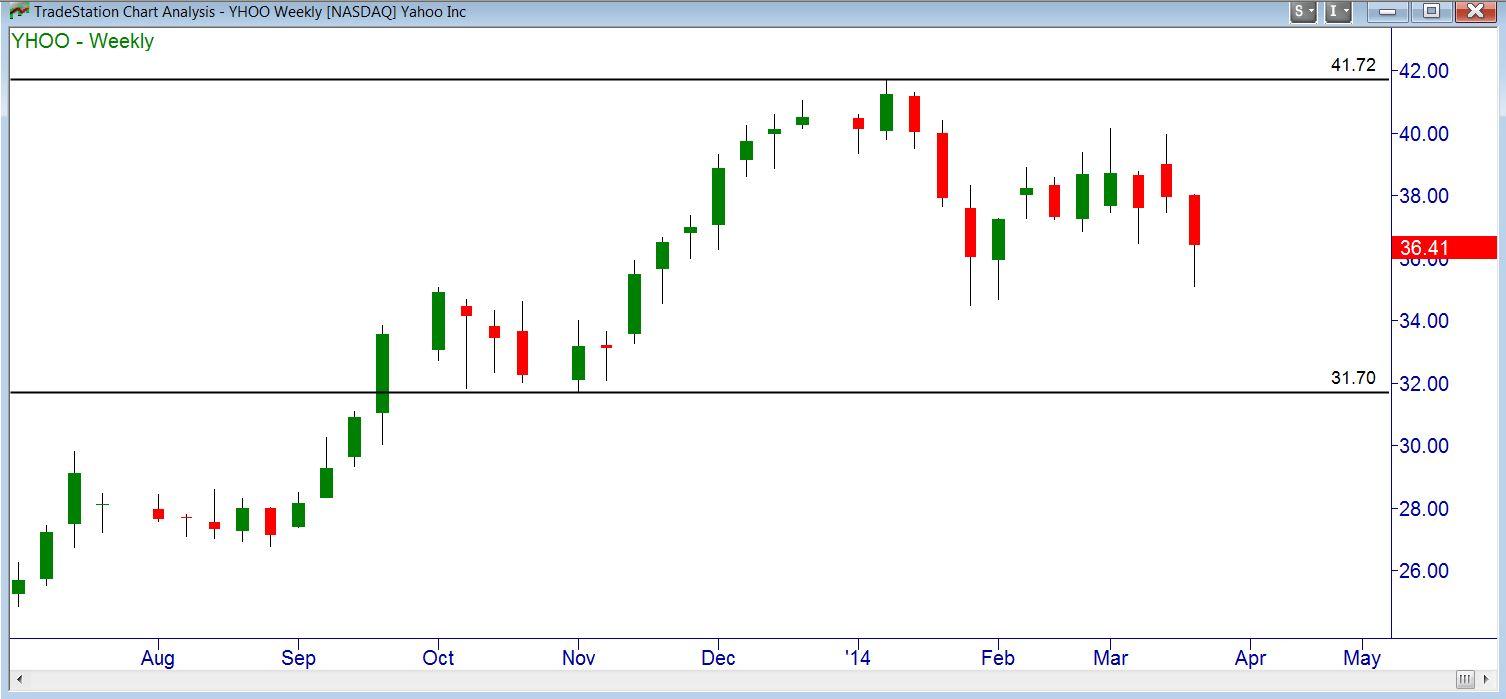
Two weeks later, YHOO’s chart looked like this:
The stock had moved around a bit, but well within our profitability range. It was almost exactly midway between our 32 and 42 short strikes. The value of the condor had dropped from our original value of $.35 down to $.13, meaning we had already accrued $.22 worth of profit (i.e. we could have unwound the iron condor, buying back all the short options and selling all the long ones, for $.13, which was $,22 less than the $.35 net credit we originally received).
There was no need to take any action at this time, as the value of our position was deflating nicely, and right on schedule. Assuming that YHOO didn’t move out of the 32-42 range, all we would have to do was wait for all the options to expire.
But what if YHOO did show signs of moving beyond our profitable range? Is there anything we could do to improve the situation, if needed?
Yes, there was. But before I describe that, I want to answer a question that I received from a reader about this trade:
“…with a $.35 net credit and maximum loss of $2.00
does this mean I could lose $2.00 X 100 = $200,
but only make at most 100 X $.35 = $35?
I normally try for a profit 2 to 3 times greater than my risk, so this is confusing.
First of all, it is true that the maximum cost to exit this trade is $200. That is not the maximum loss however – we have to subtract our $.35 credit, making the maximum loss $165.
A good rule of thumb is in fact to try for a reward-to-risk ratio of 2 or 3 to 1. Here we appear to have a reward-to-risk ratio of 35/165, or about 1 to 5. There are a couple of reasons that this trade is not as upside down as it might seem at first glance.
First of all, this position (and any position) should have stops placed so that we don’t incur the maximum loss. We have no intention of sitting by while YHOO moves out beyond either of our maximum loss points (30 or 44). Our stops would take us out of the trade if YHOO dropped below our $31.70 demand level, or rallied above our $41.72 supply level. For that reason, we would use our stop prices in figuring out the risk for our risk/reward calculation.
At those stop prices, should they have occurred right after we put the trade on, our loss would have been about $70. And the longer it took to reach those stop levels, the smaller our loss would be, as the entire position accrued profit day by day due to time decay. As of March 28, our losses at those levels would have been about $45.
Still, even using our stop prices to estimate our loss, we stood to make less than we stood to lose. How can that make sense?
The answer is probability. The chance of YHOO moving far enough to stop us from making a profit was low. Our probability calculator (standard equipment in Tradestation and other platforms) had showed an estimated 79% chance that YHOO would remain within our maximum profit range of $32 – $42, and an 82% chance that it would stay in the break-even range of $31.65 to $42.35, all until the April expiration.
We could make an extremely rough estimate at expectancy based on these numbers. Expectancy is the average amount of profit we would expect to make on this trade, if it was repeated many times. In this case, we could calculate this as follows:
79% chance of maximum profit of $35: .79 X 35 = $27.65
18% chance of being stopped out for a $70 loss: .18 X -70 = -$5.60
3% chance of an intermediate result.
This could be anywhere between +35 and -70: .03 X (+35-70)/2 = - $ .52
Net expectancy $21.38
Note that this is an oversimplification of the real expectancy calculation, which requires using some calculus to integrate the full range of expected values. But it should be close enough to illustrate the point: if the chances of success are very high, then the reward-to-risk ration can be lower.
Finally, how could we protect ourselves, if YHOO strayed out of its profitability range, other than just shutting down the trade at our stops?
We could roll the spread on the losing side. For example, if YHOO hit $32, we could fall back to the next demand level around $28. This means we would buy back the 30-32 put spread portion of the iron condor, and replace it with a 26-28 put spread. At that point, the new spread would bring in a significant portion of the amount we would have to pay to buy back the old one; and possibly all of it if enough time had passed. Meanwhile, the short options on the winning side (the call spread) may have dropped in value to just a few cents, so that we could buy back the short calls too (no point in selling the long calls, since they would probably be worthless, being now so far out of the money).
In this example, we looked at a good strategy for range-bound situations with high implied volatility; and explained why with certain positions, what looks like a poor reward/risk ratio really isn’t. We also discussed means of salvaging an iron condor position when it goes against us.
I hope this has stimulated you to look further into this useful and interesting strategy.
This content is intended to provide educational information only. This information should not be construed as individual or customized legal, tax, financial or investment services. As each individual's situation is unique, a qualified professional should be consulted before making legal, tax, financial and investment decisions. The educational information provided in this article does not comprise any course or a part of any course that may be used as an educational credit for any certification purpose and will not prepare any User to be accredited for any licenses in any industry and will not prepare any User to get a job. Reproduced by permission from OTAcademy.com click here for Terms of Use: https://www.otacademy.com/about/terms
Editors’ Picks
EUR/USD trades with negative bias, holds above 1.0700 as traders await US PCE Price Index

EUR/USD edges lower during the Asian session on Friday and moves away from a two-week high, around the 1.0740 area touched the previous day. Spot prices trade around the 1.0725-1.0720 region and remain at the mercy of the US Dollar price dynamics ahead of the crucial US data.
USD/JPY jumps above 156.00 on BoJ's steady policy

USD/JPY has come under intense buying pressure, surging past 156.00 after the Bank of Japan kept the key rate unchanged but tweaked its policy statement. The BoJ maintained its fiscal year 2024 and 2025 core inflation forecasts, disappointing the Japanese Yen buyers.
Gold price flatlines as traders look to US PCE Price Index for some meaningful impetus

Gold price lacks any firm intraday direction and is influenced by a combination of diverging forces. The weaker US GDP print and a rise in US inflation benefit the metal amid subdued USD demand. Hawkish Fed expectations cap the upside as traders await the release of the US PCE Price Index.
Sei Price Prediction: SEI is in the zone of interest after a 10% leap

Sei price has been in recovery mode for almost ten days now, following a fall of almost 65% beginning in mid-March. While the SEI bulls continue to show strength, the uptrend could prove premature as massive bearish sentiment hovers above the altcoin’s price.
US economy: Slower growth with stronger inflation

The US Dollar strengthened, and stocks fell after statistical data from the US. The focus was on the preliminary estimate of GDP for the first quarter. Annualised quarterly growth came in at just 1.6%, down from the 2.5% and 3.4% previously forecast.
RECOMMENDED LESSONS
Making money in forex is easy if you know how the bankers trade!
Discover how to make money in forex is easy if you know how the bankers trade!
5 Forex News Events You Need To Know
In the fast moving world of currency markets, it is extremely important for new traders to know the list of important forex news...
Top 10 Chart Patterns Every Trader Should Know
Chart patterns are one of the most effective trading tools for a trader. They are pure price-action, and form on the basis of underlying buying and...
7 Ways to Avoid Forex Scams
The forex industry is recently seeing more and more scams. Here are 7 ways to avoid losing your money in such scams: Forex scams are becoming frequent. Michael Greenberg reports on luxurious expenses, including a submarine bought from the money taken from forex traders. Here’s another report of a forex fraud. So, how can we avoid falling in such forex scams?
What Are the 10 Fatal Mistakes Traders Make
Trading is exciting. Trading is hard. Trading is extremely hard. Some say that it takes more than 10,000 hours to master. Others believe that trading is the way to quick riches. They might be both wrong. What is important to know that no matter how experienced you are, mistakes will be part of the trading process.


