In my last two articles (Calendars part 1 and part 2), I described strategies that work well when you expect the price of a stock with cheap options (low implied volatility) to stay in a range. The Calendar strategy that I described there benefits from a lack of price movement, exploiting the difference between the rates of time decay of short-term options (fast) vs longer-term ones (slow). Although not required, an increase in implied volatility (IV) after putting on the trade will increase its profitability.
The Calendar strategy requires that the stock price remain in a range in order to make a profit. If it moves too far either way, there will be a loss.
In Part 2 of that series, I described how one might respond when price moved far enough to threaten the profitability of the original calendar. The solution I presented (one of several possible responses) was to add a second calendar spread at a different strike price, evolving the position into a Double Calendar. If the price had dropped near the lower break-even price, then the new calendar would be at a lower strike than the original one; if the stock price had moved up, a higher one. This would have the effect of moving the stock prices at which the trade would make its maximum profit, and at which it would break even, in the desired direction.
By adding the second calendar, we could once again increase the probability of profit to a high percentage, turning what had become a probable losing trade back into a probable winner. In exchange for this improvement in the probability of profit, we would have to give up two things. First, more capital would be required to add the second calendar spread, since it would be a debit spread. The second follows from the first – since the maximum loss on the double calendar is its total cost, our maximum loss was now a larger number.
Now, let’s consider a situation that is different in one important way. The difference is that, although we still expect the stock price to remain in a range for a while, the implied volatility at the beginning of the trade is high, not low. By this I mean that the current level of implied volatility is high in relation to the levels of implied volatility for this stock over the past year. High IV would make this stock not a candidate for a calendar spread, either single or double. If IV drops from its current high level, the calendar’s profitability will suffer. This is because when we exit the calendar at the expiration of the short-term option, we have to sell the longer-term option to collect our profit. The more we get for it, the more money we make, and vice versa. The lower the IV at that future date, the less we’ll make on the calendar.
If calendars are not a good bet for a range-bound stock with high IV, then what is? One answer is the Iron Condor. In this spread, we sell a put option with a strike price lower than the lowest price we believe will happen by a nearby expiration date; and simultaneously buy a put option with an even lower strike, for protection. We also sell a call option at a higher strike price than we believe the stock can achieve by expiration, and buy a call at an even higher strike than that, for protection.
If the stock then behaves as we expect, and stays above the strike price of our short put but below that of our short call, then both of these short options will expire worthless. Our long protective options also expire worthless, being even further out of the money than the short options. The net result is that our profit is equal to the net credit we originally received when we put on the whole trade.
This is a better choice than the calendar or double calendar in times of high IV. With calendars, we are long a large amount of time value, which will increase in value if implied volatility increases. With iron condors, we are short a large amount of time value. The high IV reading at the time we enter the iron condor means that we collected a large amount of credit. “High IV” is a synonym for “expensive options.” We want to buy IV when it’s low (as in the calendar), but sell it when it’s high (as in the Iron Condor).
Here’s an example. In the week that ended March 14, 2014, U.S. equity indexes pulled back fairly sharply from all-time highs, on geopolitical worries (the Russia/Ukraine situation). Implied volatility on the index ETFs spiked to levels near 52-week highs.
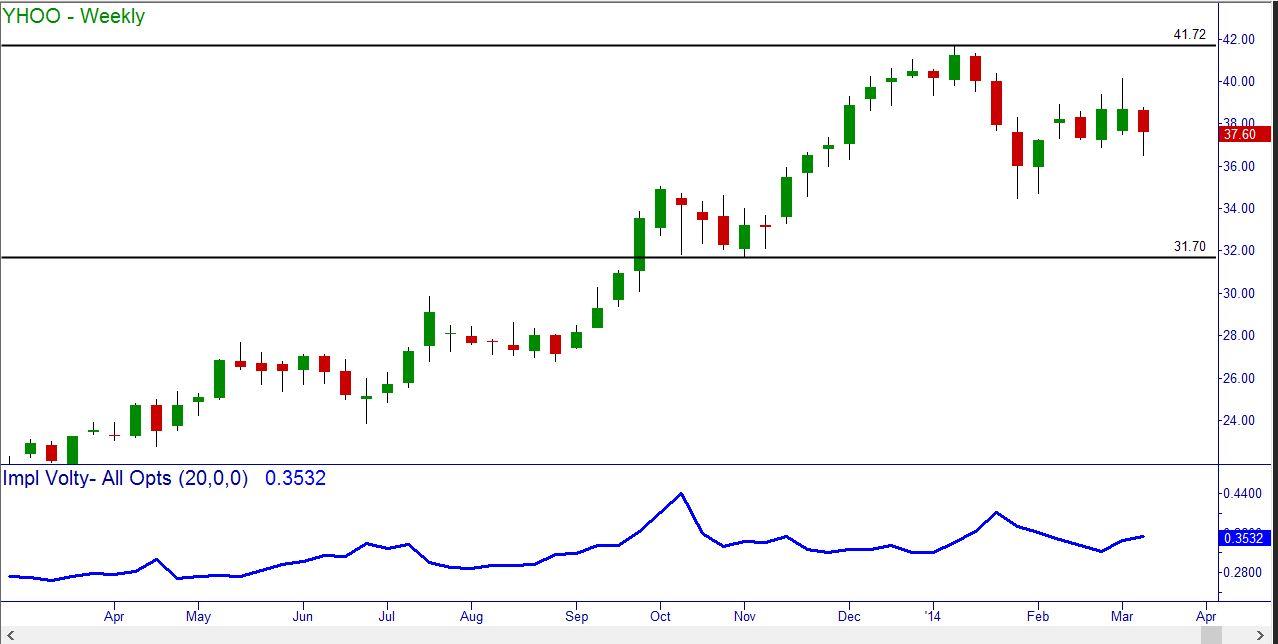
The stock of Yahoo (YHOO) stood at $37.73, roughly midway between major support at around $32 and major resistance at the recent highs around $42. Implied volatility at 35% was on the high side compared to readings over the last year. Here is the chart:
At that time, we could have bet that YHOO would stay in the $32-42 range for the next month, based on the supply (resistance) and demand (support) levels shown on the chart. Bolstering our opinion was the fact that, based on the 35% volatility reading at the time, our probability calculator showed a 79% chance of YHOO staying within that 32-42 range.
We could have sold the YHOO April 32 puts at $.21 and bought the April 30 puts as protection at $.09; and also sold the April 42 calls at $.49 while buying the April 44 calls at $.26. The net credit to our account per contract would have been $21-9+49-26 = $35. This amount would be our maximum profit, which we would get to keep as long as YHOO was between $32 and $42 when the April options expired on April 18. If it did not, then our profit would be decreased by $1 for every penny that the stock had moved beyond that range. Our break-even prices were therefore at $32 – $.35 = $31.65 on the downside; and $42 + $.35 = $42.35 on the upside. The probability calculator showed an 82% likelihood that YHOO would be within that range in 33 days.
If YHOO moved beyond one of those break-even levels then we would have a loss. Our protective options limited the size of that loss. Since the difference in strike prices in each case was $2.00 (32-30 and 44-42), the most we would have to pay to get out of the spread was $2.00 per share, no matter how far YHOO moved. Subtracting our original $.35 net credit, our maximum loss was $1.65 per share, or $165 per contract. This is the amount of our own money that our broker would require us to put up as margin. Our return on cash was thus $35/165 or 21% in 33 days.
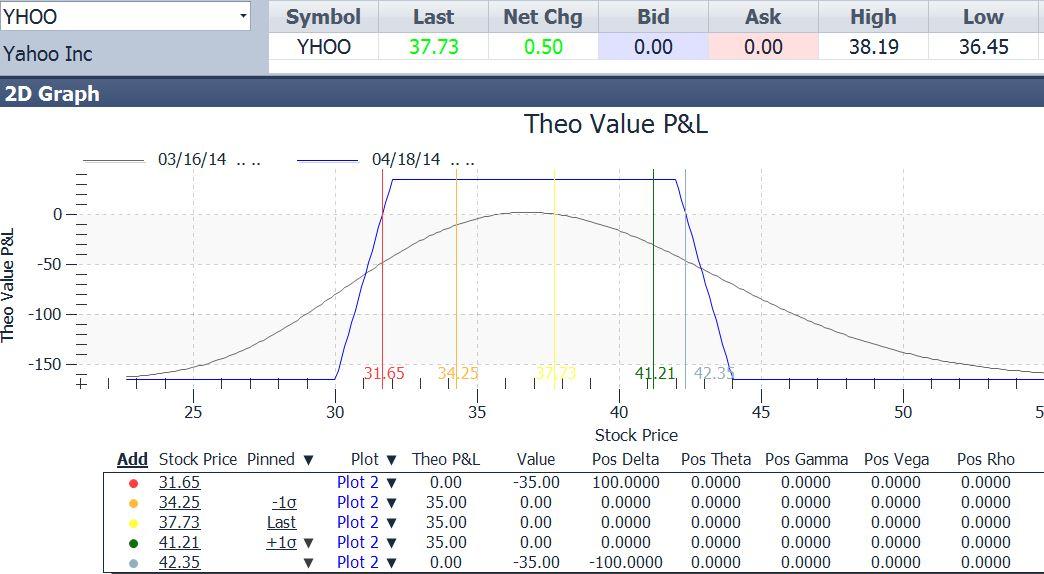
Below is the profit and loss diagram for the trade:
In the above diagram, the yellow vertical line was the current stock price ($37.73). The gold and dark green lines were placed at 1 standard deviation away from the current price at $34.25 and $41.21. The red and blue lines were at the trade’s break-even prices of $31.65 and $42.35. We can see that our break-even prices were comfortably beyond the probable range between the 1-standard-deviation boundaries.
This trade had a high statistical probability of making a profit, and a good return on invested capital; more important, its chart indicated that profit was likely. If all went well, and YHOO stayed in the $32-42 range for 33 days, then we would make our 21% profit with no further action required.
Next week we’ll look at how this position could be managed in the event that YHOO did not behave itself.
This content is intended to provide educational information only. This information should not be construed as individual or customized legal, tax, financial or investment services. As each individual's situation is unique, a qualified professional should be consulted before making legal, tax, financial and investment decisions. The educational information provided in this article does not comprise any course or a part of any course that may be used as an educational credit for any certification purpose and will not prepare any User to be accredited for any licenses in any industry and will not prepare any User to get a job. Reproduced by permission from OTAcademy.com click here for Terms of Use: https://www.otacademy.com/about/terms
Editors’ Picks
EUR/USD holds below 1.0750 ahead of key US data

EUR/USD trades in a tight range below 1.0750 in the European session on Friday. The US Dollar struggles to gather strength ahead of key PCE Price Index data, the Fed's preferred gauge of inflation, and helps the pair hold its ground.
USD/JPY stays firm above 156.00 after BoJ Governor Ueda's comments

USD/JPY stays firm above 156.00 after surging above this level on the Bank of Japan's decision to leave the policy settings unchanged. BoJ Governor said weak Yen was not impacting prices but added that they will watch FX developments closely.
Gold price oscillates in a range as the focus remains glued to the US PCE Price Index

Gold price struggles to attract any meaningful buyers amid the emergence of fresh USD buying. Bets that the Fed will keep rates higher for longer amid sticky inflation help revive the USD demand.
Bitcoin Weekly Forecast: BTC’s next breakout could propel it to $80,000 Premium

Bitcoin’s recent price consolidation could be nearing its end as technical indicators and on-chain metrics suggest a potential upward breakout. However, this move would not be straightforward and could punish impatient investors.
US core PCE inflation set to signal firm price pressures as markets delay Federal Reserve rate cut bets

The core PCE Price Index, which excludes volatile food and energy prices, is seen as the more influential measure of inflation in terms of Fed positioning. The index is forecast to rise 0.3% on a monthly basis in March, matching February’s increase.
RECOMMENDED LESSONS
Making money in forex is easy if you know how the bankers trade!
Discover how to make money in forex is easy if you know how the bankers trade!
5 Forex News Events You Need To Know
In the fast moving world of currency markets, it is extremely important for new traders to know the list of important forex news...
Top 10 Chart Patterns Every Trader Should Know
Chart patterns are one of the most effective trading tools for a trader. They are pure price-action, and form on the basis of underlying buying and...
7 Ways to Avoid Forex Scams
The forex industry is recently seeing more and more scams. Here are 7 ways to avoid losing your money in such scams: Forex scams are becoming frequent. Michael Greenberg reports on luxurious expenses, including a submarine bought from the money taken from forex traders. Here’s another report of a forex fraud. So, how can we avoid falling in such forex scams?
What Are the 10 Fatal Mistakes Traders Make
Trading is exciting. Trading is hard. Trading is extremely hard. Some say that it takes more than 10,000 hours to master. Others believe that trading is the way to quick riches. They might be both wrong. What is important to know that no matter how experienced you are, mistakes will be part of the trading process.


