Well, maybe we don’t have to take it to this extreme. But if there is one thing I wish the Futures industry would do is that they would standardize the charts we use to make our trading decisions. So much confusion comes from having so many types of charts available to Futures traders:
Un-Adjusted Continuous Charts
Adjusted Continuous Charts
Contract Specific Charts
Contract Specific Continuous Charts
Regular Trading Hours (RTH) Charts
All Session Charts
And the list goes on into the intra-day charts that are available to Futures traders.
The Equity and Spot Forex markets have some of the best looking and straight forward charts in the investing community. In all fairness to the Futures industry these other asset sectors do not have contract expirations to deal with. Until the brains of the Futures industry come up with this type of chart I guess we will have to work with what charts we have.
I received an email recently from a student asking about which chart to use around rollover time. While there have been previous articles written on this topic I thought another article about the Financial Futures markets charts would be helpful to clear up any confusion.
Most new Futures traders gravitate to the Financial Futures contracts when they first start trading Futures. These contracts include the Stock Indexes, Interest Rates and the Currency Futures. Once the new trader understands these instruments then they gradually start to trade the physical Commodity Futures contracts.
Some of the benefits of trading Financial Futures first are:
1. Almost 24 hours of trading during the week
2. Contract expiration months are all during the same period (March, June, September & December)
3. The same economic reports that impact Stock prices typically impact the Financial Futures markets as well
4. Liquidity during the night session is better and reduces the amount of slippage when your protective stops are triggered
The next thing to figure out is which chart to use while trading these vehicles?
My answer has been and always will be, it doesn’t matter as long as you use the same type of chart for “all” of your analysis. The last thing you want to do is use different charts for your analysis. I have seen many times when Futures contracts rollover traders want to switch their chart types temporarily around this time. I personally think this is a big mistake.
From a personal preference I always use un-adjusted continuous charts for all of my Financial Futures contracts. There is never a time when I use a contract specific chart (example USM14, ESM14 etc.) when trading Financial Futures. Of course this is just my personal preference and each trader needs to define their own style.
Some of the reasons I have chosen this style are due to the length of the contract life. All Futures contracts have a First Trading Day (FTD) and a Last Trading Day (LTD). The difference between these two dates is the life of the contract.
Physical Commodity Futures have much longer life of contract times. For example Crude Oil trades for about 6 years before expiring, Corn trades for 3 years before expiring. During this time there is a lot of Commercial trading activity in each contract even before it becomes a near month with the highest volume traded contract.
Financial Futures on the other hand only trade for 1 or 2 years before expiring. The mini S&P trades 2 years, Euro Currency trades 2 years and the 30 Year Treasury (US) market only trades for 1 year. As if the short life of contract is not bad enough the majority of the volume traded in these contracts is done in the near month (approximately 95% of entire volume for all contracts).
With little volume being traded in the forward months the charts do not have full bodied candles and a tremendous number of gaps each day. The volume finally comes to the contract during the last 3 months of the life of contract. This makes using a contract specific chart very difficult to create our supply/demand levels.
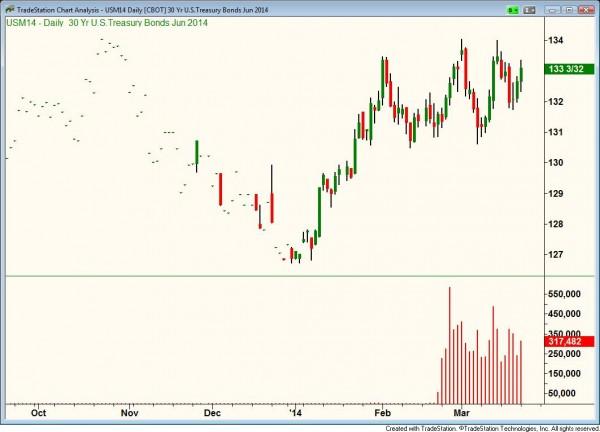
Figure 1, 30-Year Treasury market, illustrates the poor chart quality until the last 3 months of the contract life. Notice how the volume expands during the last 3 months of the contract life. This type of chart is referred to as a contract specific chart.
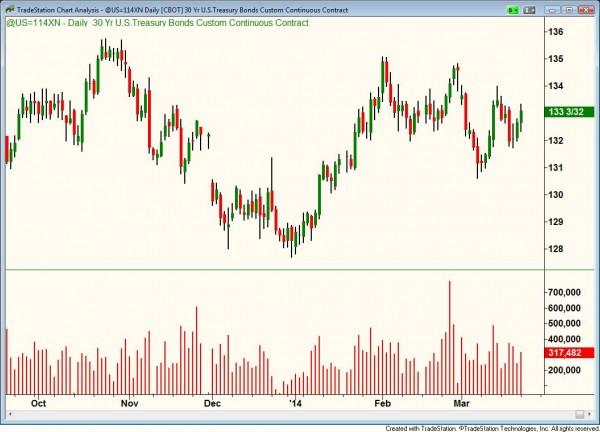
Fig 2 is a chart of the same 30-Year Treasury market using an un-adjusted continuous contract setting. Notice how the volume is consistent across the chart. This is because the software only plots the near month with the most volume when plotting un-adjusted continuous charts.
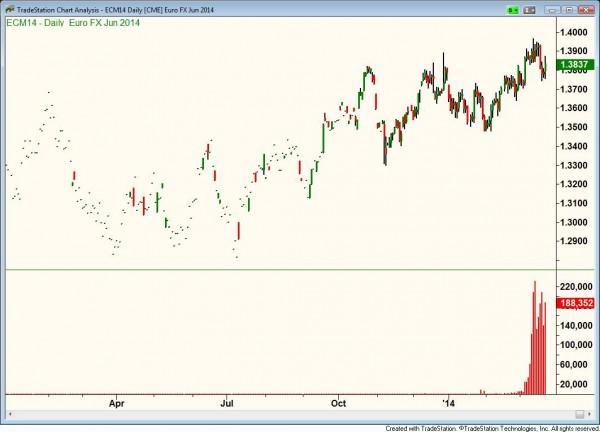
Figure 3 is a contract specific chart of the Euro Currency. This chart also displays the low volume of the contract until the last 3 months of the life of the contract, making this chart difficult to create supply/demand levels as well.
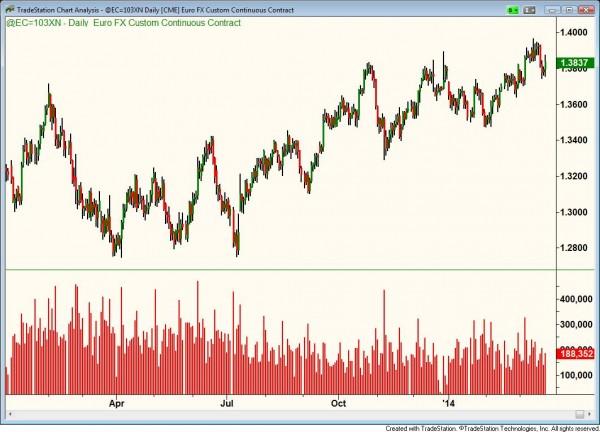
Figure 4 is an un-adjusted continuous chart of the Euro Currency contract. Again notice how the volume is consistent across the chart.
Around contract expiration traders that normally use un-adjusted continuous charts for some reason want to switch to contract specific charts. There are a host of problems this could cause.
The longer term trend can be in two different directions depending on the chart you select
If the market is at life of contract highs or lows you will have no supply/demand levels to your left
Using contract specific charts soon after a rollover and looking left will give you different supply/demand levels than the un-adjusted continuous chart on the same dates
All of these lead to inconsistent analysis of the market you are trading in. Most traders do not trade markets that are in the process of rolling over from one contract to the next. They will usually skip about 2 days and come back to this market later when everybody is looking at the same charts. There are so many cross currents in the price action around contract rollovers that most traders are better off to sit on the sidelines or trade another market that is not rolling over.
“Don’t go through life, grow through life” Eric Butterworth
This content is intended to provide educational information only. This information should not be construed as individual or customized legal, tax, financial or investment services. As each individual's situation is unique, a qualified professional should be consulted before making legal, tax, financial and investment decisions. The educational information provided in this article does not comprise any course or a part of any course that may be used as an educational credit for any certification purpose and will not prepare any User to be accredited for any licenses in any industry and will not prepare any User to get a job. Reproduced by permission from OTAcademy.com click here for Terms of Use: https://www.otacademy.com/about/terms
Editors’ Picks

EUR/USD: US Dollar comeback in the makes? Premium
The US Dollar (USD) stands victorious at the end of another week, with the EUR/USD pair trading near a four-week low of 1.1742, while the USD retains its strength despite some discouraging American data released at the end of the week.

Gold: Escalating geopolitical tensions help limit losses Premium
Gold (XAU/USD) struggled to make a decisive move in either direction this week as it quickly recovered above $5,000 after posting losses on Monday and Tuesday.

GBP/USD: Pound Sterling braces for more pain, as 200-day SMA tested Premium
The Pound Sterling (GBP) crashed to its lowest level in a month against the US Dollar (USD), as critical support levels were breached in a data-packed week.

Bitcoin: No recovery in sight
Bitcoin (BTC) price continues to trade within a range-bound zone, hovering around $67,000 at the time of writing on Friday, and falling slightly so far this week, with no signs of recovery.

US Dollar: Tariffed. Now What? Premium
The US Dollar (USD) reversed its previous week’s decline, managing to stage a meaningful rebound and retesting the area just above the 98.00 barrier when tracked by the US Dollar Index (DXY).
RECOMMENDED LESSONS
Making money in forex is easy if you know how the bankers trade!
I’m often mystified in my educational forex articles why so many traders struggle to make consistent money out of forex trading. The answer has more to do with what they don’t know than what they do know. After working in investment banks for 20 years many of which were as a Chief trader its second knowledge how to extract cash out of the market.
5 Forex News Events You Need To Know
In the fast moving world of currency markets where huge moves can seemingly come from nowhere, it is extremely important for new traders to learn about the various economic indicators and forex news events and releases that shape the markets. Indeed, quickly getting a handle on which data to look out for, what it means, and how to trade it can see new traders quickly become far more profitable and sets up the road to long term success.
Top 10 Chart Patterns Every Trader Should Know
Chart patterns are one of the most effective trading tools for a trader. They are pure price-action, and form on the basis of underlying buying and selling pressure. Chart patterns have a proven track-record, and traders use them to identify continuation or reversal signals, to open positions and identify price targets.
7 Ways to Avoid Forex Scams
The forex industry is recently seeing more and more scams. Here are 7 ways to avoid losing your money in such scams: Forex scams are becoming frequent. Michael Greenberg reports on luxurious expenses, including a submarine bought from the money taken from forex traders. Here’s another report of a forex fraud. So, how can we avoid falling in such forex scams?
What Are the 10 Fatal Mistakes Traders Make
Trading is exciting. Trading is hard. Trading is extremely hard. Some say that it takes more than 10,000 hours to master. Others believe that trading is the way to quick riches. They might be both wrong. What is important to know that no matter how experienced you are, mistakes will be part of the trading process.
The challenge: Timing the market and trader psychology
Successful trading often comes down to timing – entering and exiting trades at the right moments. Yet timing the market is notoriously difficult, largely because human psychology can derail even the best plans. Two powerful emotions in particular – fear and greed – tend to drive trading decisions off course.


