Bull markets rise over extended periods because hope builds slowly and cautiously. Bear markets are short because fear can work its way through the marketplace in a relative instant.
Often, traders maintain their bearish positions too long because they aspire to a certain price target that doesn’t get hit because the time frame of the move has run its course. As a result, these traders must cover and give back hard-earned profits. What most traders don’t grasp is that bear markets don’t end at specific price points; they terminate when fear reaches certain levels.
The volatility index, or VIX, is an important indicator of market fear. It is a useful forecaster of near- to intermediate-term moves in equity indexes. It’s a tool that enables the trader to estimate how much momentum may remain for a current leg. There are two paradigms at work with respect to the VIX: The mathematical interpretation for the sophisticated options player and the psychological factor that really drives markets.
Technically speaking, the VIX is a measure of implied volatility for S&P 500 Index options. It estimates expected stock market volatility over the next 30 days. It is calculated by the Chicago Board Options Exchange and is derived from a public domain, yet complex, formula that is expressed on a percentage basis.
Reading the VIX
In simple terms, the VIX reading refers to the annualized value of the expected move over the next 30 days. For example, a VIX of 17% projects the market will move 17%/(square root of 12) = 4.9% over the next month. Likewise, a VIX of 40% projects the market to move 40%/(square root of 12) = 11.5%. This is a linear interpretation. Keep in mind that markets tend to move in decidedly non-linear fashion, especially when you least expect it.In practice, however, the specific forecast of the VIX is not important. Instead, the current reading with respect to both long- and short-term relative values is key. Simply, a low VIX translates into less movement over the next 30 days, while a high VIX means a larger percentage move. But keep in mind, the reading is direction neutral.
That said, there is a psychological factor at play. For traders, analysts and the financial media, high volatility connotes a market drop, while low volatility implies a rising market. In addition, many believe a low VIX reading means more of the same, while a high VIX reading means the market is poised to shift.
But this conventional wisdom isn’t necessarily correct. For instance, in 2002 when the S&P 500 bottomed at 768, the VIX high was approximately 42% that week, but fell to 36% the day the market turned. Technically speaking, traders could have anticipated an approximate 10%-12% move over the next 30 days. Further, traders following mainstream assumptions may have assumed the market would be lower over the next month. However, the low to high over the next 30 calendar days was 768 to 894, a difference of 16.4%.
The opposite move higher is not such a stretch; when markets truly do bottom, everyone thinks prices are going down forever. However, the right approach is to buy when there is blood in the streets, expecting prices to rise as a result of all buying pressure having been extinguished. A similar misconception also is rampant on the upside. Traders who enter in a late-stage bull market are not psychologically ready for the turn; the most important number to them is not the VIX, but rather how much skin they have in the game.
Consider the true cost of improperly analyzing the VIX. With respect to the 2002 move, instead of a 12% drop, we saw a 16.4% rise; this is really a 28% mistake. Approaching the VIX correctly is critical to market survival.
History repeats
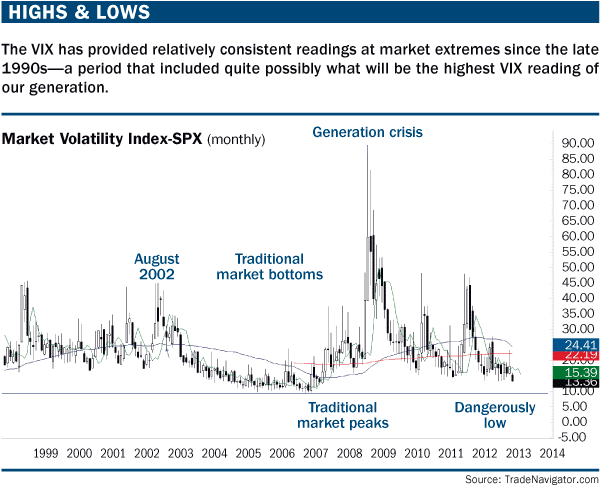
Most traders get hurt when the trend changes because they ignore signs that the tide has turned. Methodologies such as market-timing windows and the Gann price/time square are key here. Using the VIX also can provide perspective, but remember, when the VIX is low, it does not mean the market will keep rising. Conversely, a high VIX does not always translate to lower market prices.Looking at a long-term S&P 500 chart, certain themes emerge (see “Highs & lows,” below). Over this period, traditional intermediate-term corrections and bear markets tend to terminate near 45%, while bull markets terminate in a range from about 9%-15%. During the 2008 financial crisis, the VIX spiked to 89.53%, which was a generational extreme. Since that time, many bears have expected each crisis to replicate 2008.
But consider the pure statistical message of the VIX over the last 20 years: That high was hit once out of 20 times, a 5% probability, which isn’t good. Is it smart to expect a market to crash? History says no, yet traders look for this result constantly. That’s an important lesson from the VIX that often gets overlooked. Remember, as we just noted, when the VIX gets low, the market tends to top; when the VIX is high, the market tends to bottom. And swing traders, beware — the 30-day anticipation calculation may not work if you are trading close to a high or low.
A better approach to using the VIX is to realize that it should fall in value as the market rises, while a falling market should coincide with a rising VIX. A rising market means the fear level tends to drop, and a sinking market should be accompanied by an indicator that shows fear is rising. If that doesn’t happen, there’s a problem. If the market sinks, but the VIX doesn’t rise, it’s an indication of complacency. In “Sentiment: Putting trading into context” (October 2012), we learned how complacency is a characteristic of an early stage correction or bear market.
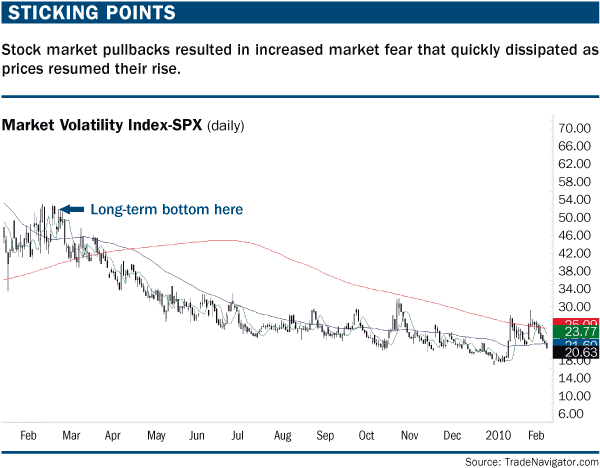
If a rising market is accompanied by a VIX that doesn’t drop, that means the market is rising on a consistent fear basis, which also means it could be rising on a wall of worry, a key characteristic of a bull market. Those looking for a trade with a duration of longer than a few days to a couple of weeks should consider holding the position longer if the VIX doesn’t drop (by much). The takeaway here is that fear, or lack thereof, is the fuel that drives both bull and bear markets. The VIX chart from 2009 shows a slow move downward with several sharp spikes that indicated fear rose quickly on the pullbacks (see “Sticking points,” below).

Like all generalities, there are exceptions. The VIX bottomed at 9.39% in December 2006, yet the market didn’t start peaking until the July-to-October period the following year. Then again, it’s rare to see the VIX register such a low reading. Bernard Baruch (the Warren Buffet of the first half of the 20th century) said he didn’t mind missing the first and last 10% of a move so long as he could participate in the middle 80%. By the time the VIX got so low, a market top was going to happen. It wasn’t a matter of if, but when.
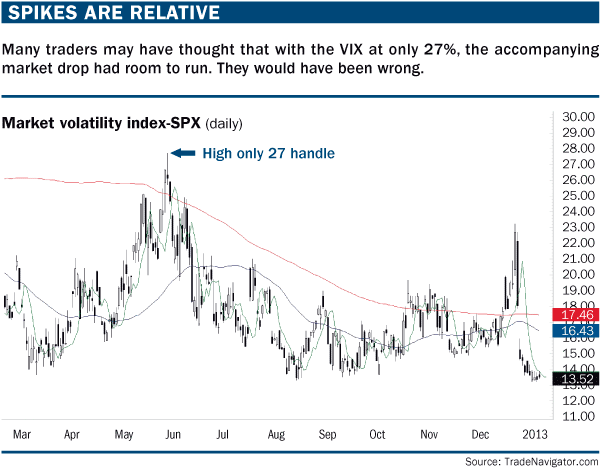
Recent bottoms also are instructive. When the market bottomed in 2011 amid a debt-ceiling debate, the VIX hit 48.20%, and then 37.38% when it was retested again in October. Thus, the suggestion that a VIX over 45% indicated an intermediate- to long-term low gave the market a lot of fuel to move higher. On the other hand, when the market bottomed in June 2012, the VIX reached a high of 27% (see “Spikes are relative,” below).

Do not anticipate the same kind of market move with a rally originating from a VIX of 27%, or lower, as you would when the market bottoms at a VIX of 36% or 48%. The October 2011 low in the S&P 500 with a high VIX reading produced a 32% move to the April 2012 high.The June 2012 low with a much lower VIX reading only produced roughly a 16% move by the September high. By the time the market found the next low in November 2012, the VIX only was in a range from roughly 15.93% to 18.64%. This indicates that while long-term traders seem to enjoy low volatility, history suggests they would be better off taking a longer-term position with the VIX near 30% or above.
Inconsistencies
It has been more than year since the VIX maintained a lower reading. The trouble started during the Santa Claus rally of 2011. From Dec. 5 through Dec. 19, 2011, the VIX dropped while the S&P 500 peaked around 1267 then fell to 1202. All calculations aside, that’s when fear left the market, which was OK because the VIX was in the high 20s. Since the latter part of 2012, though, the market has not been able to make good progress.Last year was dominated by the lower VIX reading. Indeed, there was one key sequence when it was repeatedly reported the VIX was no longer relevant because pundits were expecting a market turn on the low readings. Consequently, the market peaked and corrected approximately a week later. We should have learned from the Internet bear and real estate bubble that sooner or later prices revert to the mean, and when sentiment seems to suggest a new normal, that’s precisely the time risk is getting high and a turn is imminent. As we’ve seen, the VIX follows a 20-plus year trend. Is it realistic to think the market is going to adopt a new normal?
On a day-to-day basis, it’s important to keep track of how much fear comes into the market based on the current sequence. With respect to the VIX, a quick look will allow you to to gauge your fellow traders and determine the potential of a move. However, one of the most important lessons is one of the hardest to follow with respect to human nature. A trader positioned late in the move should use an extreme VIX reading as a warning sign that an important turn could be imminent.
Editors’ Picks

EUR/USD: US Dollar comeback in the makes? Premium
The US Dollar (USD) stands victorious at the end of another week, with the EUR/USD pair trading near a four-week low of 1.1742, while the USD retains its strength despite some discouraging American data released at the end of the week.

Gold: Escalating geopolitical tensions help limit losses Premium
Gold (XAU/USD) struggled to make a decisive move in either direction this week as it quickly recovered above $5,000 after posting losses on Monday and Tuesday.

GBP/USD: Pound Sterling braces for more pain, as 200-day SMA tested Premium
The Pound Sterling (GBP) crashed to its lowest level in a month against the US Dollar (USD), as critical support levels were breached in a data-packed week.

Bitcoin: No recovery in sight
Bitcoin (BTC) price continues to trade within a range-bound zone, hovering around $67,000 at the time of writing on Friday, and falling slightly so far this week, with no signs of recovery.

US Dollar: Tariffed. Now What? Premium
The US Dollar (USD) reversed its previous week’s decline, managing to stage a meaningful rebound and retesting the area just above the 98.00 barrier when tracked by the US Dollar Index (DXY).
RECOMMENDED LESSONS
Making money in forex is easy if you know how the bankers trade!
I’m often mystified in my educational forex articles why so many traders struggle to make consistent money out of forex trading. The answer has more to do with what they don’t know than what they do know. After working in investment banks for 20 years many of which were as a Chief trader its second knowledge how to extract cash out of the market.
5 Forex News Events You Need To Know
In the fast moving world of currency markets where huge moves can seemingly come from nowhere, it is extremely important for new traders to learn about the various economic indicators and forex news events and releases that shape the markets. Indeed, quickly getting a handle on which data to look out for, what it means, and how to trade it can see new traders quickly become far more profitable and sets up the road to long term success.
Top 10 Chart Patterns Every Trader Should Know
Chart patterns are one of the most effective trading tools for a trader. They are pure price-action, and form on the basis of underlying buying and selling pressure. Chart patterns have a proven track-record, and traders use them to identify continuation or reversal signals, to open positions and identify price targets.
7 Ways to Avoid Forex Scams
The forex industry is recently seeing more and more scams. Here are 7 ways to avoid losing your money in such scams: Forex scams are becoming frequent. Michael Greenberg reports on luxurious expenses, including a submarine bought from the money taken from forex traders. Here’s another report of a forex fraud. So, how can we avoid falling in such forex scams?
What Are the 10 Fatal Mistakes Traders Make
Trading is exciting. Trading is hard. Trading is extremely hard. Some say that it takes more than 10,000 hours to master. Others believe that trading is the way to quick riches. They might be both wrong. What is important to know that no matter how experienced you are, mistakes will be part of the trading process.
The challenge: Timing the market and trader psychology
Successful trading often comes down to timing – entering and exiting trades at the right moments. Yet timing the market is notoriously difficult, largely because human psychology can derail even the best plans. Two powerful emotions in particular – fear and greed – tend to drive trading decisions off course.


