Jack Steiman, on Hesitation Ahead of the Fed (SwingTradeOnline.com)
The market has had a nice run-up ahead of the Fed meeting that begins Tuesday and has the economy on the agenda on Wednesday. With QE3 ending next month, market bulls want to be able to count on a QE4 to support the economy should things fall apart globally or in our own back yard. If Ms. Yellen gives any hint that she won't keep rates low for basically years to come, the market will likely get taken apart. The only reason we hold up is because of Fed action and/or perceived action if need be.
Given that she understands this fully and recognizes the market damage to come if she doesn't say all the right things, I expect her to be very market friendly when her words are heard around the globe on Wednesday. Now, even if she does this, it doesn't mean things are going to be good for the bulls. If the market has a different agenda, then nothing can save it. That's just the reality of this game. Even good news could spawn a sell-off on a given day, so be on watch. As bulls and bears have been giving each other solid blows, with neither falling down, watch for a knockout around the corner for one side. No one knows who quite yet.
The short-term, 60-minute charts coming into Monday were overbought. All of the key index charts were flashing 70 or a bit higher, as the day began. The natural occurrence would be for the market to pull back without a lot of price erosion, while unwinding those key oscillators just before the news from the Fed on Wednesday. It's not impossible to break out from overbought short-term conditions, but, it is, of course, easier to do when the oscillators are set up from unwinding.
The market has had lots of beta, or movement if you will, each and every day. Large swings. I'm not a fan of these types of environments. With the markets overbought, but not ready to fall too hard, it was no shock that we swung around back and forth, although in the red, all day on Monday. A quiet day in the red is really what we saw -- nothing bad and nothing good for either side at this moment in time.
If we study more of the longer-term index charts such as those weekly and monthly charts, they're not very pretty, and, to be honest, it makes you wonder how the market has been holding up for as long as it has. Those charts are nothing short of nasty-looking. Any move back up to old highs would create massive negative divergences. No way around that reality. No chance they won't form.
That said, you can break out and stay with those nasty divergences for a while. Likely not forever, but you can get some time out of them. They don't, however, make you feel warm and secure about buying too much on the long side of the ledger.
When you're buying heavily into powerful, negative, long-term divergences, it should scare you. Scare you enough anyway to at least keep things light. This said, you can play a bit long if something sets up, but you need to keep things very light with very tight stops. No more than 2% for me on any losing trades.
For now, the market isn't screaming long or short, but chances are, they will shortly after the Fed on Wednesday.
Jack Steiman is author of Swing Trade Online, a journal of his market analysis and stock trading alerts.
Avi Gilburt, on Ball Loose on the Field (ElliottWaveTrader.net)
Right now, I see the market as having the football loose on the field and we are watching to see who is going to recover.
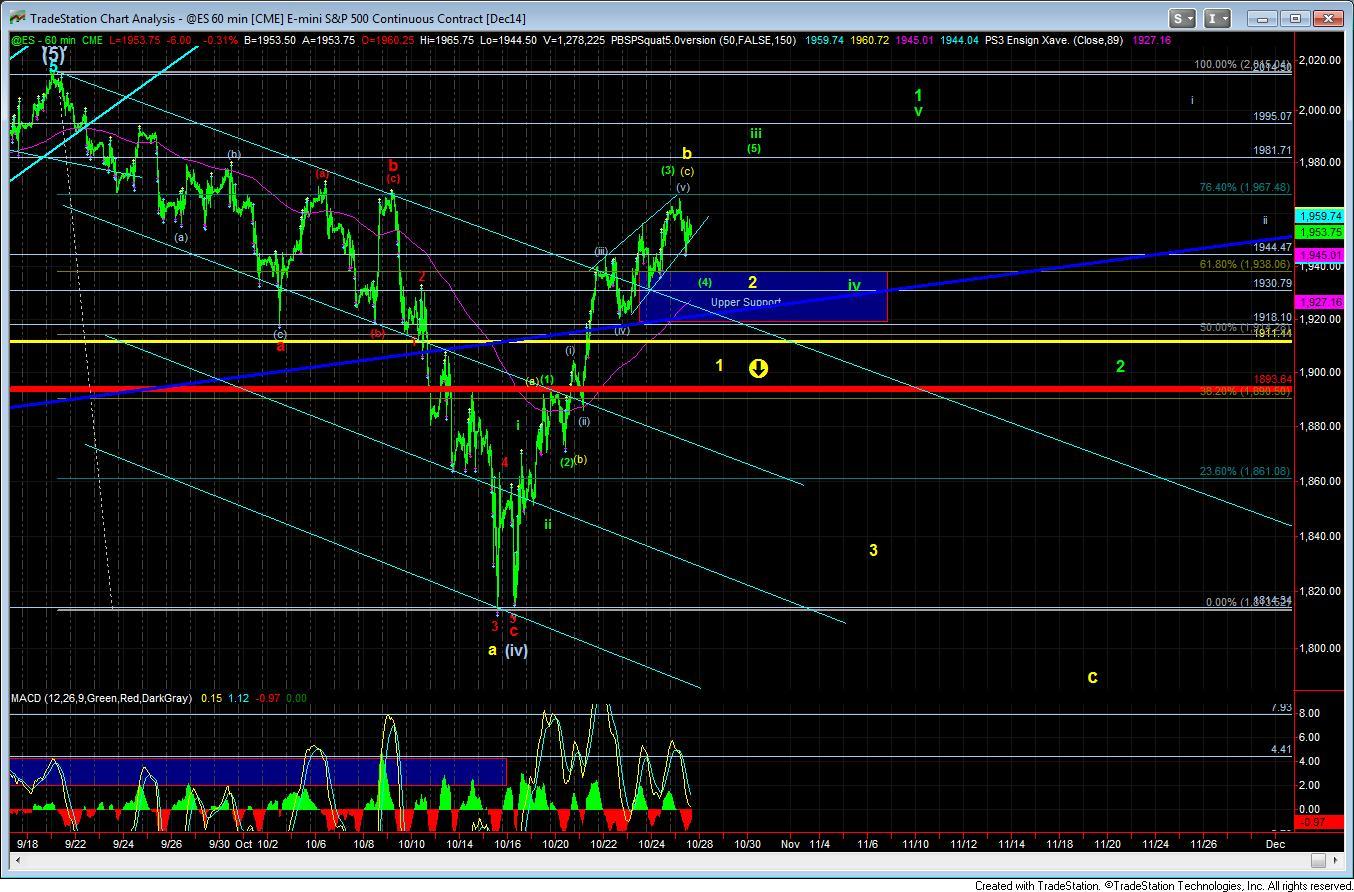
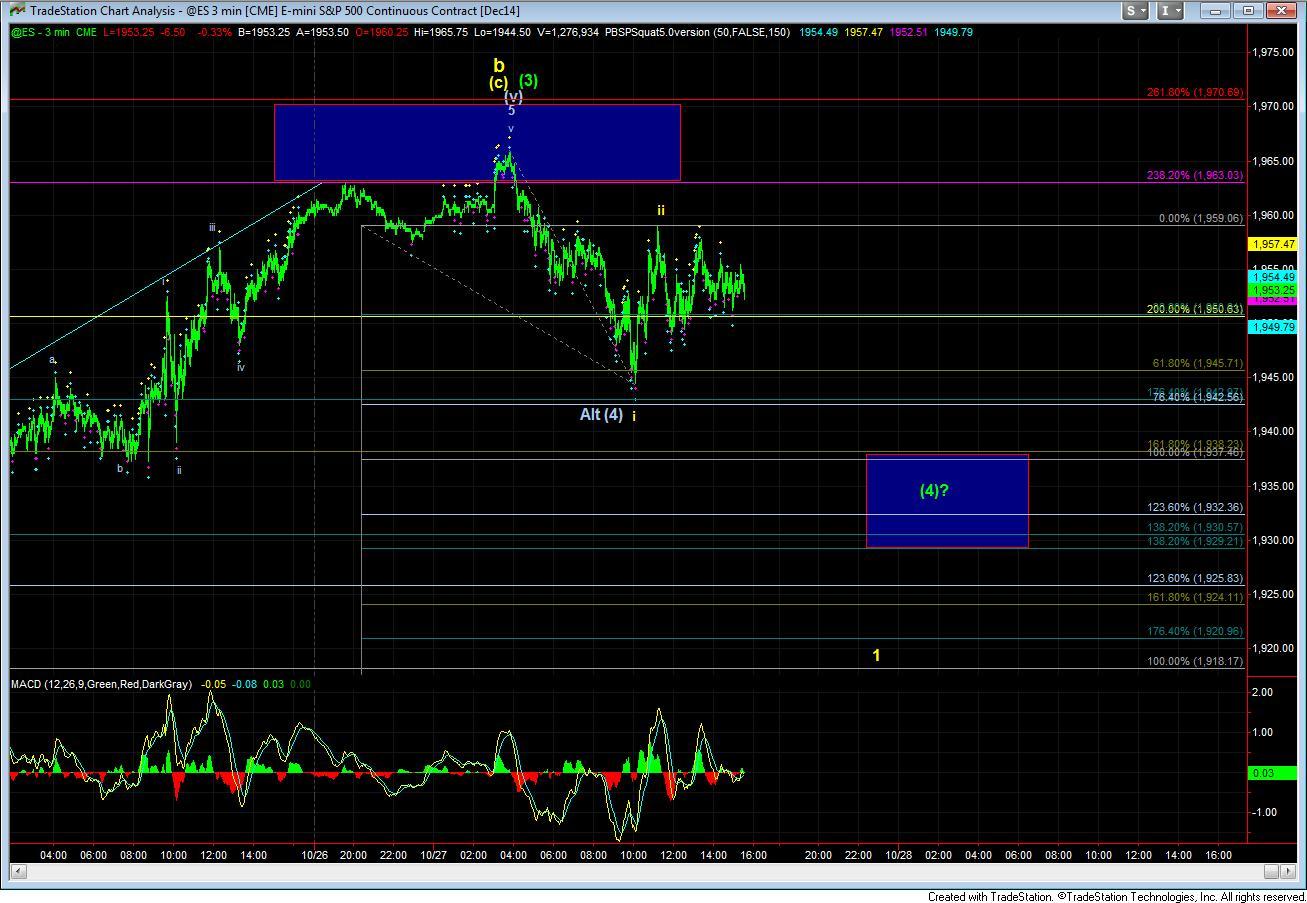
Based upon our analysis over the weekend, we are looking for whether the market is going to drop correctively and hold our support region over 1918ES, or if it will develop as an impulsive move down to break below 1918ES, giving us our first signal of a b-wave top.
And, as usual, the market has still left both possibilities on the table, at least at the time of my writing this update.
For the bullish count, ideally, we would still see one more drop towards the 1930-1938ES region to complete wave (4), thereby setting us up to rally in wave (5) for approximately 40 points.
However, at the same time, the market does have a i-ii set up to the downside, which is pointing directly at our 1918ES region. My expectation is that we should see some amount of resolution tomorrow.
Again, please remember that we are looking for a good entry for the rally we expect into 2015. That means that the entry will either be a wave 2 pullback into November in the 1900ES region, or it will be from a larger degree c-wave down, which can still take us into the 1700's. Please try to keep an open mind until the market makes up its mind in this region. But, please do have your shopping list ready to go.
Mike Paulenoff, on Sell the News Reaction to Fed (MPTrader.com)
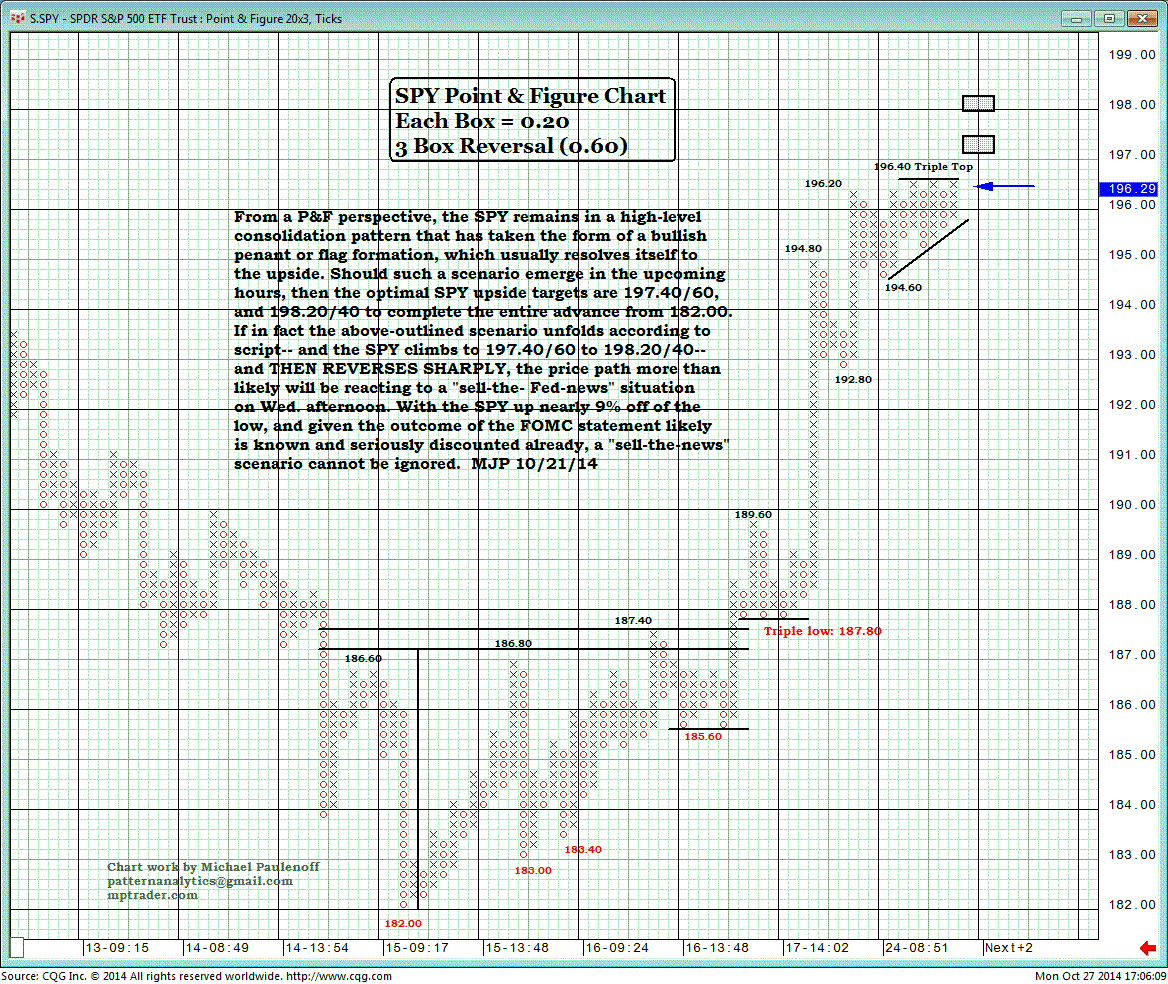
From a point-and-figure perspective, the SPY remains in a high-level consolidation pattern that has taken the form of a bullish pennant or flag formation, which usually resolves itself to the uspide.
Should such a scenario emerge in the upcoming hours, then the optimal SPY upside targets are 197.40/60, and 198.20/40 to complete the entire advance from 182.00.
If, in fact, the above-outlined scenario unfolds according to script -- but then reverses sharply -- the price path more likely will be reacting to the "sell-the-Fed news" situation on Wednesday afternoon.
With the SPY up nearly 9% off the low and given that the outcome of the FOMC statement likely is known and seriously discounted already, a "sell the news" scenario cannot be ignored.
Harry Boxer, on 4 Stocks to Watch for Tuesday (TheTechTrader.com)
The markets had an interesting, volatile day on Monday, ending mixed. Some of the stocks we follow did well, and here are four to watch.
ALIBABA GROUP HOLDING LTD (BABA), a recent IPO, came down after the IPO pop from the 109 range to the low 80's, towards the 82-81 low. In a week and a half it's gone up from there to Monday's high of 98.85, up 2.03, or 2%, on 28 million shares. It has been up 8 out of 9 days. As early as Tuesday, this stock may pop. Keep an eye on it. If it gets above the 97-99 area, it may start to run.
Bristol-Myers Squibb Company (BMY) has broken out of a beautiful base that took six months to develop. Such a short move requires some sort of pullback/consolidation, which may have begun on Monday. It was only off a dime. The volume increased a little bit. I think that if that stock pulls back in this zone and consolidates, it's headed to much higher levels. First, a retest of the early year's high at the 57 range, and if it gets through that, we could see 63ish. Those are the targets.
Cyber-Ark Software Ltd. (CYBR) had an excellent day on Monday. Always look at an IPO on a 15-minute basis for more chart data. This stock backed and filled for three weeks, or so, and broke out over the last couple sessions. You can see a spike up, it reached the post-IPO high at 35.88, and on Monday, it spiked up again, up 4.84, or 16%, on 3.9 million shares. The short-term target on this one is 39.40.
ReWalk Robotics Ltd. (RWLK) also had a good day on Monday, up 3.18, or 12%, on 506,700 shares traded. It came out and popped, and then drifted down from the declining channel. Two declining topslines were broken, and it punched through the moving averages. Watch resistance at 30, which it may reach Tuesday morning. Between 30 and 31 1/2 are scalp targets, but my swing trade target is around 35.
Other on Harry's Charts of the Day are Chembio Diagnostics, Inc. (CEMI), NewLink Genetics Corporation (NLNK), Infinera Corporation (INFN), NewLink Genetics Corporation (NLNK), Novavax, Inc. (NVAX), and Vitae Pharmaceuticals, Inc. (VTAE).
Stocks on the short side include CARBO Ceramics Inc. (CRR), Emerge Energy Services LP (EMES), Hi-Crush Partners LP (HCLP), Hornbeck Offshore Services, Inc. (HOS), Nu Skin Enterprises Inc. (NUS), Qihoo 360 Technology Co. Ltd. (QIHU), Westlake Chemical Corp. (WLK), and Yelp, Inc. (YELP).
This Web site is published by AdviceTrade, Inc. AdviceTrade is a publisher and not registered as a securities broker-dealer or investment advisor either with the U.S. Securities and Exchange Commission or with any state securities authority. The information on this site has been obtained from sources considered reliable but we neither guarantee nor represent the completeness or accuracy of the information. In addition, this information and the opinions expressed are subject to change without notice. Neither AdviceTrade nor its principals own shares of, or have received compensation by, any company covered or any fund that appears on this site. The information on this site should not be relied upon for purposes of transacting securities or other investments, nor should it be construed as an offer or solicitation of an offer to sell or buy any security. AdviceTrade does not assess, verify or guarantee the suitability or profitability of any particular investment. You bear responsibility for your own investment research and decisions and should seek the advice of a qualified securities professional before making any investment.
Recommended Content
Editors’ Picks
EUR/USD edges lower toward 1.0700 post-US PCE

EUR/USD stays under modest bearish pressure but manages to hold above 1.0700 in the American session on Friday. The US Dollar (USD) gathers strength against its rivals after the stronger-than-forecast PCE inflation data, not allowing the pair to gain traction.
GBP/USD retreats to 1.2500 on renewed USD strength

GBP/USD lost its traction and turned negative on the day near 1.2500. Following the stronger-than-expected PCE inflation readings from the US, the USD stays resilient and makes it difficult for the pair to gather recovery momentum.
Gold struggles to hold above $2,350 following US inflation

Gold turned south and declined toward $2,340, erasing a large portion of its daily gains, as the USD benefited from PCE inflation data. The benchmark 10-year US yield, however, stays in negative territory and helps XAU/USD limit its losses.
Bitcoin Weekly Forecast: BTC’s next breakout could propel it to $80,000 Premium

Bitcoin’s recent price consolidation could be nearing its end as technical indicators and on-chain metrics suggest a potential upward breakout. However, this move would not be straightforward and could punish impatient investors.
Week ahead – Hawkish risk as Fed and NFP on tap, Eurozone data eyed too

Fed meets on Wednesday as US inflation stays elevated. Will Friday’s jobs report bring relief or more angst for the markets? Eurozone flash GDP and CPI numbers in focus for the Euro.


