I never liked mid-year report cards. They were just another opportunity for my parents and teachers to conclude that I wasn’t living up to their expectations. Besides, I always felt that I could rally in the second half to bring home a good result.
This year’s mid-point review would not be terribly kind to me or to other forecasters. None of us foresaw a big U.S. economic contraction during the first quarter of the year, although we should have better times ahead (as long as the Polar Vortex doesn’t return). A more vexing surprise, however, has been the steep decline in U.S. Treasury yields and the persistently low market volatility during the year’s first half.
At the outset of 2014, we expected that improving American fundamentals would lead market participants to expect less accommodation from the Federal Reserve and persuade investors to move out of safe-haven asset classes. This should have produced a modest upward drift in long-term rates. Instead, the 10-year Treasury yield has fallen to about 2.6% currently after opening January above 3%.
There are a number of hypotheses that aim to explain why this occurred. In no particular order:
- The Federal Reserve is expected to be less aggressive than previously thought in normalizing monetary policy. Key officials have suggested that the exit strategy will be very slow, with some suggesting that conditions would remain very accommodative for some time after inflation and employment normalize. According to press accounts, former Fed Chairman Ben Bernanke has privately shared the expectation that overnight rates would not reach their long-range level of 4% in his lifetime.
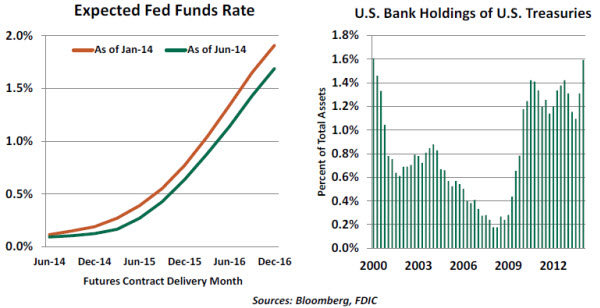
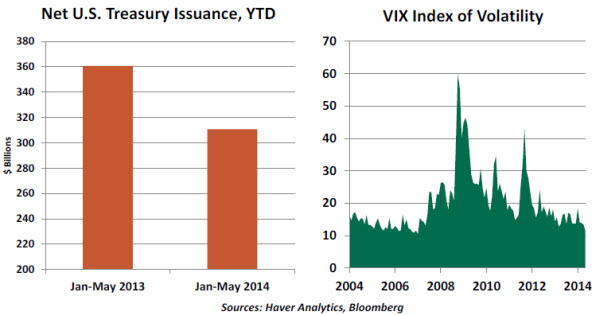
- Financial institutions have been loading up on Treasury securities to meet heightened requirements for high-quality collateral. These holdings are favored by new rules on liquidity and the requirements of central clearinghouses handling derivatives transactions. The fraction of U.S. bank assets held in Treasury bonds stands at its highest level since 2000.
- Institutional and individual investors are rebalancing their portfolios after enjoying substantial equity market gains. In some cases, this is prompted solely by the discipline of asset allocation targets. In others, pension managers and retirees are taking steps to more closely match their liabilities with fixed-income products.
- Bond investors may be looking away from Europe. Rates on eurozone sovereign bonds have fallen sharply, and 10-year government yields in places like Ireland and Spain stand only fractionally above Treasury yields. Given the relative positions of the various jurisdictions, the differential may not be sufficient compensation for risk. In addition, the expectation that the European Central Bank was on the verge of moving its benchmark rates into negative territory may have prompted capital to move west across the Atlantic.
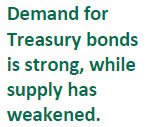
- The supply of new U.S. Treasury securities has been contracting. With budget shortfalls in decline, the issuance of bonds has also diminished. While the Federal Reserve has tapered its monthly purchases of government securities, it continues to add $25 billion each month and (for now) purchases additional new issues to replace maturing ones. This leaves a modest amount for private portfolios.
- There has been some flight to quality prompted by all the international uncertainties that have arisen during the first six months of the year. Conflict in Ukraine, slowing Chinese growth and regime changes in several countries prompted some investors to de-risk their holdings and await more clarity.
This last point raises the question of why market volatility remains so muted. The often-cited equity volatility index (VIX) has fallen to levels not seen since 2005. In retrospect, this was a period when markets became somewhat overconfident, setting up the rapid reversal of 2008.
Those who are more sanguine about the situation note that the VIX is a very limited measure, relating as it does to the S&P 500. With that index setting a series of records this year, it certainly might appear less risky than it has in the past. Not all markets have performed that well, though, and other indicators of volatility are not fully settled.
Yet Bill Dudley, president of the Federal Reserve Bank of New York, worried about this in a recent speech. The continued promise of supportive monetary policy in the developed economies may be giving market participants an exaggerated sense of comfort. The tacit expectation of support from central banks, which used to be called the “Greenspan put” in the United States, creates a degree of moral hazard.
What one might draw from the examples of the U.S. Treasury market and the VIX is that pricing reflects a very benign outlook for debt and equities. I certainly hope that comes to pass, as it will help my final 2014 grades. But the risk on both counts may be to the downside.
Janet Yellen’s Dashboard Signals Long Wait for Normalization
Fed Chair Janet Yellen spelled out the entire range of labor market indicators she follows in a March 2013 speech, and these indicators have remained a staple in her recent remarks. When assembled, they form a comprehensive guide to labor market fundamentals. At the present time, we have a series of mixed signals that supports expectations of a measured approach to normalization of the Fed’s monetary policy stance.
The May headline unemployment rate, which Yellen views as “the best single indicator of current labor market conditions,” stands at 6.3% versus 7.5% a year ago. It is flashing green, as it is within close reach of the Federal Open Market Committee’s long-run projection of the unemployment rate (5.2%-5.6%), a level thought to represent the Fed’s full-employment mandate. 
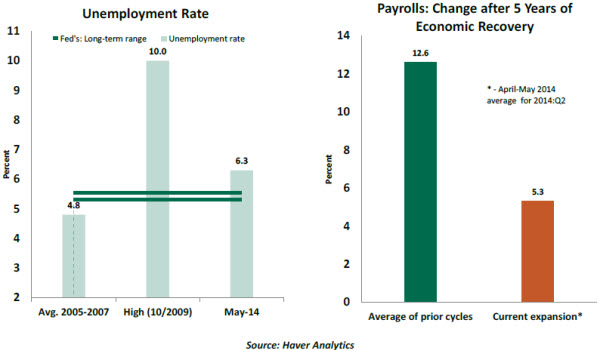
Yellen sees payroll employment as “highly correlated with a diverse set of labor market indicators.” The 217,000 increase in payroll employment during May puts the three-month moving average at 234,000, which paints a much-improved hiring situation. However, cumulative job creation in the current expansion is significantly softer compared with the experience of prior business cycles, and it is therefore flashing an amber signal.
The other indicators in Yellen’s dashboard do not send an unequivocal signal of strength. The labor force participation rate has largely flattened out this year, after declining since late 2008. The latest six-month moving average of the participation rate, at 62.9%, slipped one notch from the trend seen in the first four months of the year. There remains a significant cyclical component in labor force participation, which reflects substandard job prospects. As the participation rate has not moved up consistently, the nearly flat trend places it among the set of indicators flashing amber.
Involuntary part-time employment as a percent of total employment slipped to 5.0% in May from 5.1% in April, a small but noteworthy development. Nonetheless, the unusually high level of part-time employment as a percent of total employment represents a large pool of labor that can be transformed into full-time employment without wage pressures. The share of long-term unemployment at 34.6% is gradually declining but remains elevated. These two labor market indicators point to a slow improvement and therefore are part of the amber group of labor market signals. 
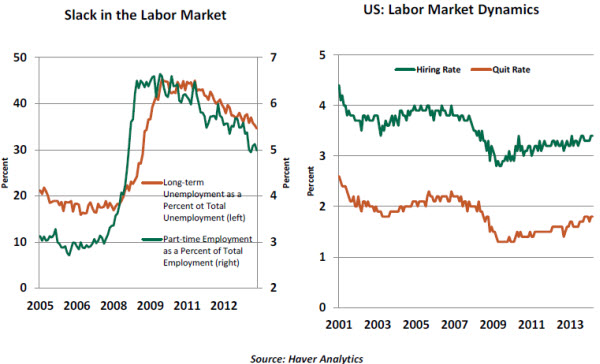
The quit rate and the hiring rate add more color to the dynamics of the labor market. The quit rate in March, at 1.8%, is lower than what prevailed before the global financial crisis, but recent readings show improvement. The quit rate is useful, as it represents the degree of confidence people have in finding another job.
According to Yellen, the hiring rate “remains extremely depressed” and conveys a slightly different message from recent readings of the quit rate. The hiring rate is less amber than the quit rate, but both are moving in the right direction.
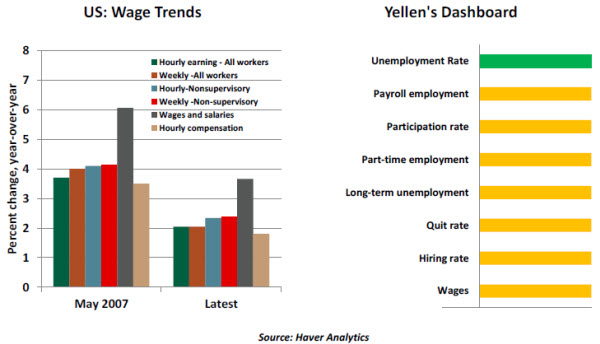
Wage growth shows a stubbornly slow ascent. Hourly earnings of all workers rose 2.05% in May, a marginal gain from the 1.97% reading of April. Hourly earnings of non-supervisory workers, a longer time series, posted a 2.35% gain in May, virtually unchanged from April (2.34%).
All measures of labor compensation – hourly and weekly earnings of all workers and non-supervisory workers; wages and salaries in the personal income report; and hourly compensation in the productivity report – stood at a markedly higher level of growth in May 2007 compared with the latest labor compensation readings. Labor compensation is hovering around 2.0% after nearly five years of economic growth, while they held around 3.0% – 4.0% before the Great Recession. The main takeaway from this comparison is that wage growth stands at the lower end of the amber category. 
Wage growth is also critical for the Fed’s assessment of inflation. The personal consumption expenditure price index and the core price measure rose 1.6% and 1.4%, respectively, from a year ago in April. These readings are well below the Fed’s 2.0% target, but they have moved up slightly. The slack in the economy in the form of underemployment is likely to restrain wage growth in the near term.
The Fed has noted that it will consider a range of labor market indicators to assess its status. There are members of the Federal Open Market Committee who are likely to view the latest employment numbers in a more-positive light than others and argue for a normalization of interest rates soon after the asset purchase program is completed later in the year.
But, pulling it all together, amber signals dominate Yellen’s dashboard at the moment. Of those in the amber group, wage growth is particularly important because it drives spending in the economy. Yellen’s dashboard sends a strong message of a Fed unlikely to rush toward normalizing the federal funds rate after the asset purchase program is completely wound down later this year.
Recommended Content
Editors’ Picks
EUR/USD edges lower toward 1.0700 post-US PCE

EUR/USD stays under modest bearish pressure but manages to hold above 1.0700 in the American session on Friday. The US Dollar (USD) gathers strength against its rivals after the stronger-than-forecast PCE inflation data, not allowing the pair to gain traction.
GBP/USD retreats to 1.2500 on renewed USD strength

GBP/USD lost its traction and turned negative on the day near 1.2500. Following the stronger-than-expected PCE inflation readings from the US, the USD stays resilient and makes it difficult for the pair to gather recovery momentum.
Gold struggles to hold above $2,350 following US inflation

Gold turned south and declined toward $2,340, erasing a large portion of its daily gains, as the USD benefited from PCE inflation data. The benchmark 10-year US yield, however, stays in negative territory and helps XAU/USD limit its losses.
Bitcoin Weekly Forecast: BTC’s next breakout could propel it to $80,000 Premium

Bitcoin’s recent price consolidation could be nearing its end as technical indicators and on-chain metrics suggest a potential upward breakout. However, this move would not be straightforward and could punish impatient investors.
Week ahead – Hawkish risk as Fed and NFP on tap, Eurozone data eyed too

Fed meets on Wednesday as US inflation stays elevated. Will Friday’s jobs report bring relief or more angst for the markets? Eurozone flash GDP and CPI numbers in focus for the Euro.