August proved to a be a good month for the Dollar-Yen pair as financial markets were pretty much dull, while July/August disappointment from Bank of Japan (BOJ) and Japanese government was overshadowed by hawkish Yellen at the Jackson Hole event. The net result was the spot closed higher at 103.31 after having clocked a monthly low of 99.52 levels.
Monthly chart screams trend reversal
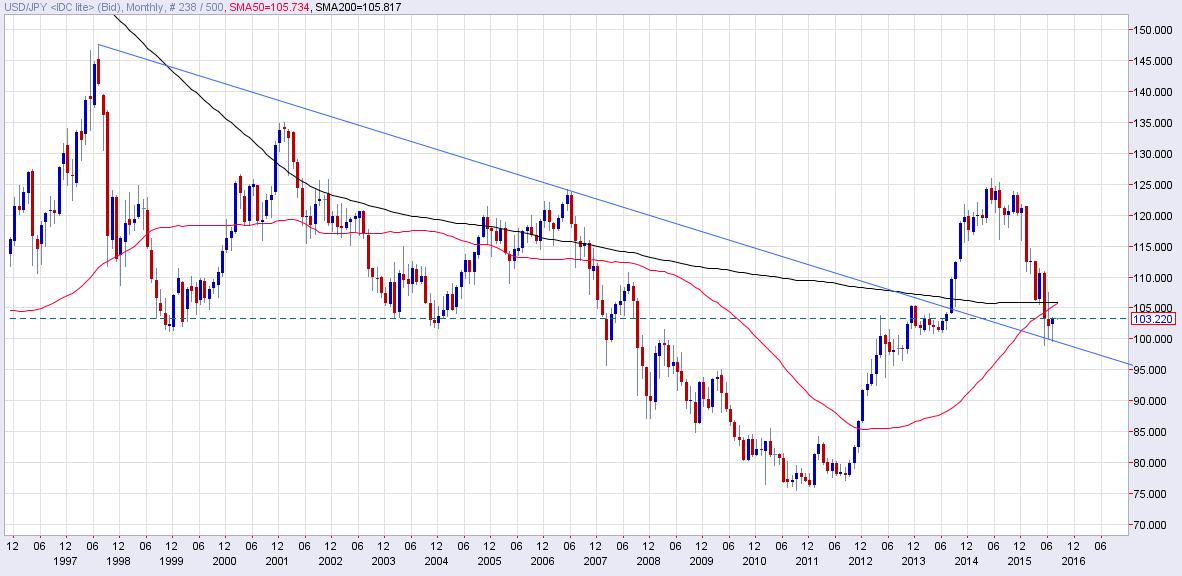
Let us first note that back in the early 80s, USD/JPY pair traded close to 280, while in the 70s it actually clocked a high of around 306.00. What it means is that the spot has been in a long-term downtrend and the rally from 2011 low has not even retracted 23.6% of the entire fall from 306.19 (Dec 1975 high) to 75.56 (Oct 2011 low).
Keeping in mind these facts if we take note of the bullish developments on the monthly chart, it appears the pair is set to rally once again. Following bullish developments could be noted on the monthly chart –
- Repeated rebound from long-term falling trend line coming from Aug 1998 and June 2007 high
- Bullish hammer candlestick following a rebound from long-term falling trend line and
- A possible bullish crossover; also known as the ‘golden cross’ between 50-MA and 200-MA
The fact that the pair repeatedly sought support around long-term falling trend line in last three months and ended August with a bullish hammer candle signals the ‘golden cross’ is very much possible. Both averages have almost converged.
Furthermore, the golden cross on many occasions has been a laggard indicator. However, in this case as noted above, we are nowhere near record highs. In fact, the spot has not even retracted 23.6% of the multi decade downtrend which means the golden cross is likely to work.
In the short-run the immediate upside is likely to be capped around 105.82 (200-DMA). A positive September/October period would confirm the rising trend from 2011 lows is still intact. Only a month end close below the long-term falling trend line would signal bullish invalidation.
Moreover, the monthly chart could pointing to a drastic action from Bank of Japan (BOJ)/Japanese government and/or faster than expected tightening in the US.
AUD/USD Forecast: Watch out for rejection at 0.7550
Daily chart
-636082880686232072.png)
- Aussie’s drop to a one-month low of 0.7490 yesterday followed by a minor rebound and positive day end close back above 100-DMA suggests a short-term loss of momentum is likely to keep the currency pair stuck in a range of 100-DMA level of 0.7494 and rising trend line (drawn from June 24 low and July 27 low) level of 0.7550.
- A rejection either at 0.7526 (38.2% of 0.7148-0.7760) or 0.7550 (trend line hurdle) if followed by a break below 100-DMA level of 0.7494 would signal fresh sell-off towards to July 27 low of 0.7420.
NZD/USD Forecast: Awaits breakout
Daily chart
-636082880894287746.png)
- The spot finds itself restricted to a narrow trading range defined by rising channel resistance and 38.2% Fibo support of 0.7205.
- The rising channel resistance is seen today around 0.7264 levels. Thus the trading range is 0.7205-0.7264.
- An upside break on the daily chart would open doors for a revisit to strong resistance zone of 0.72-0.7250.
- On the lower side, daily close below 0.7205 would simply suggest continuation of the retreat from last Friday’s high of 0.7380. The immediate support at 0.7140 (Aug 3 low) could be put to test in this case.
Information on these pages contains forward-looking statements that involve risks and uncertainties. Markets and instruments profiled on this page are for informational purposes only and should not in any way come across as a recommendation to buy or sell in these assets. You should do your own thorough research before making any investment decisions. FXStreet does not in any way guarantee that this information is free from mistakes, errors, or material misstatements. It also does not guarantee that this information is of a timely nature. Investing in Open Markets involves a great deal of risk, including the loss of all or a portion of your investment, as well as emotional distress. All risks, losses and costs associated with investing, including total loss of principal, are your responsibility. The views and opinions expressed in this article are those of the authors and do not necessarily reflect the official policy or position of FXStreet nor its advertisers. The author will not be held responsible for information that is found at the end of links posted on this page.
If not otherwise explicitly mentioned in the body of the article, at the time of writing, the author has no position in any stock mentioned in this article and no business relationship with any company mentioned. The author has not received compensation for writing this article, other than from FXStreet.
FXStreet and the author do not provide personalized recommendations. The author makes no representations as to the accuracy, completeness, or suitability of this information. FXStreet and the author will not be liable for any errors, omissions or any losses, injuries or damages arising from this information and its display or use. Errors and omissions excepted.
The author and FXStreet are not registered investment advisors and nothing in this article is intended to be investment advice.
Recommended Content
Editors’ Picks
EUR/USD edges lower toward 1.0700 post-US PCE

EUR/USD stays under modest bearish pressure but manages to hold above 1.0700 in the American session on Friday. The US Dollar (USD) gathers strength against its rivals after the stronger-than-forecast PCE inflation data, not allowing the pair to gain traction.
GBP/USD retreats to 1.2500 on renewed USD strength

GBP/USD lost its traction and turned negative on the day near 1.2500. Following the stronger-than-expected PCE inflation readings from the US, the USD stays resilient and makes it difficult for the pair to gather recovery momentum.
Gold struggles to hold above $2,350 following US inflation

Gold turned south and declined toward $2,340, erasing a large portion of its daily gains, as the USD benefited from PCE inflation data. The benchmark 10-year US yield, however, stays in negative territory and helps XAU/USD limit its losses.
Bitcoin Weekly Forecast: BTC’s next breakout could propel it to $80,000 Premium

Bitcoin’s recent price consolidation could be nearing its end as technical indicators and on-chain metrics suggest a potential upward breakout. However, this move would not be straightforward and could punish impatient investors.
Week ahead – Hawkish risk as Fed and NFP on tap, Eurozone data eyed too

Fed meets on Wednesday as US inflation stays elevated. Will Friday’s jobs report bring relief or more angst for the markets? Eurozone flash GDP and CPI numbers in focus for the Euro.