EUR/USD
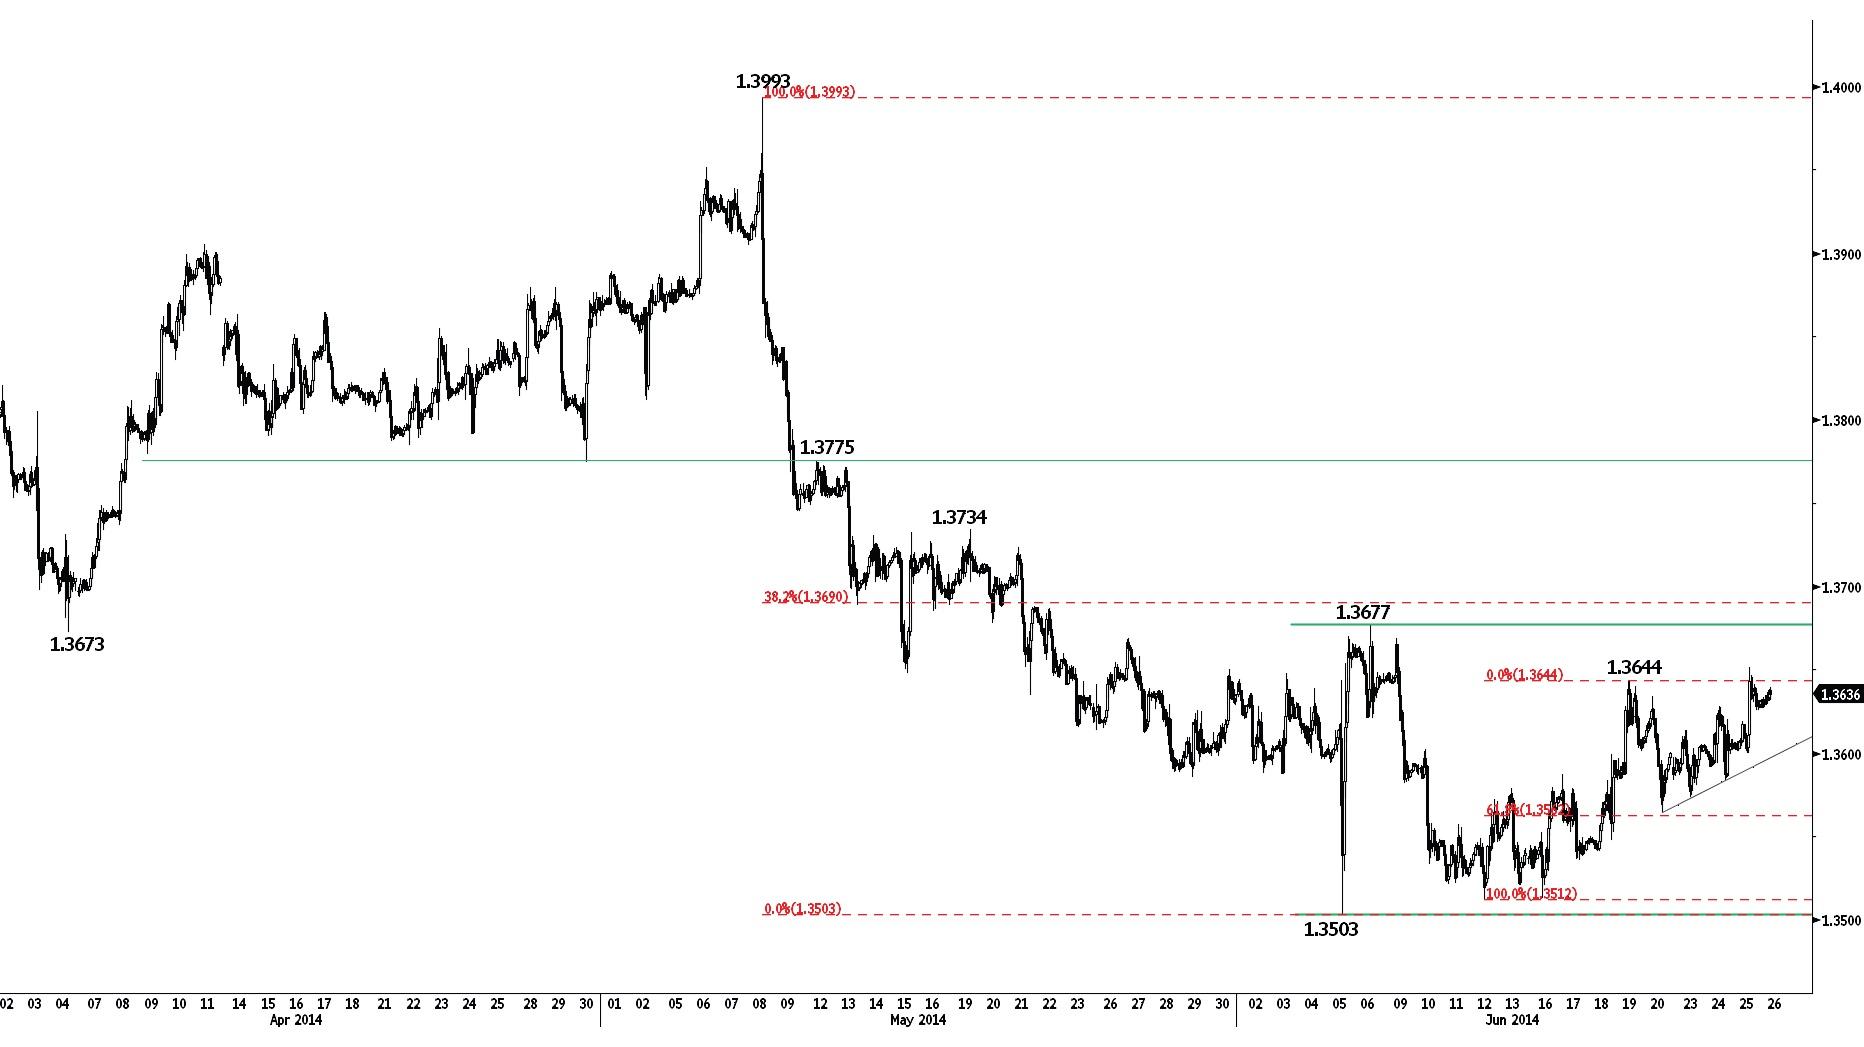
Challenging the resistance at 1.3644.
EUR/USD continues to grind higher within the horizontal range defined by 1.3503 and 1.3677. Monitor the test of the hourly resistance at 1.3644. An hourly support lies at 1.3565 (20/06/2014 low, see also the 61.8% retracement).
In the longer term, the break of the long-term rising wedge (see also the support at 1.3673) indicates a clear deterioration of the technical structure. The long-term downside risk implied by the double-top formation is 1.3379. Key supports can be found at 1.3477 (03/02/2014 low) and 1.3296 (07/11/2013 low).
Await fresh signal.
GBP/USD
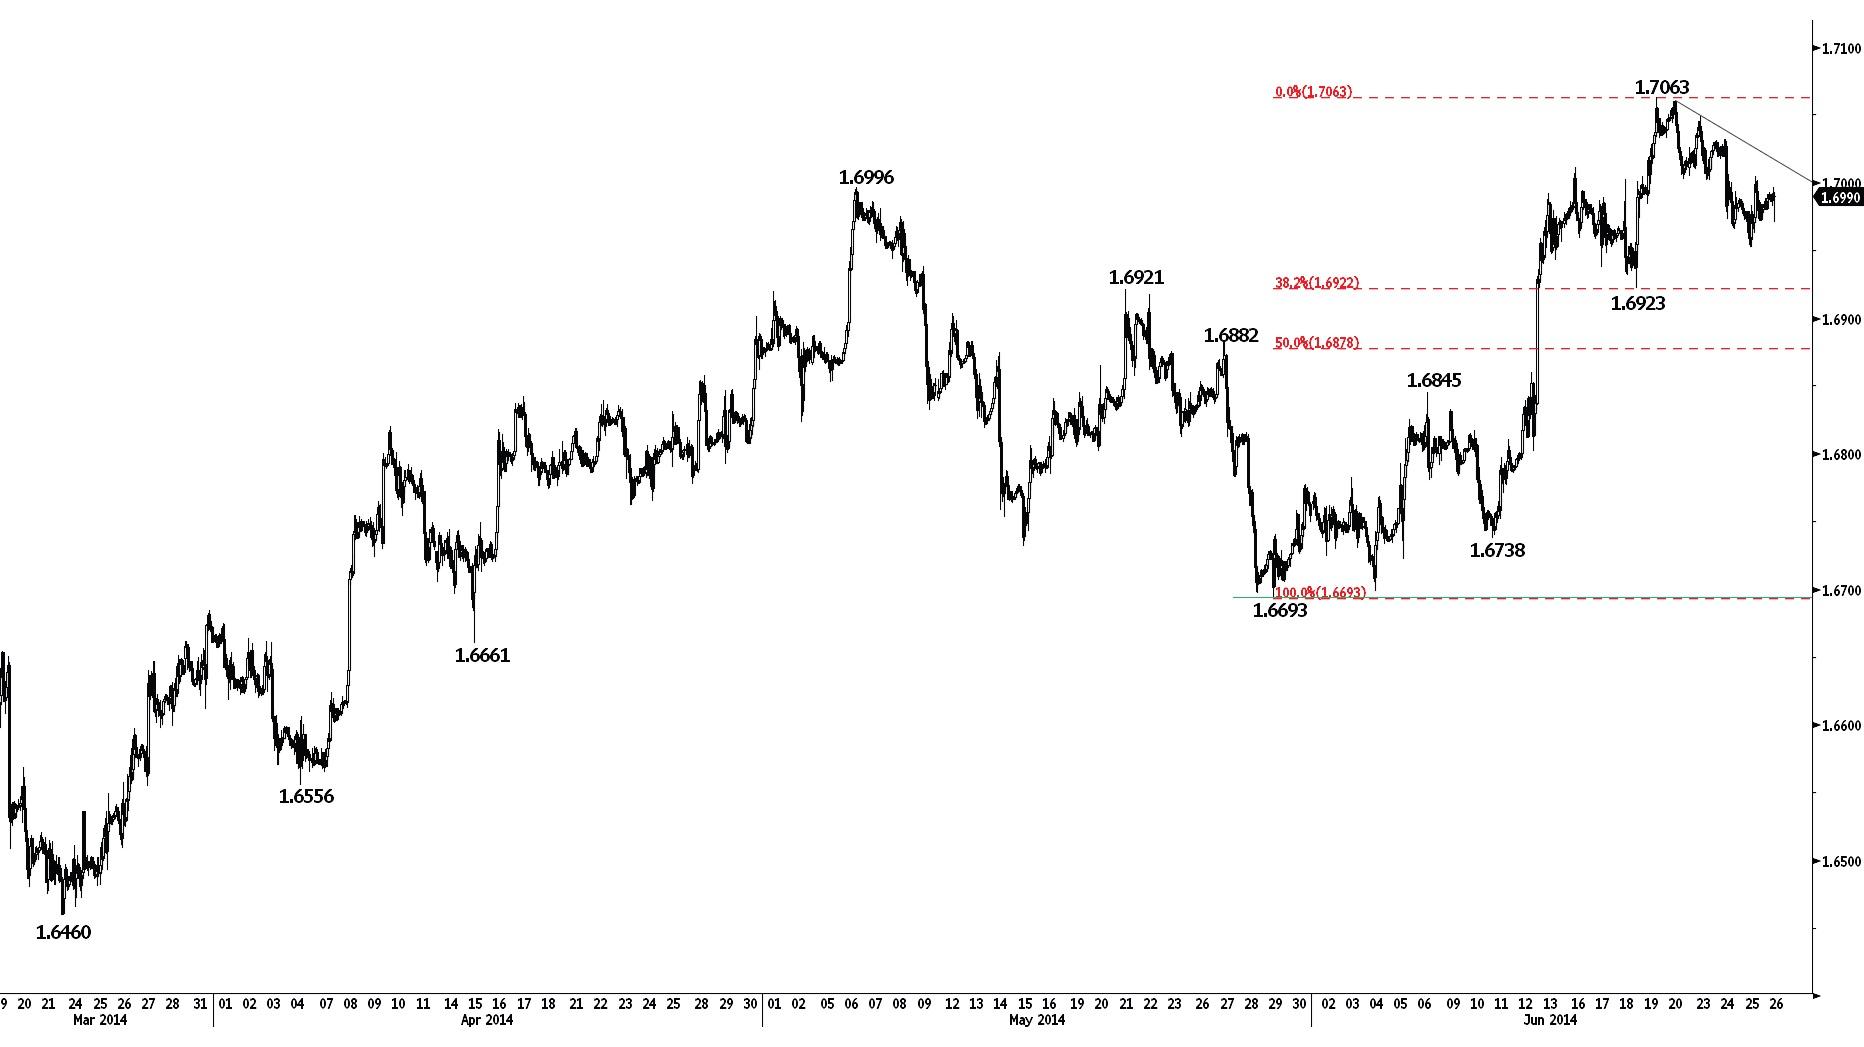
Short-term correction underway.
GBP/USD has weakened after having failed to break the major resistance at 1.7043. A shortterm correction is in place as long as prices remain below the hourly resistance at 1.7006 (intraday high, see also the declining trendline). A support stands at 1.6923 (18/06/2014 low, see also the 38.2% retracement). Another support can be found at 1.6882 (27/05/2014 high, see also the 50% retracement).
In the longer term, an eventual break of the major resistance at 1.7043 (05/08/2009 high) is favoured as long as the support at 1.6693 (29/05/2014 low) holds. Other resistances can be found at 1.7332 (see the 50% retracement of the 2008 decline) and 1.7447 (11/09/2008 low).
Await fresh signal.
USD/JPY
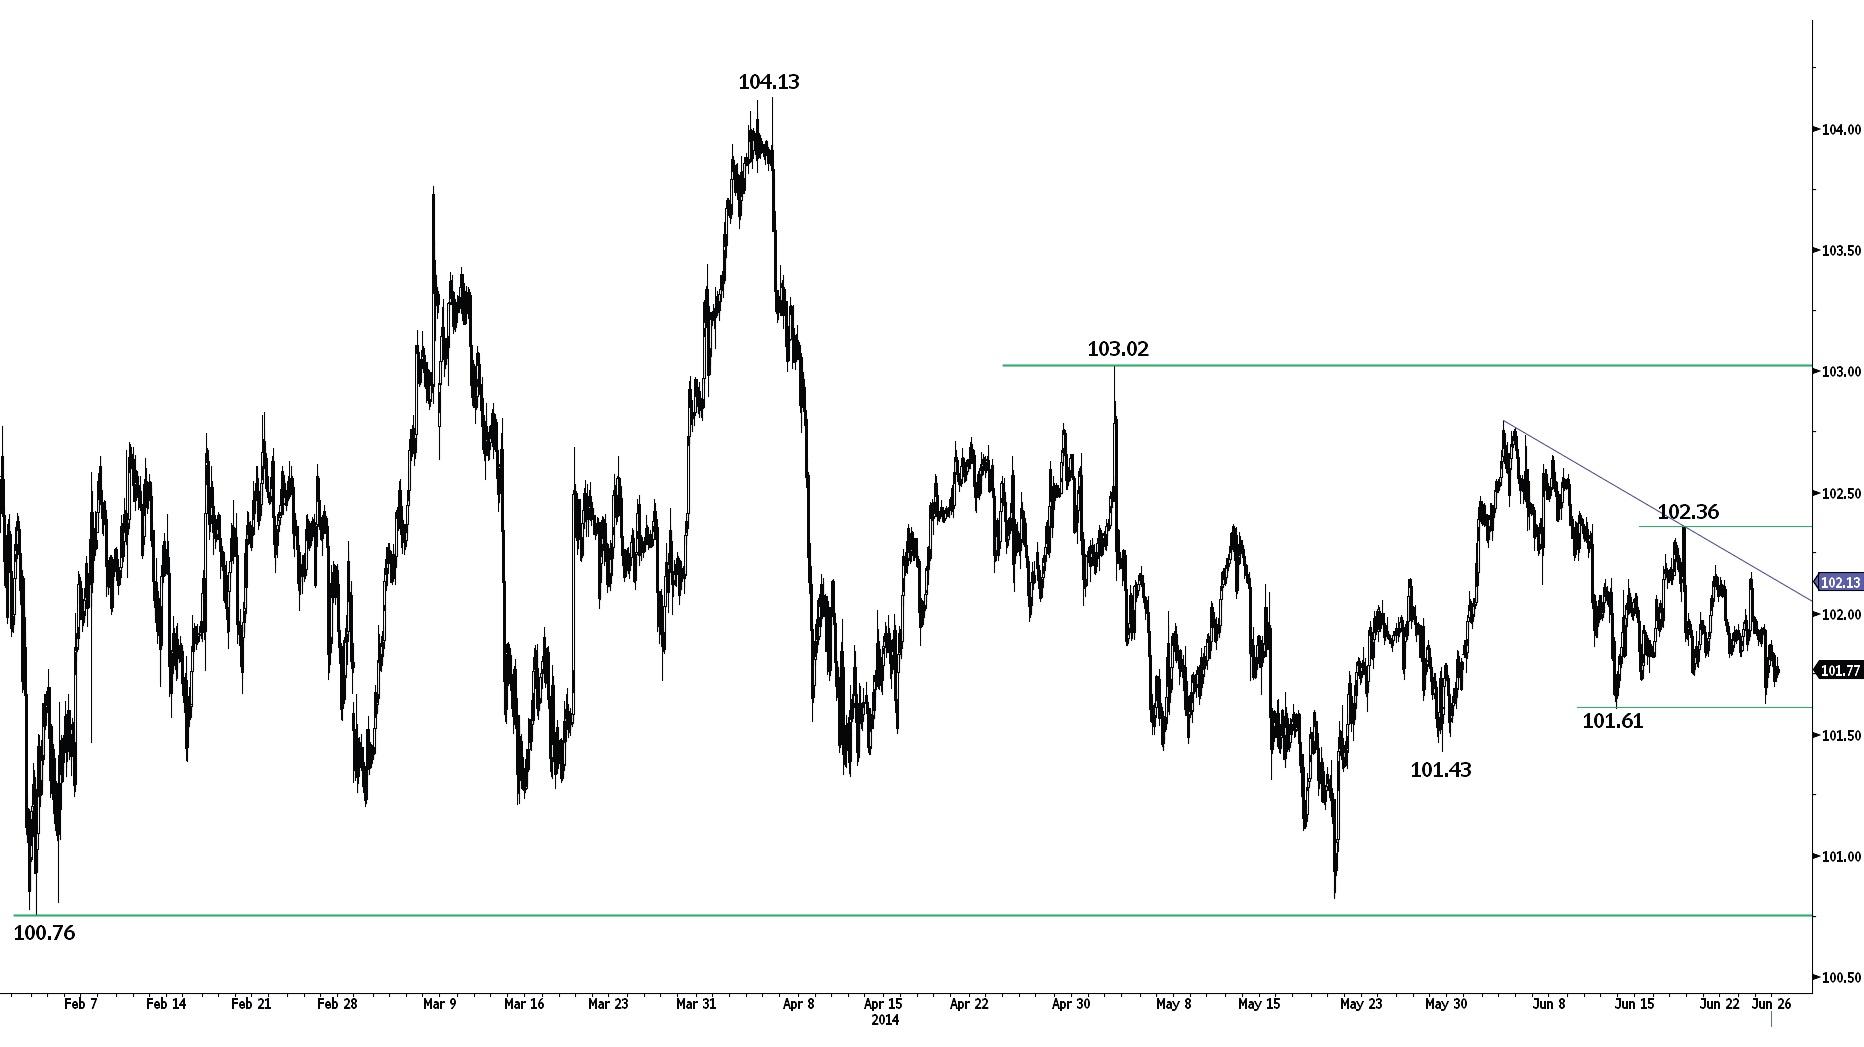
Succession of lower highs favours a bearish bias.
USD/JPY is moving sideways despite the proximity of the support implied by the 200 day moving average (around 101.61). The persistent succession of lower highs (see the declining trendline) favours a bearish bias. Hourly resistances stand at 102.20 (20/06/2014 high) and 102.36. Other supports can be found at 101.43 and 100.76.
A long-term bullish bias is favoured as long as the key support 99.57 (19/11/2013 low) holds. Monitor the support area provided by the 200 day moving average and 100.76 (04/02/2014 low). A break of the key resistance at 103.02 is needed to suggest the end of the current consolidation phase. A major resistance stands at 110.66 (15/08/2008 high).
Await fresh signal.
USD/CHF
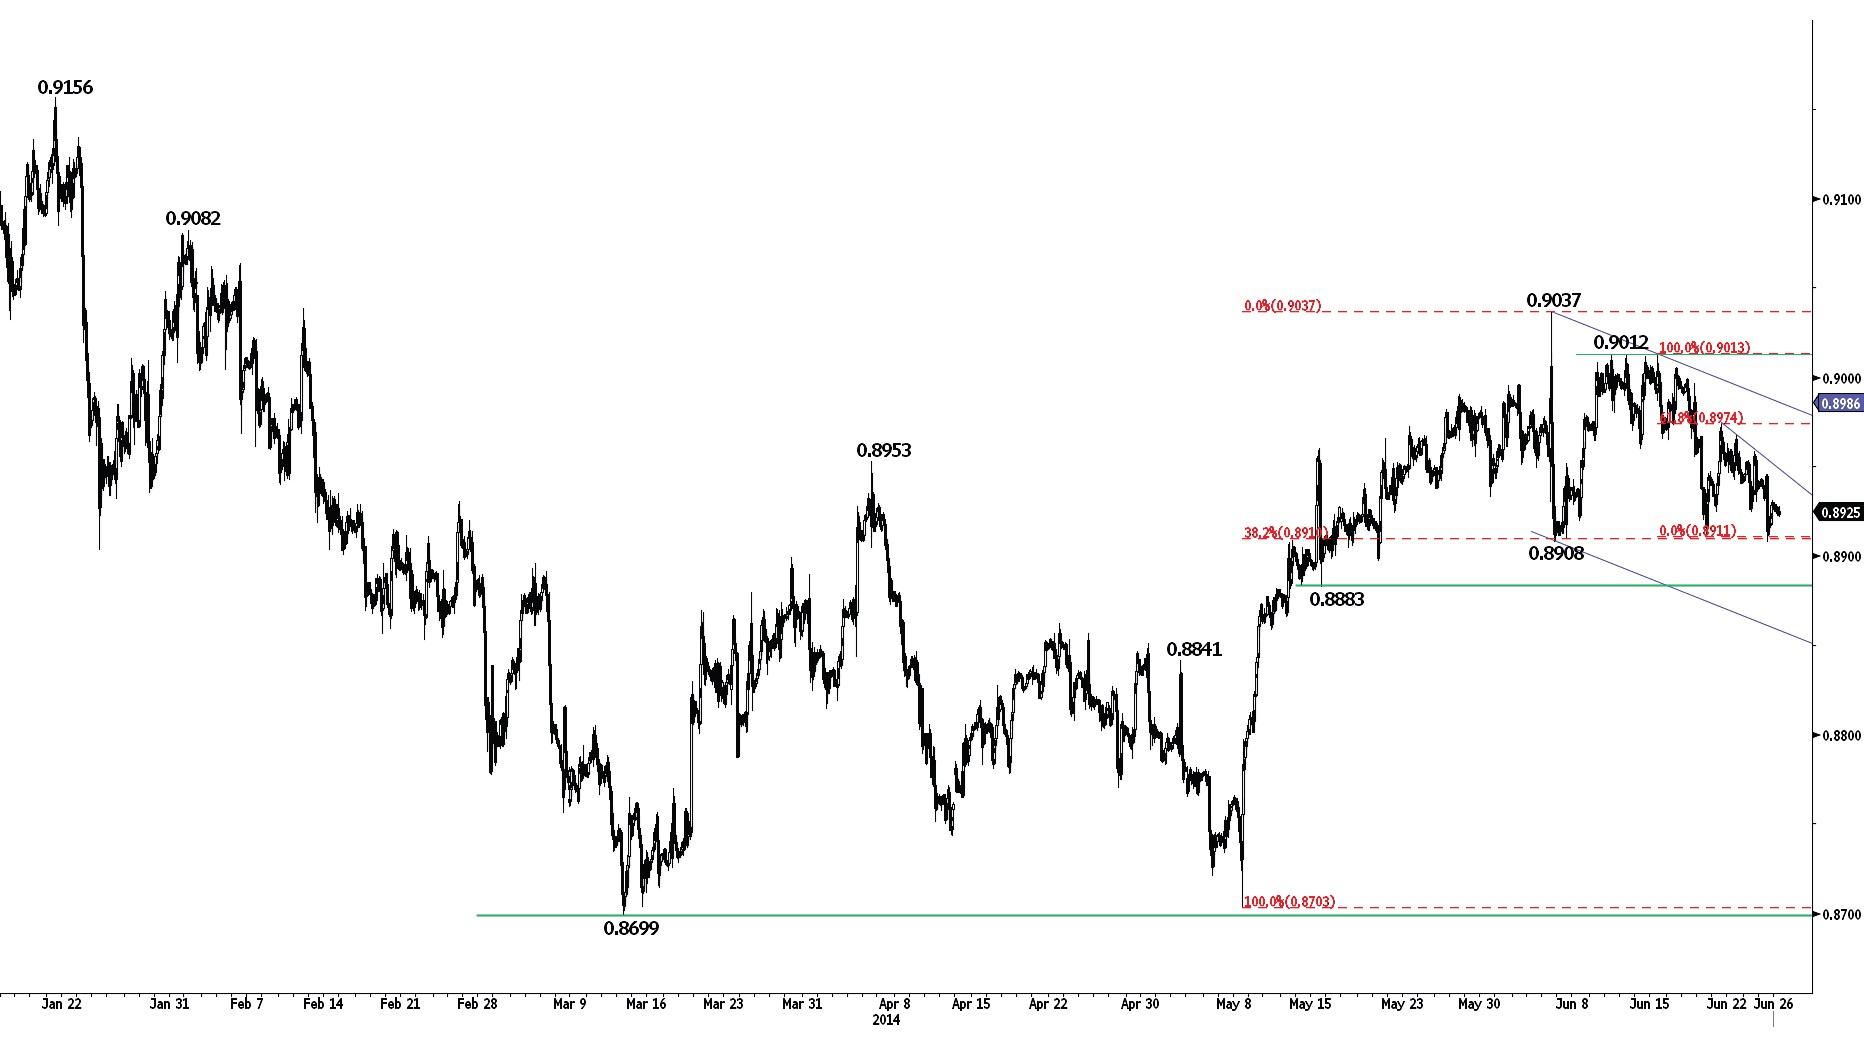
Recent succession of lower highs intact.
USD/CHF has again successfully tested the support at 0.8908 (05/06/2014 low, see also the 38.2% retracement). However, the short-term succession of lower highs needs to be broken to signal exhaustion in the selling pressure. An hourly resistance stands at 0.8974 (61.8% retracement). A strong resistance area lies between 0.9012 and 0.9037. Another support lies at 0.8883.
From a longer term perspective, the bullish breakout of the key resistance at 0.8953 suggests the end of the large corrective phase that started in July 2012. The long-term upside potential implied by the double-bottom formation is 0.9207. A key resistance stands at 0.9156 (21/01/2014 high).
Long 1 unit at 0.8794, Obj: Close remaining at 0.9115, Stop: 0.8872 (Entered: 2014-05-08).
USD/CAD
Making new lows.
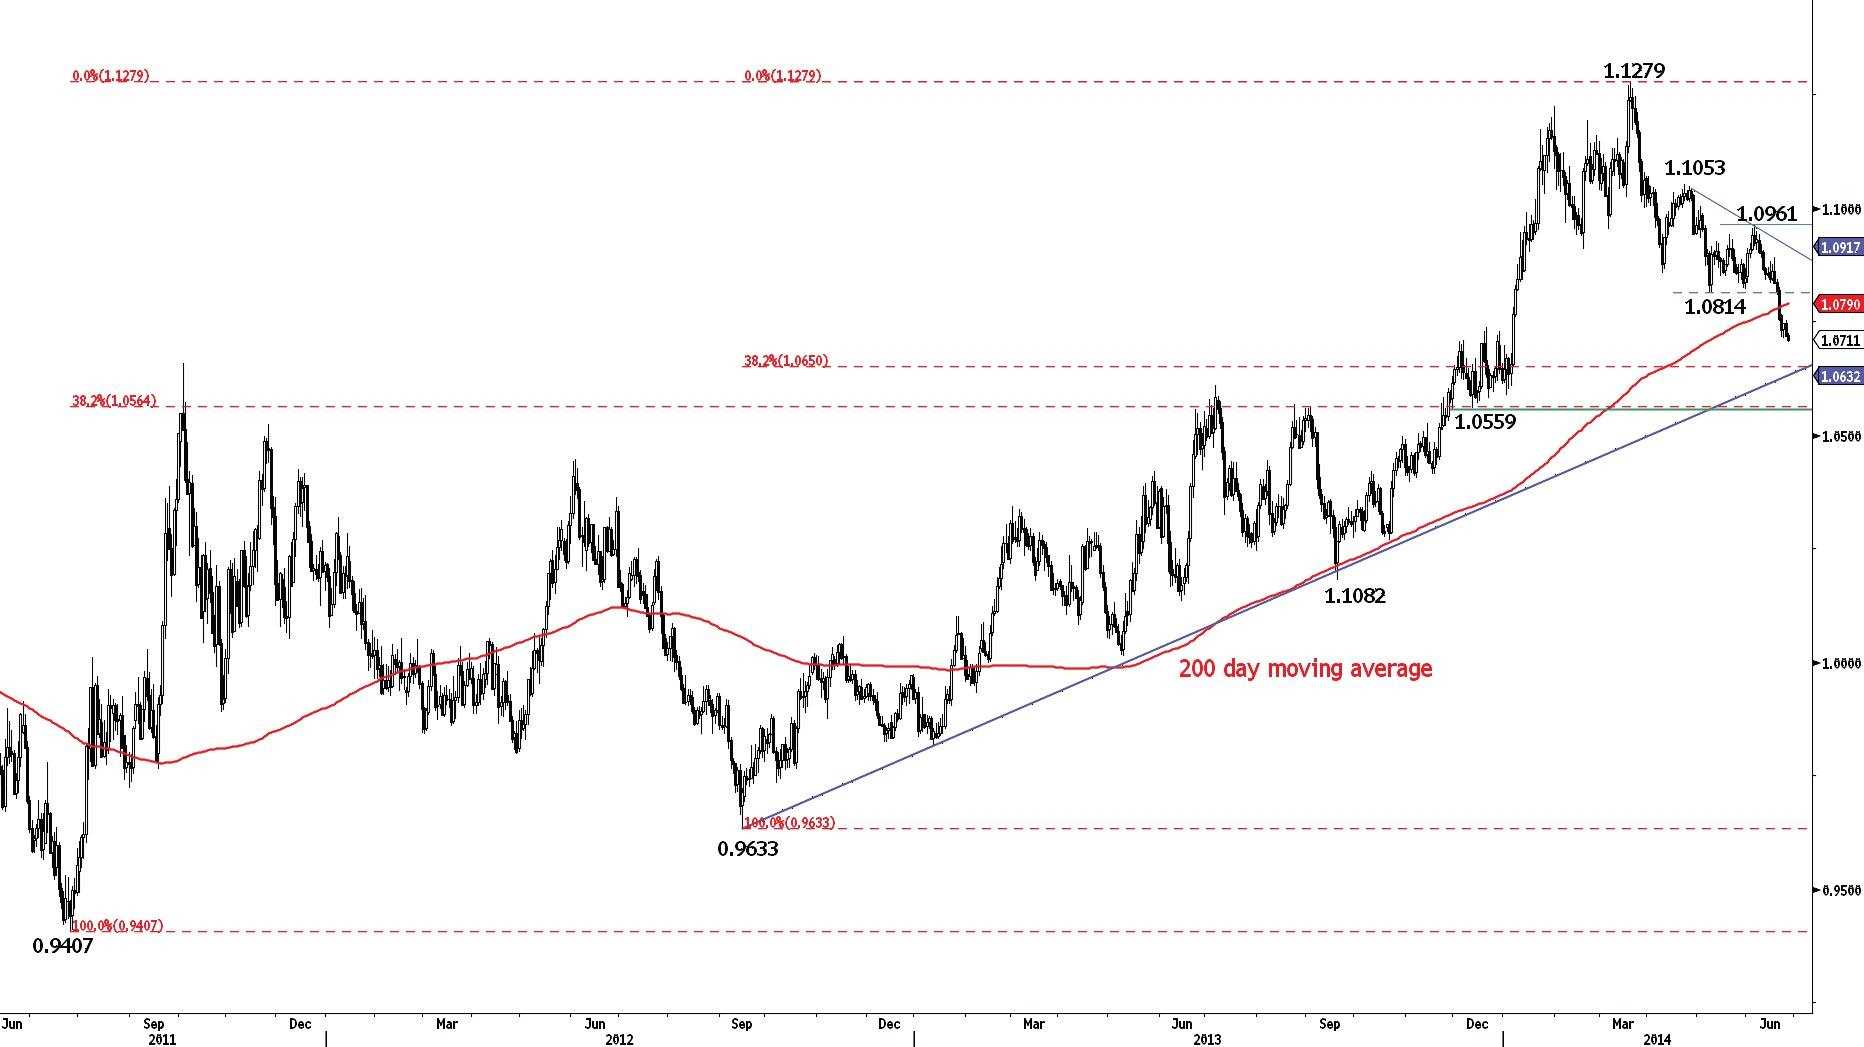
USD/CAD has broken a key support at 1.0814, ending a 5 week consolidation. The momentum is negative as long as prices remain below the resistance at 1.0833 (intraday high). A test of the support implied by the long-term rising trendline (around 1.0632) is expected. An initial resistance now lies at 1.0752 (25/06/2014 high).
In the longer term, the technical structure looks like a rounding bottom with a minimum target at 1.1725. However, a break of the support area implied by the long-term rising trendline (around 1.0632) and 1.0559 (29/11/2013 low) would invalidate this long-term bullish configuration.
Await fresh signal.
AUD/USD
Buying interest remains strong.
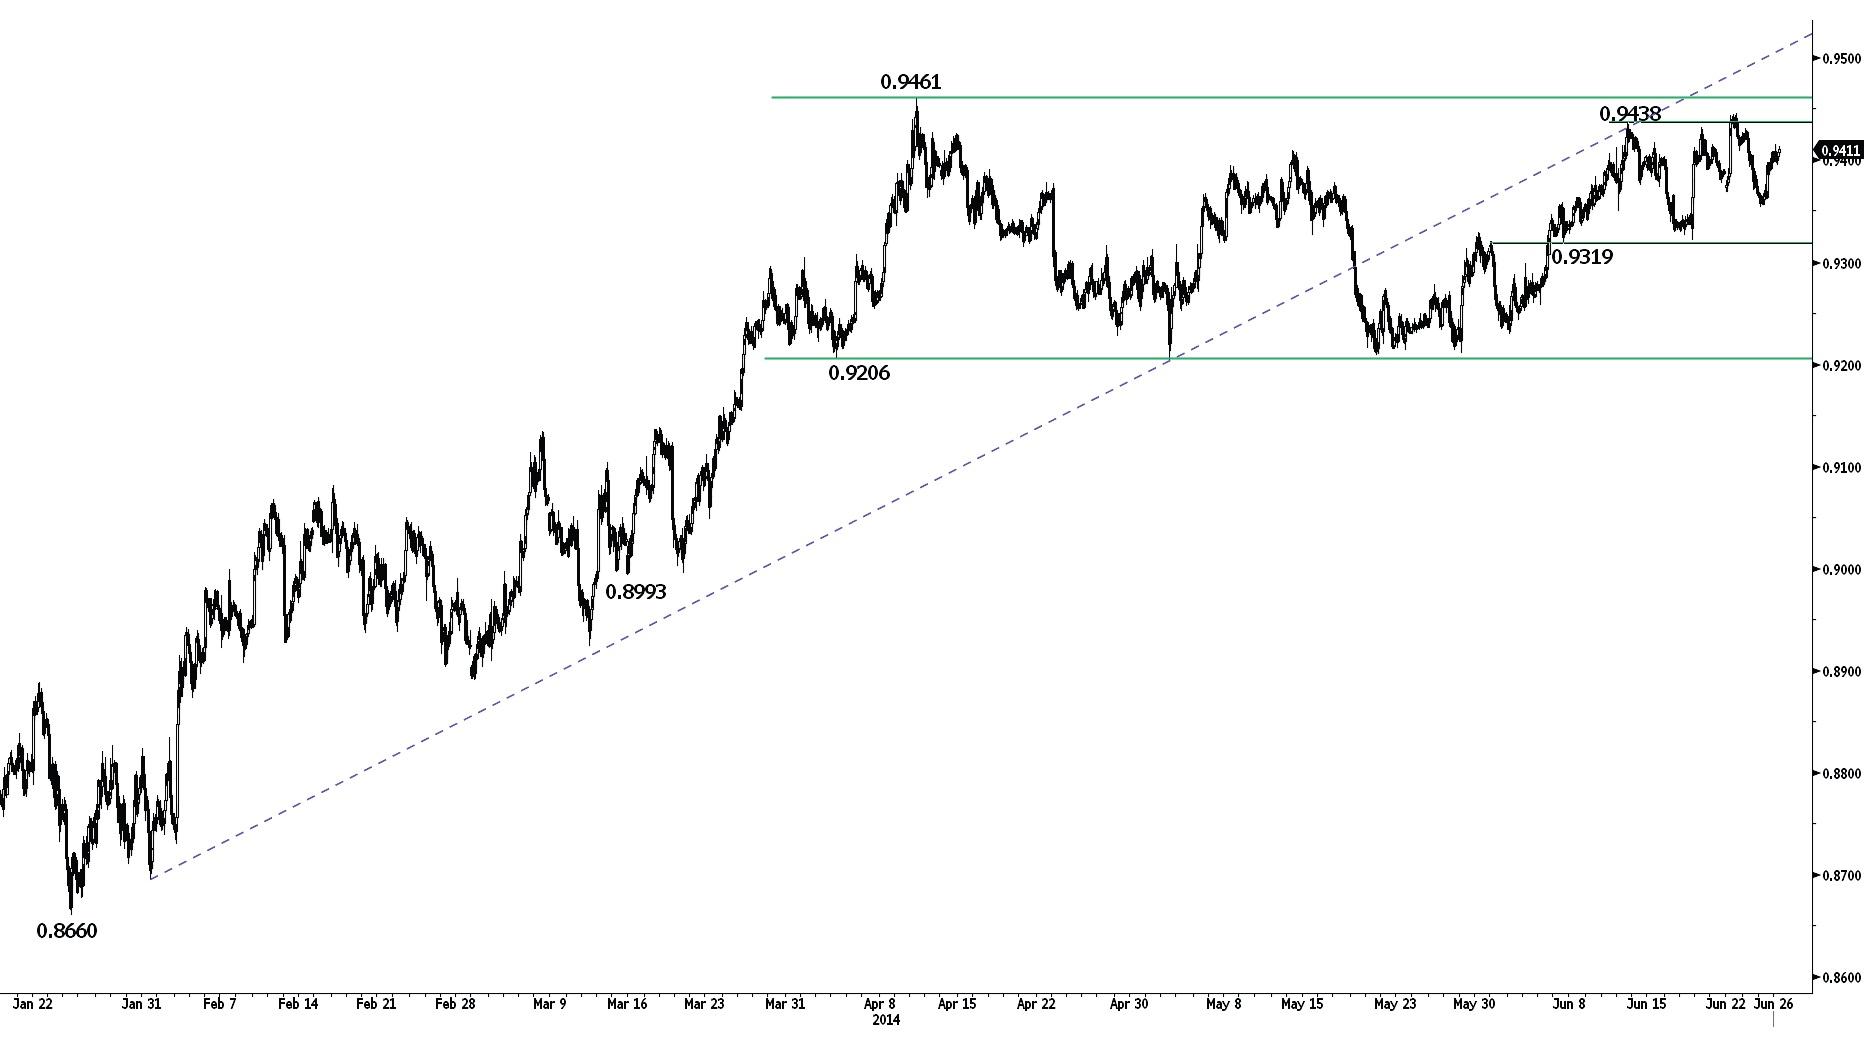
AUD/USD has weakened after having failed to break the significant resistance area between 0.9438 (12/06/2014 high) and 0.9461. The lack of follow-through after the break of the hourly support at 0.9369 (23/06/2014 low) indicates a persistent buying interest. Hourly supports now stand at 0.9354 (25/06/2014 low) and 0.9319.
In the medium-term, prices are moving within a horizontal range between 0.9206 and 0.9461. The direction of the breakout is likely to give the next significant trend. For the time being, we favour further sideways moves.
Await fresh signal.
GBP/JPY
Monitor the support at 172.73.
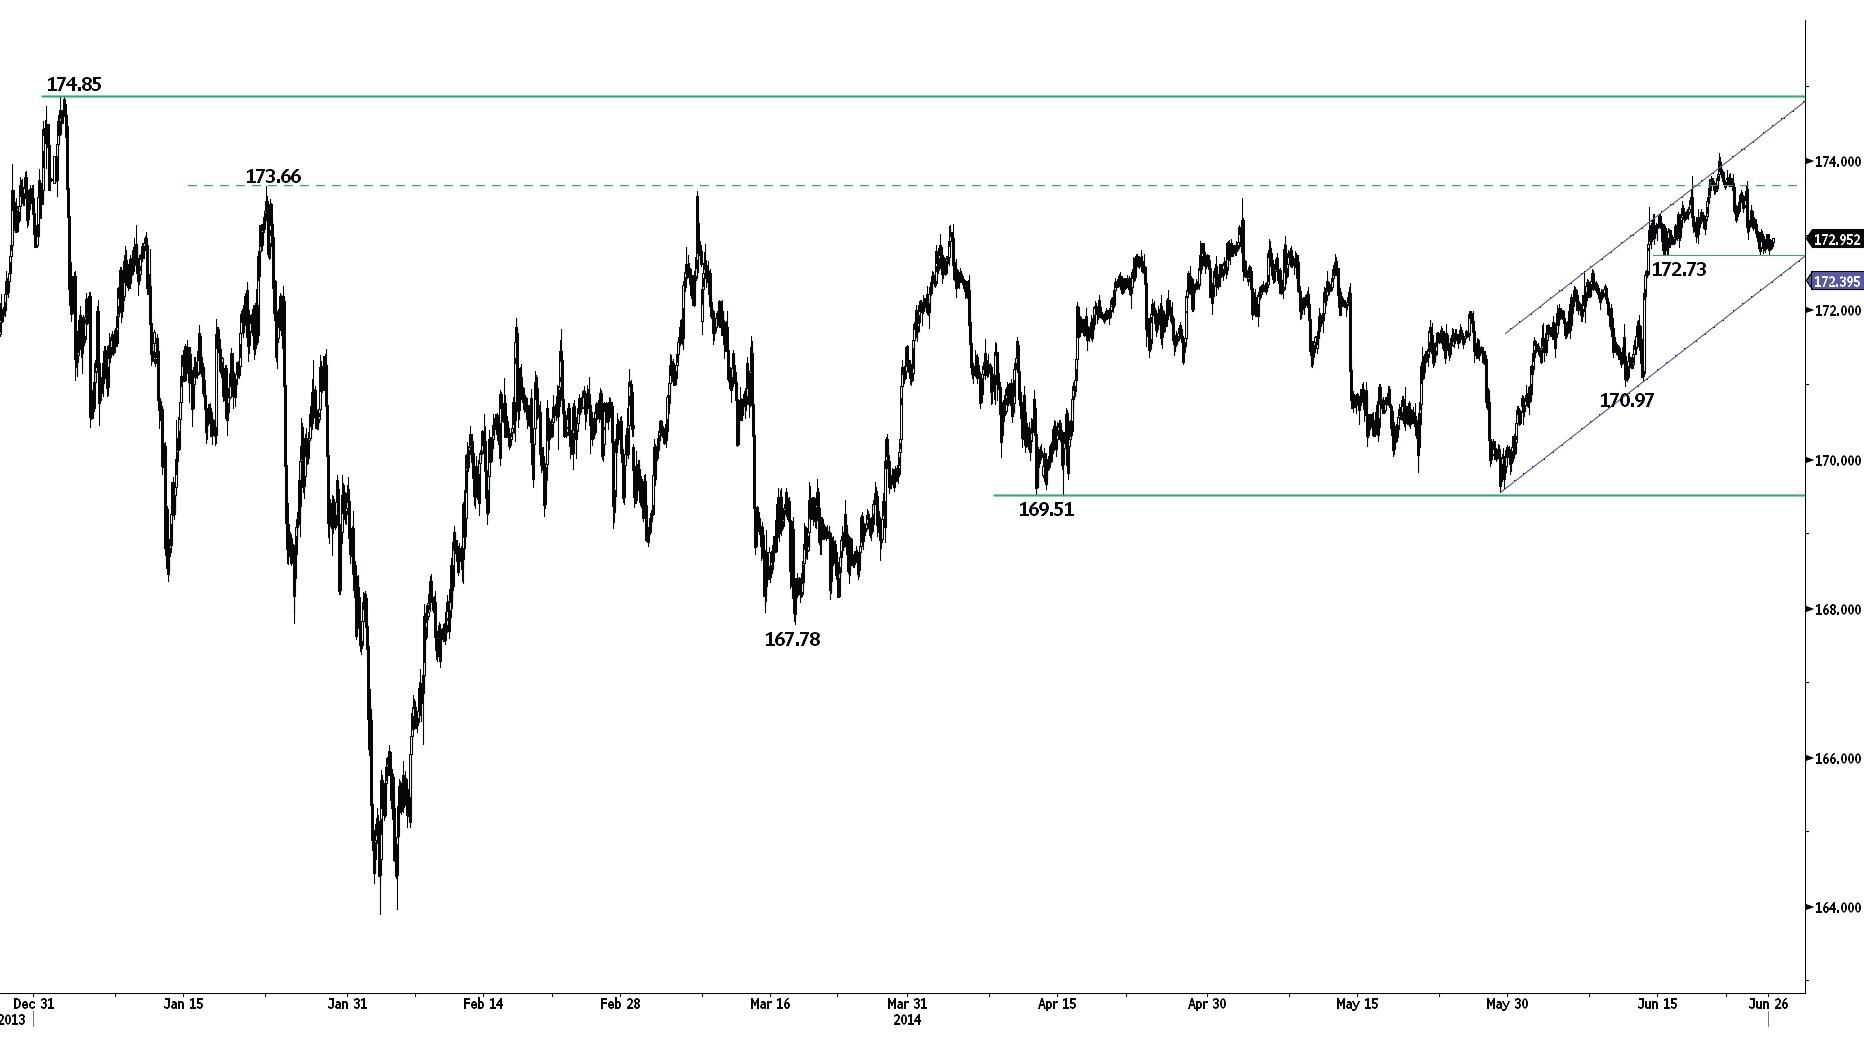
GBP/JPY has weakened near the key resistance at 173.66 and is now challenging the hourly support at 172.73. A break of this level would negate the current short-term bullish bias. Other supports are given by the rising channel (around 172.40) and 170.97.
In the long-term, the break of the major resistance at 163.09 (07/08/2009 high) calls for further strength towards the resistance at 179.17 (15/08/2002 low). The long-term technical structure remains supportive as long as the key support area defined by 163.89 (04/02/2014 low) and the 200 day moving average (see also the long-term rising trendline from the February 2013 low) holds. A key resistance lies at 174.85 (02/01/2014 high).
Await fresh signal.
EUR/JPY
Continues to struggle near the resistance at 138.89.
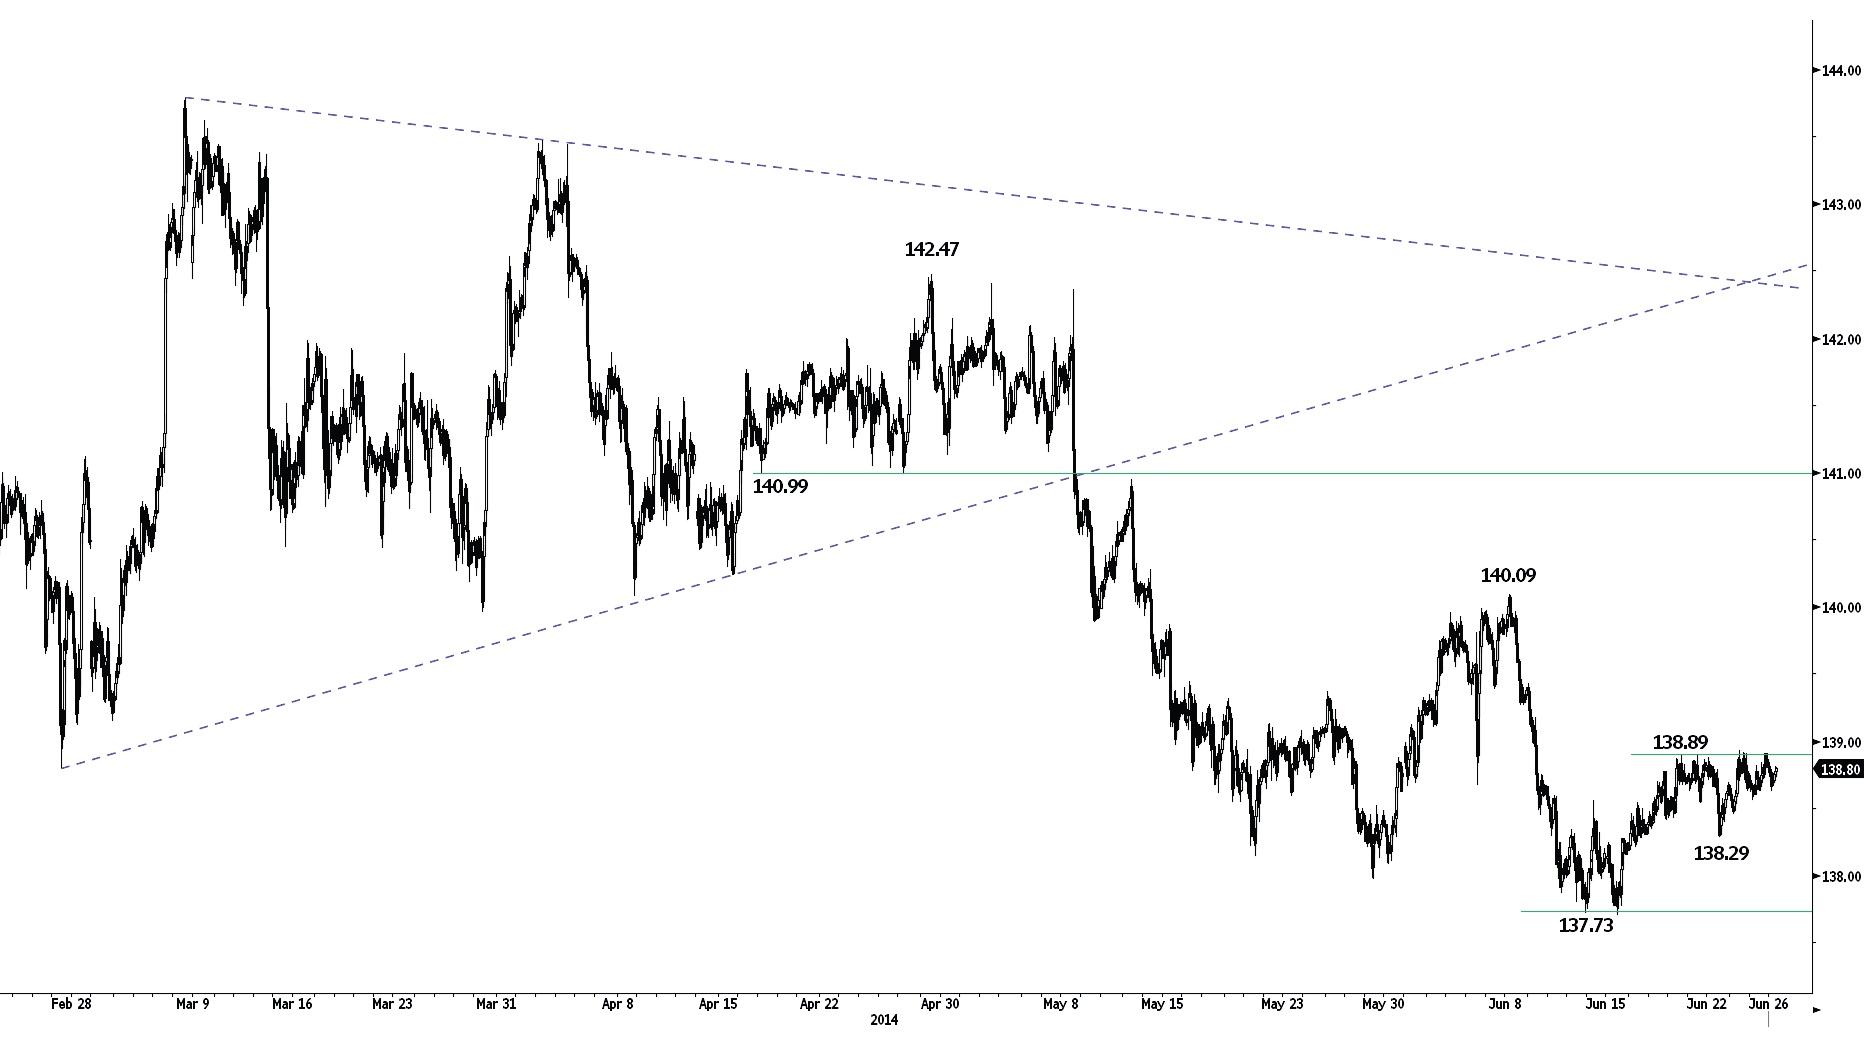
EUR/JPY has thus far failed to move back above its 200 day moving average, indicating persistent selling pressures. Monitor the resistance at 138.89 (19/06/2014 high). An hourly support lies at 138.29 (23/06/2014 low), while a more significant support stands at 137.73. Other resistances can be found at 139.43 (10/06/2014 high) and 140.09.
Despite the strong support at 136.23 (04/02/2014 low), the long-term technical structure remains positive as long as the support at 134.11 (20/11/2013 low) holds. A strong resistance stands at 145.69 (27/12/2013 high).
Await fresh signal.
EUR/GBP
Bouncing near the support at 0.7961.
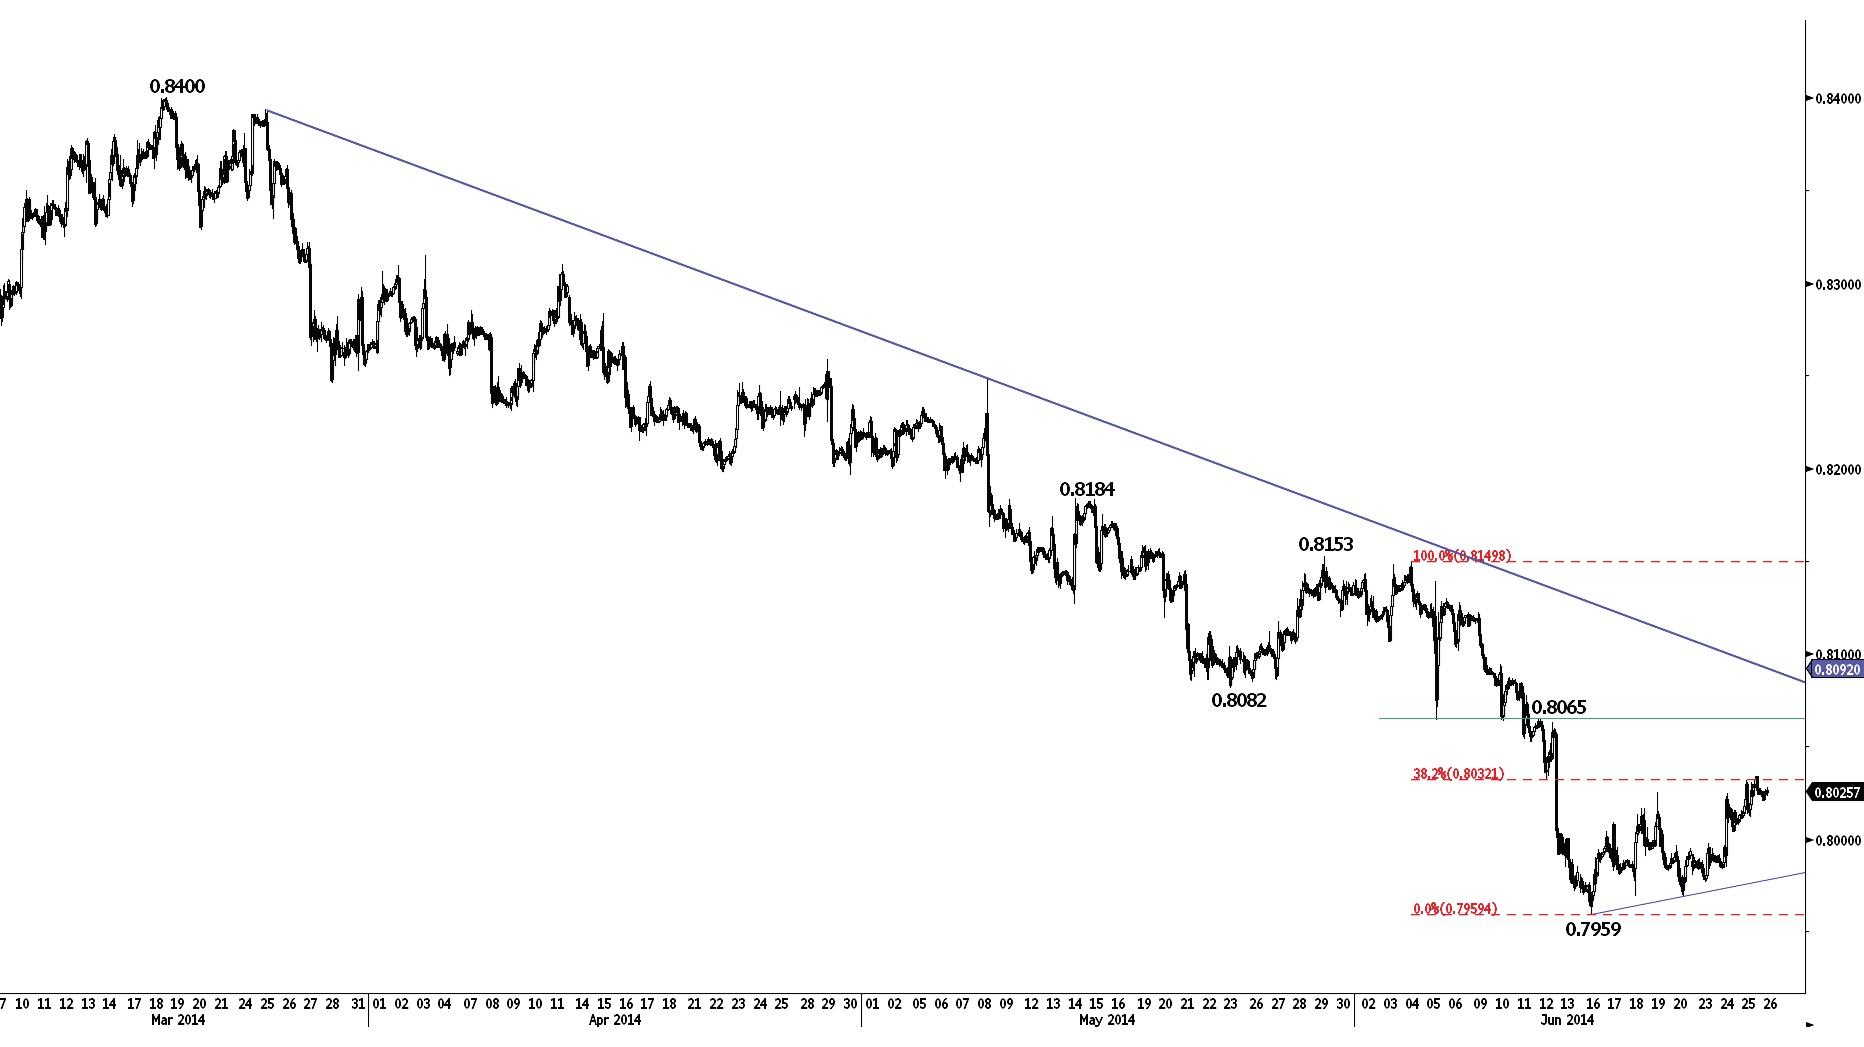
EUR/GBP is bouncing near the key support at 0.7961 (08/11/2012 low). A break of the hourly resistance at 0.8033 (intraday low) is needed to indicate some exhaustion in the selling pressures. Other hourly resistances are given by 0.8065 (12/06/2014 high) and the declining trendline (around 0.8092).
In the longer term, the break of the key support area between 0.8082 and 0.8065 (05/06/2014 low) opens the way for a full retracement of the rise that started at 0.7755 (23/07/2012 low). A break of the resistance at 0.8184 (14/05/2014 high) is needed to suggest some exhaustion in the long-term selling pressures.
Await fresh signal.
EUR/CHF
Succession of lower highs intact.
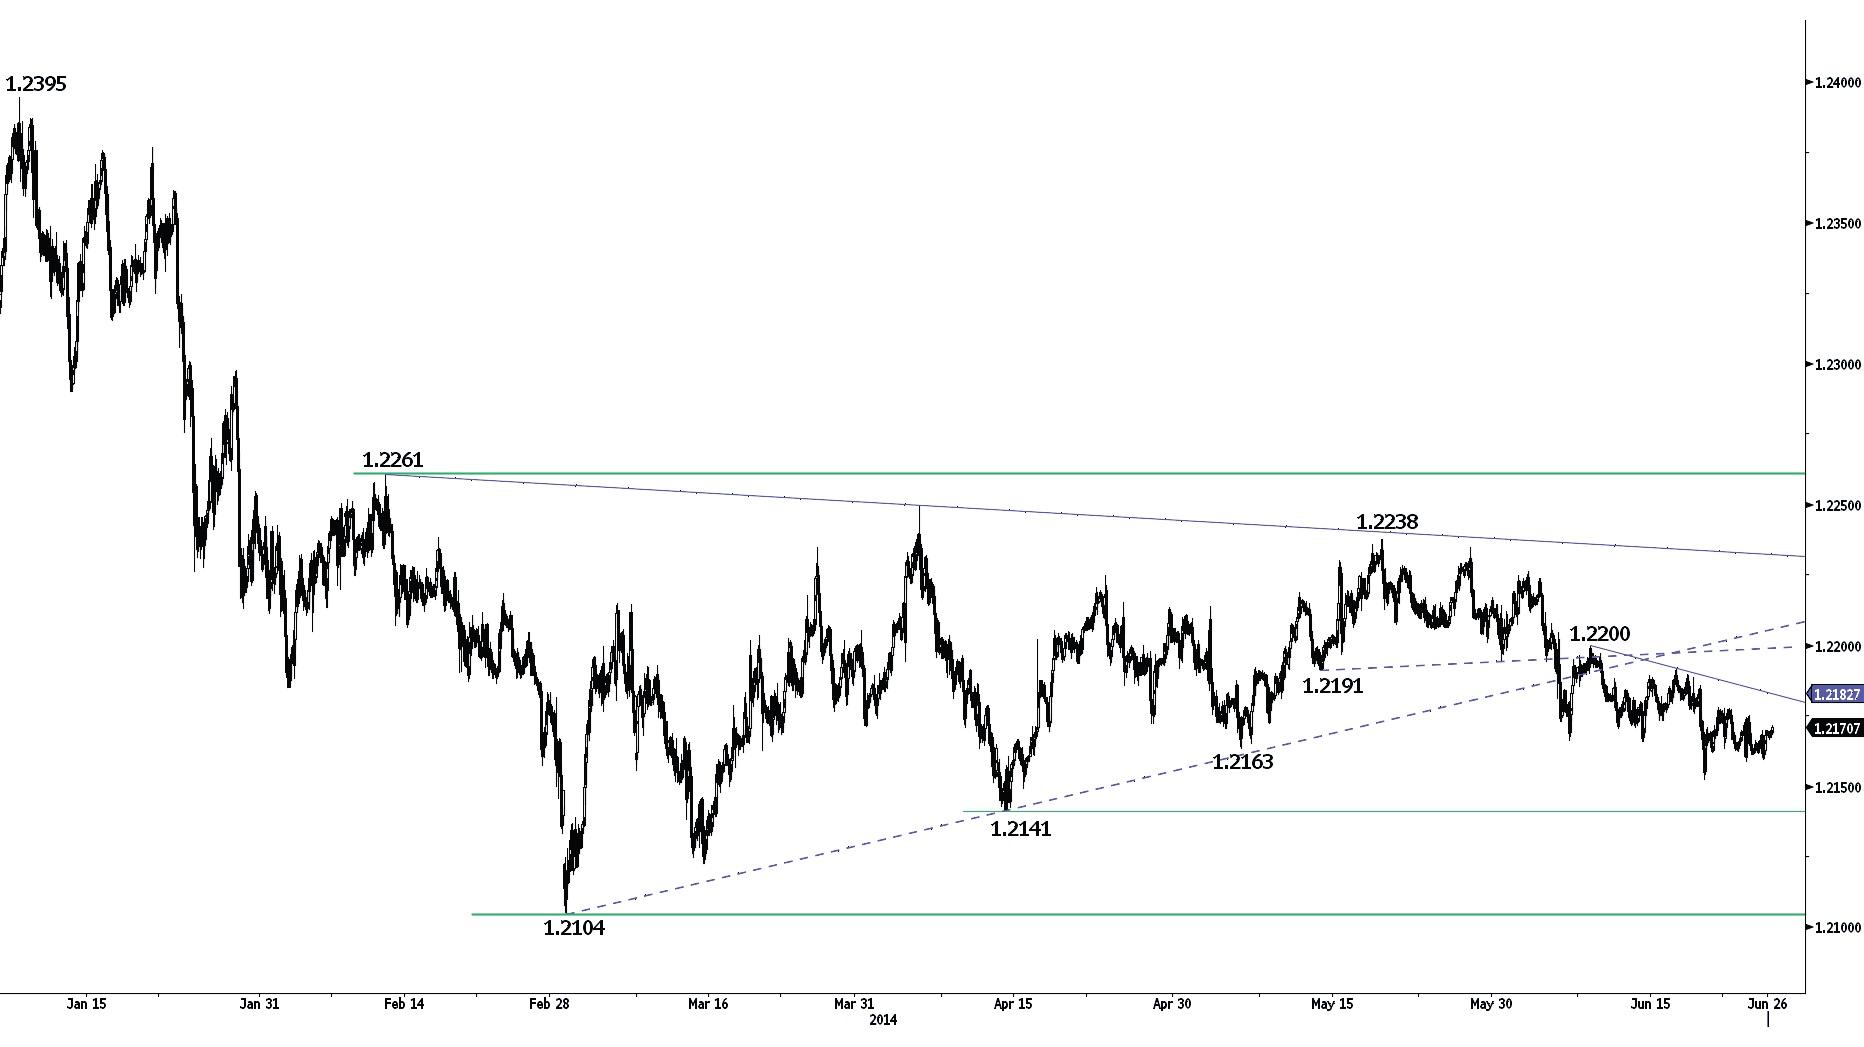
EUR/CHF remains weak, as can be seen by the persistent succession of lower highs. An hourly resistance can be found at 1.2178 (20/06/2014 high). However, a break of the resistance at 1.2200 (09/06/2014 high) is needed to negate the downside risk implied by the recent break of the symmetrical triangle. Supports lie at 1.2152 (19/06/2014 low) and 1.2141.
In the longer term, prices are moving in a broad horizontal range between the key support at 1.2104 and the resistance at 1.2261.
In September 2011, the SNB put a floor at 1.2000 in EUR/CHF, which is expected to hold in the foreseeable future.
Long 3 units at 1.2329, Objs: 1.2660/1.2985/1.3195, Stop: 1.1998 (Entered: 2013-01-23).
GOLD (in USD)
Monitor the support at 1307.
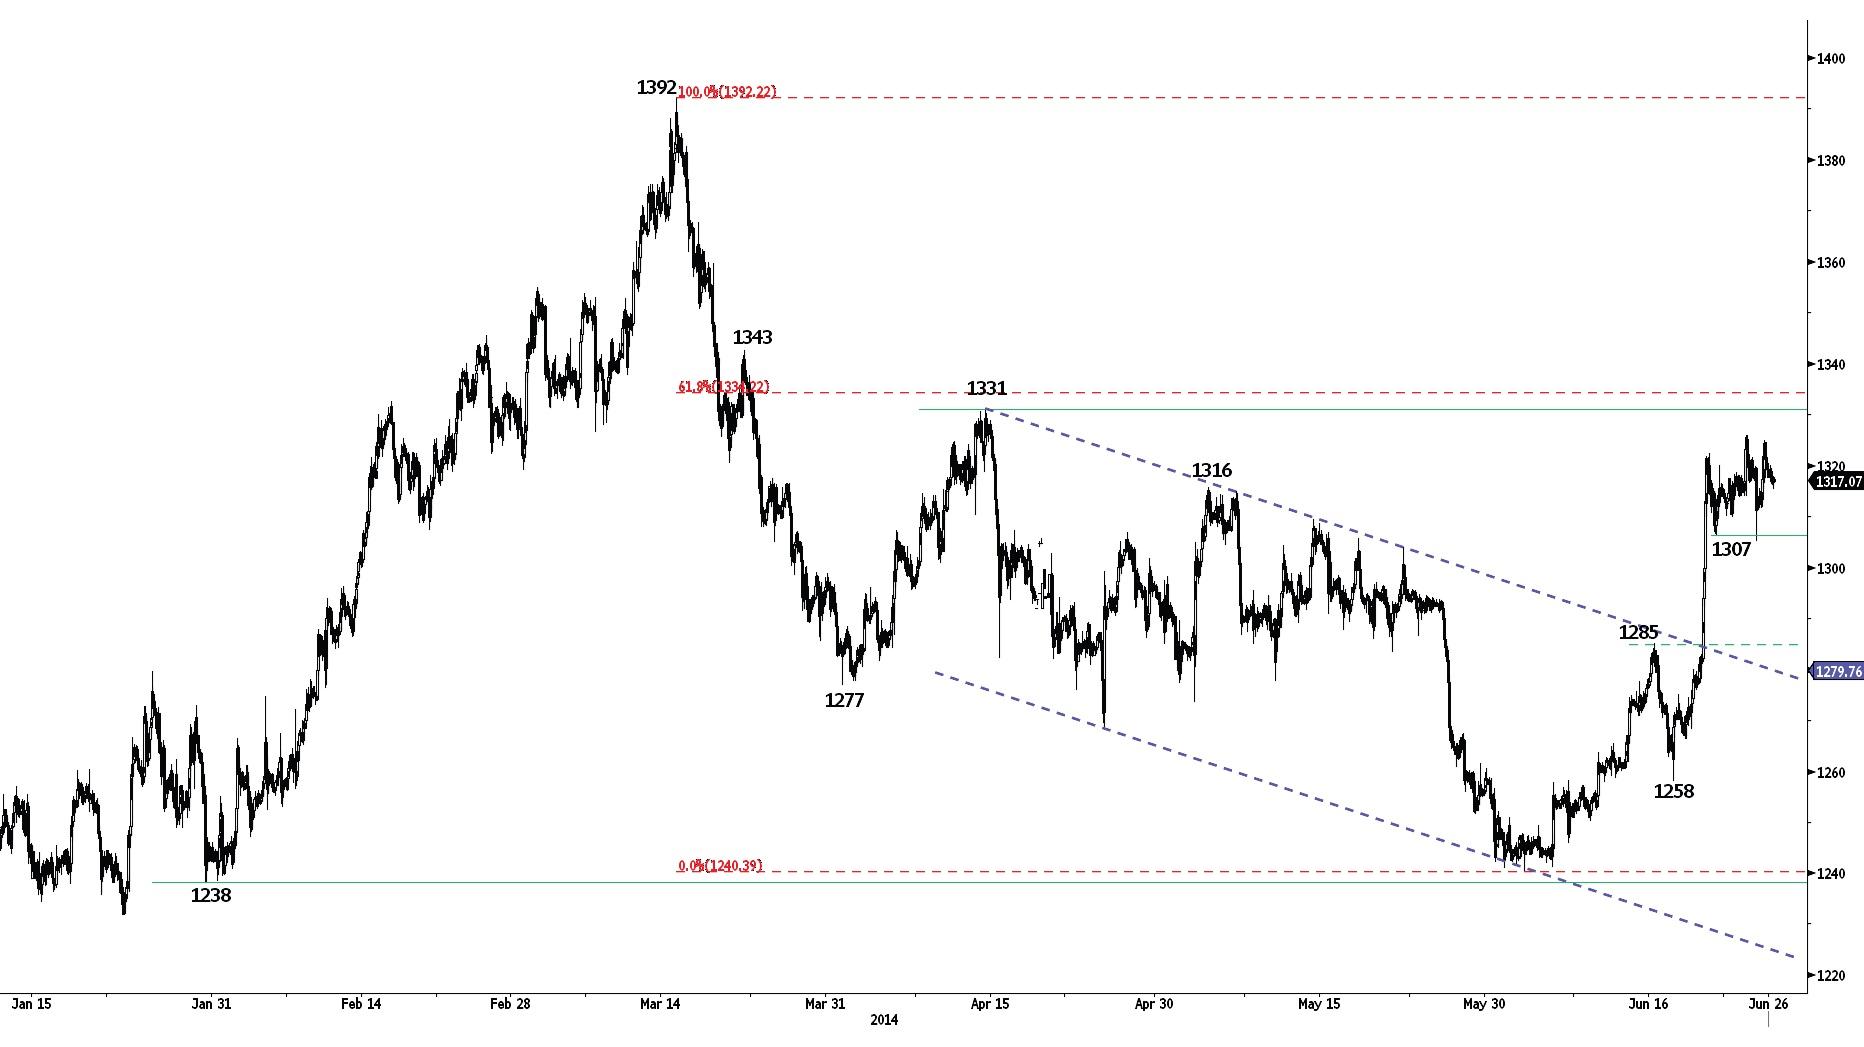
Gold is showing signs of weakness near the key resistance at 1331 (see also the 61.8% retracement). Monitor the hourly support at 1307, as a decisive break would open the way for a short-term decline towards the support at 1285.
Longer term, we are sceptical that the horizontal range between the strong support at 1181 (28/06/2013 low) and the major resistance at 1434 (30/08/2013 high) is a long-term bullish reversal pattern. As a result, a decline towards the low of this range is eventually favoured.
Await fresh signal.
SILVER (in USD)
Hourly double-top underway?
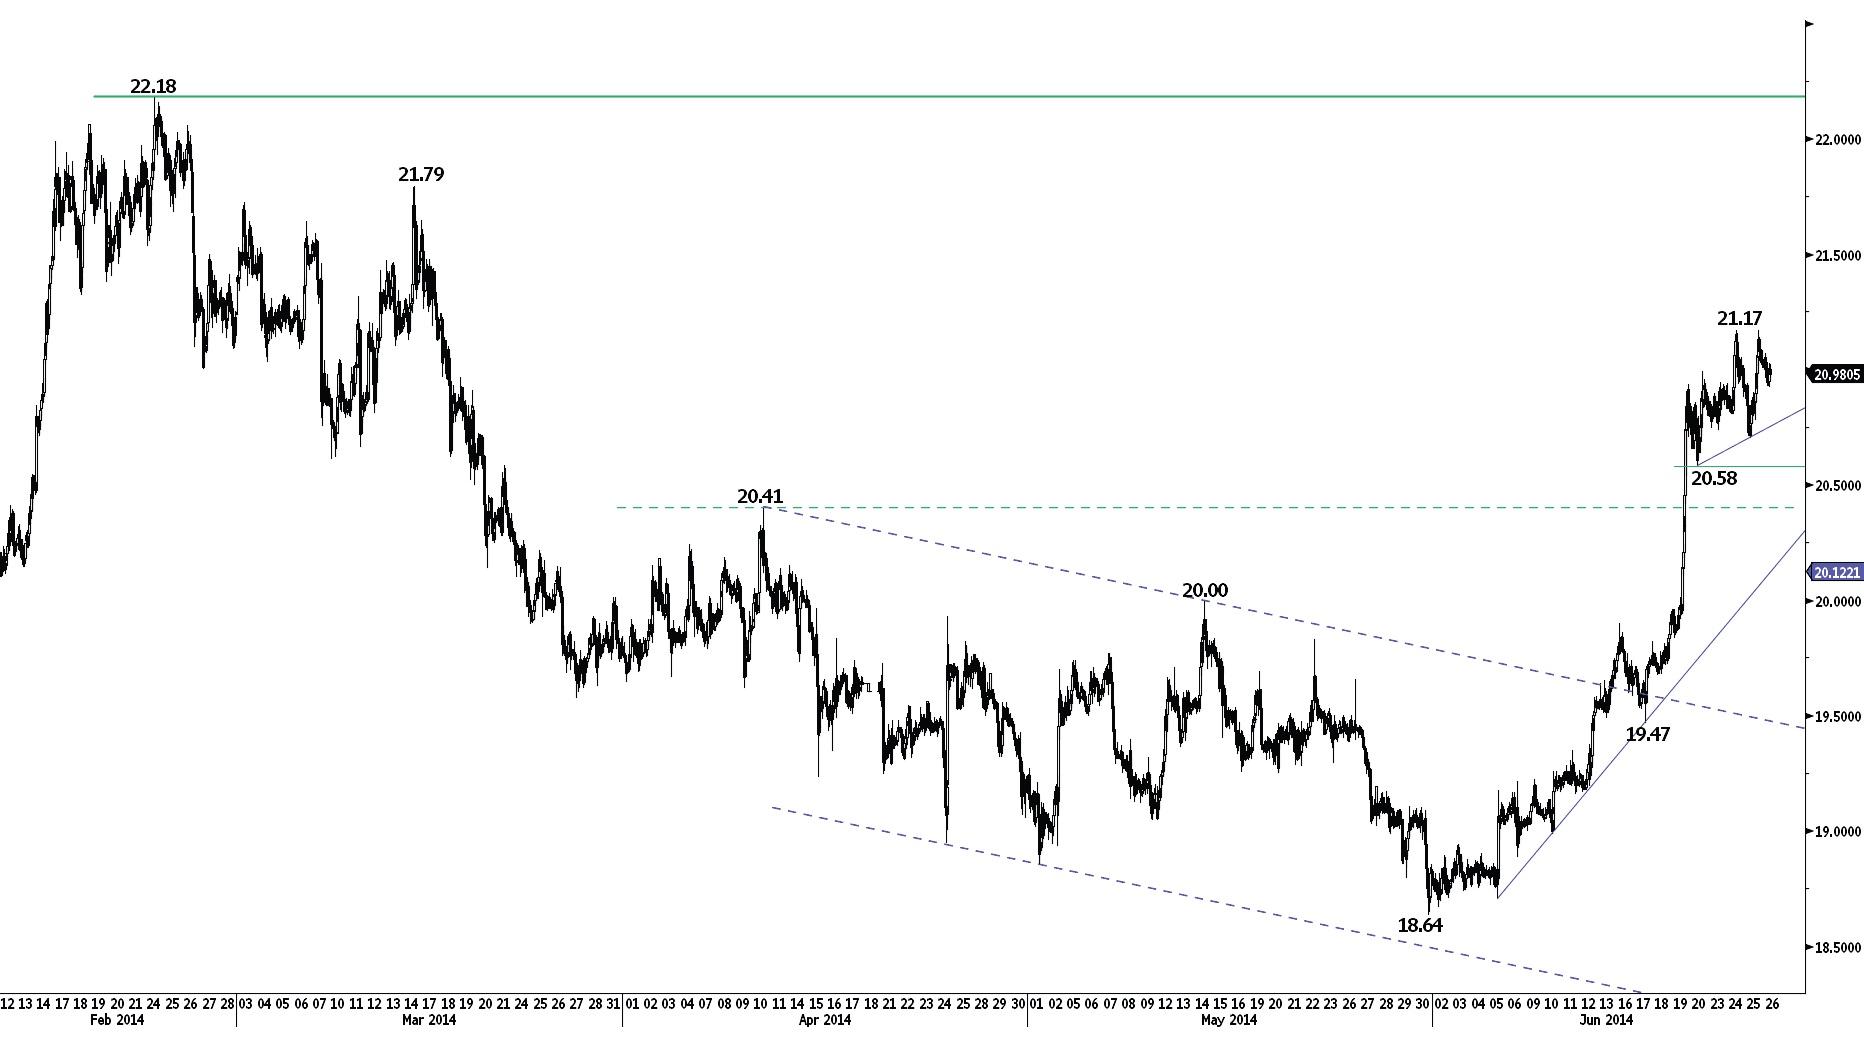
Silver failed yesterday to move above its recent high at 21.17. A break of the initial support at 20.71 (25/06/2014 low) would validate a tiny double-top. Other hourly supports are given by 20.58 and the rising trendline (around 20.12).
In the long-term, the trend is negative. However, the successful test of the strong support area between 18.84 and 18.23 (28/06/2013 low) and the break of the resistance at 20.41 (24/02/2014 high) indicate clear exhaustion in the selling pressures. A key resistance stands at 22.18 (24/02/2014 high).
Await fresh signal.
This report has been prepared by Swissquote Bank Ltd and is solely been published for informational purposes and is not to be construed as a solicitation or an offer to buy or sell any currency or any other financial instrument. Views expressed in this report may be subject to change without prior notice and may differ or be contrary to opinions expressed by Swissquote Bank Ltd personnel at any given time. Swissquote Bank Ltd is under no obligation to update or keep current the information herein, the report should not be regarded by recipients as a substitute for the exercise of their own judgment.
Recommended Content
Editors’ Picks
EUR/USD edges lower toward 1.0700 post-US PCE

EUR/USD stays under modest bearish pressure but manages to hold above 1.0700 in the American session on Friday. The US Dollar (USD) gathers strength against its rivals after the stronger-than-forecast PCE inflation data, not allowing the pair to gain traction.
GBP/USD retreats to 1.2500 on renewed USD strength

GBP/USD lost its traction and turned negative on the day near 1.2500. Following the stronger-than-expected PCE inflation readings from the US, the USD stays resilient and makes it difficult for the pair to gather recovery momentum.
Gold struggles to hold above $2,350 following US inflation

Gold turned south and declined toward $2,340, erasing a large portion of its daily gains, as the USD benefited from PCE inflation data. The benchmark 10-year US yield, however, stays in negative territory and helps XAU/USD limit its losses.
Bitcoin Weekly Forecast: BTC’s next breakout could propel it to $80,000 Premium

Bitcoin’s recent price consolidation could be nearing its end as technical indicators and on-chain metrics suggest a potential upward breakout. However, this move would not be straightforward and could punish impatient investors.
Week ahead – Hawkish risk as Fed and NFP on tap, Eurozone data eyed too

Fed meets on Wednesday as US inflation stays elevated. Will Friday’s jobs report bring relief or more angst for the markets? Eurozone flash GDP and CPI numbers in focus for the Euro.
